-
-
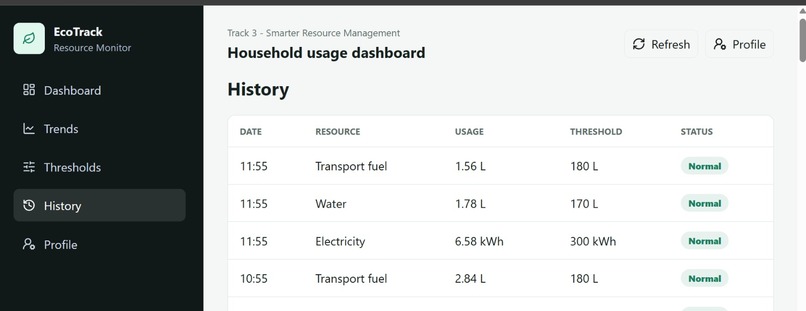
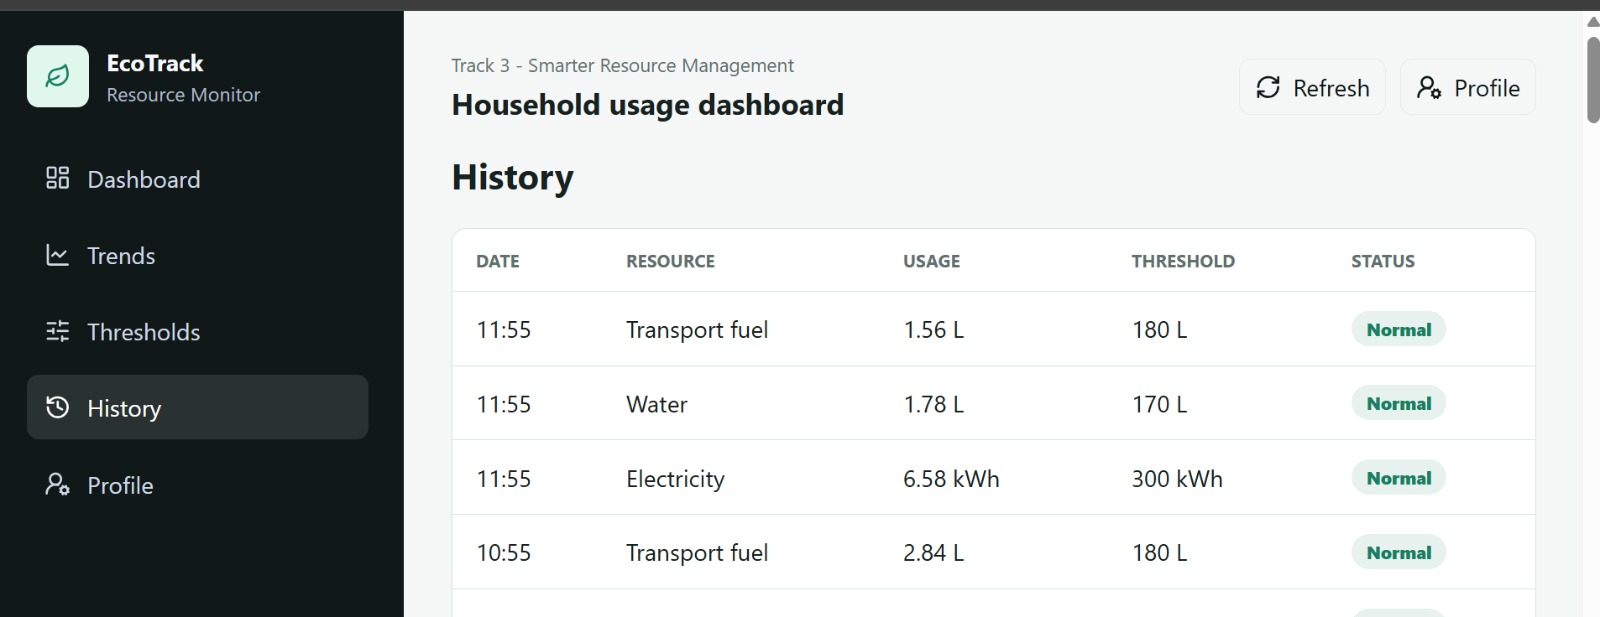
History
-
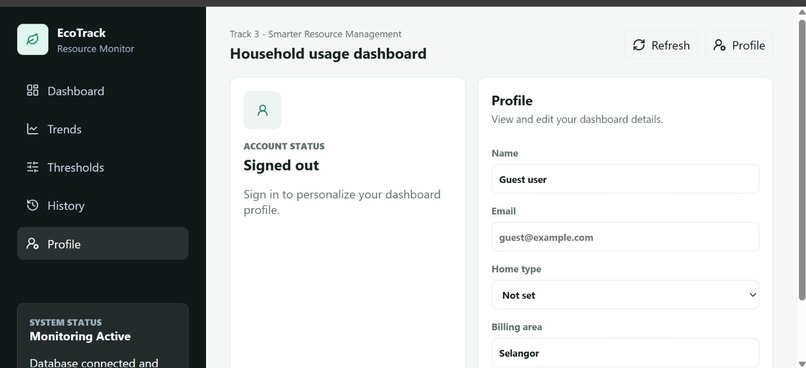
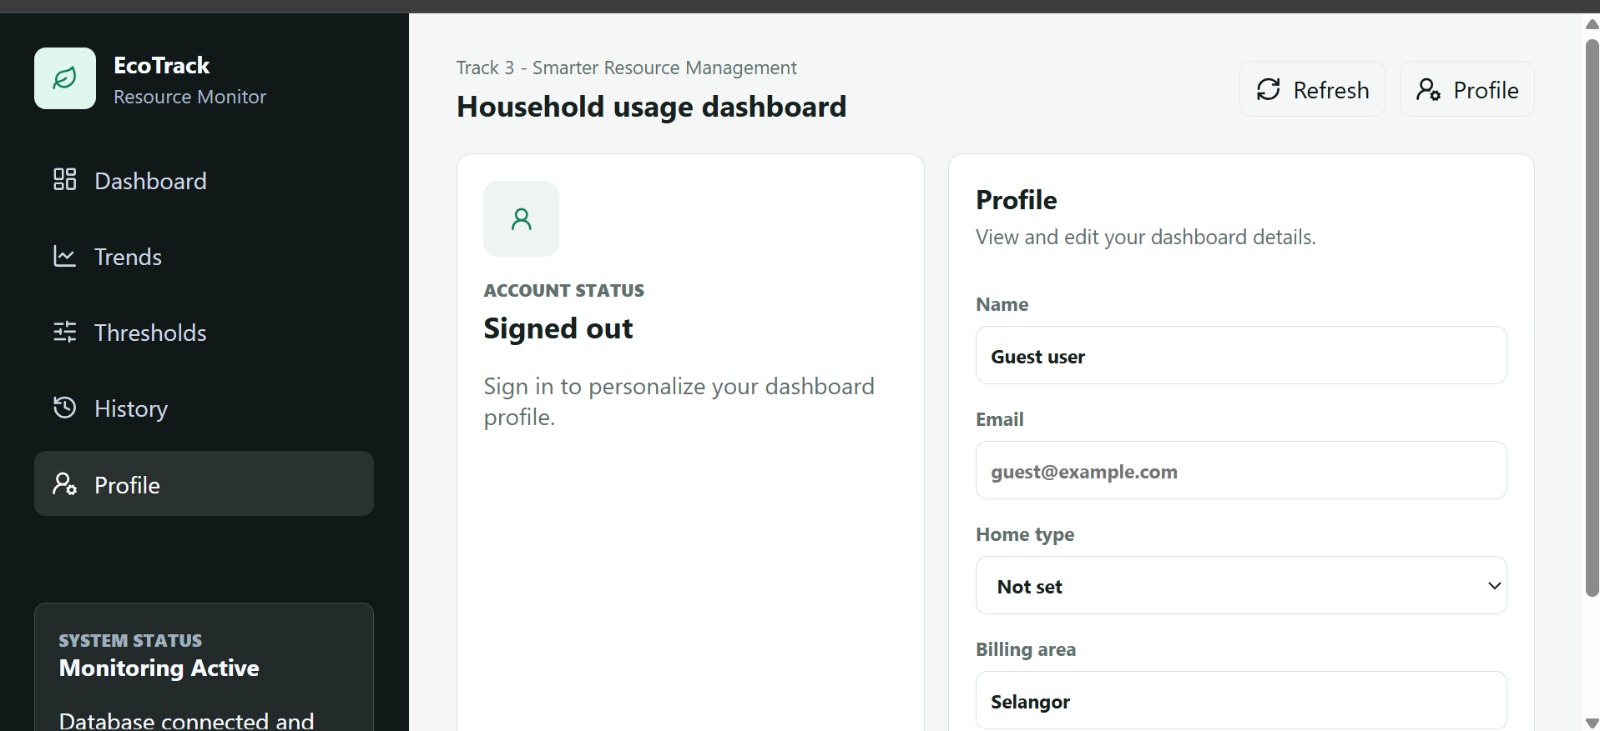
Profile
-
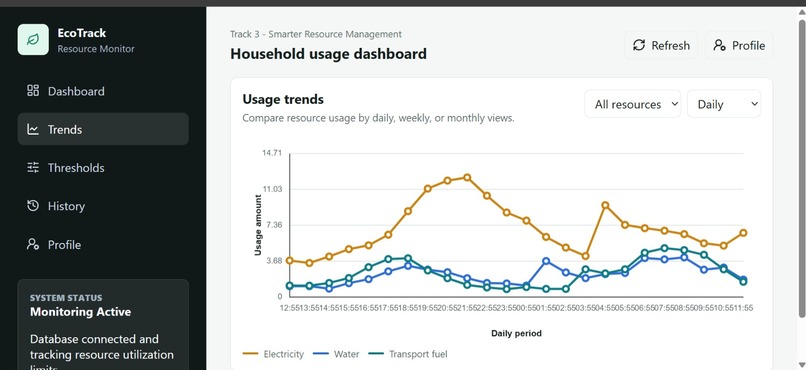
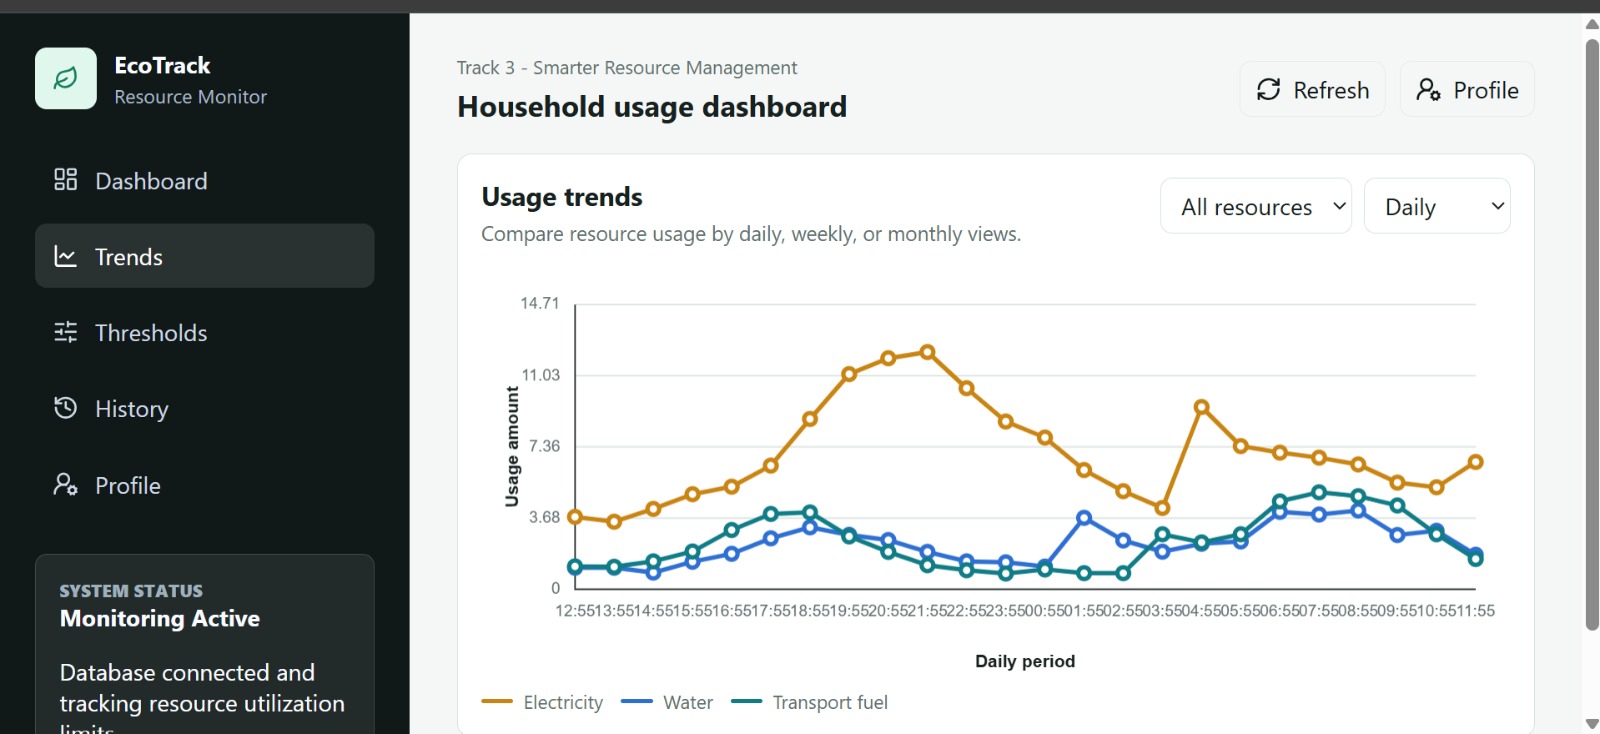
Resource Usage Trends (daily)
-
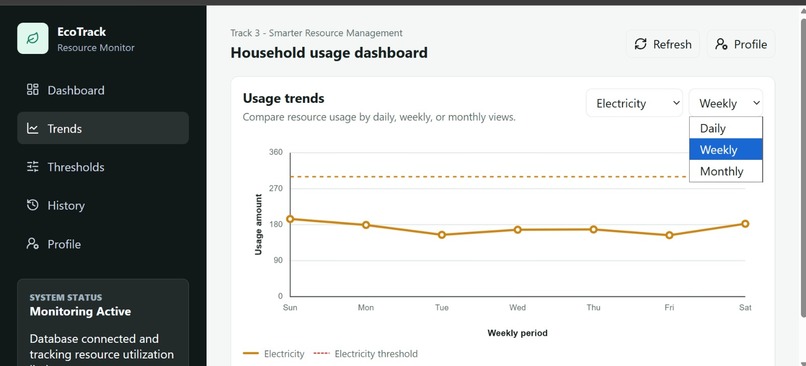
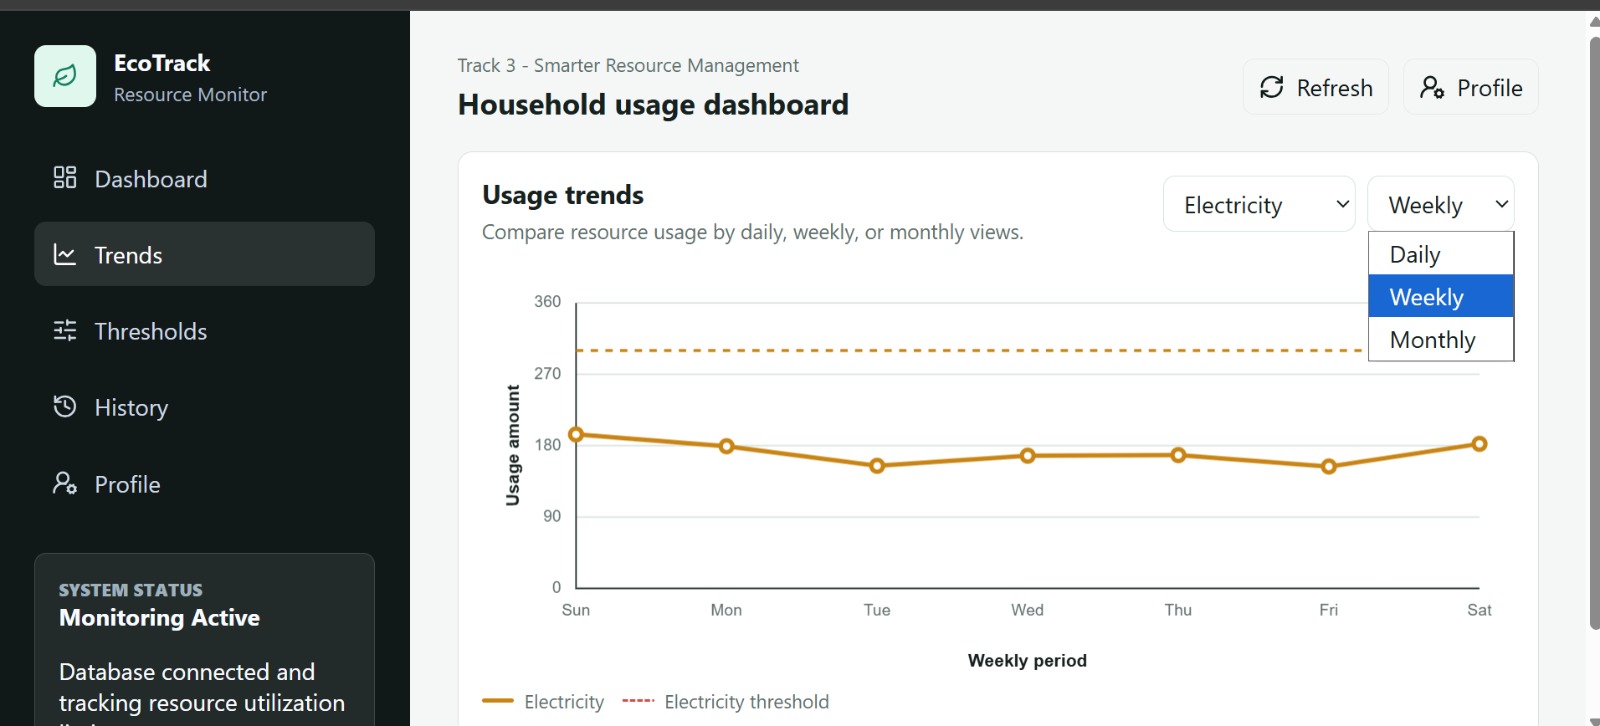
Resource Usage Trends (Electricity-weekly)
-
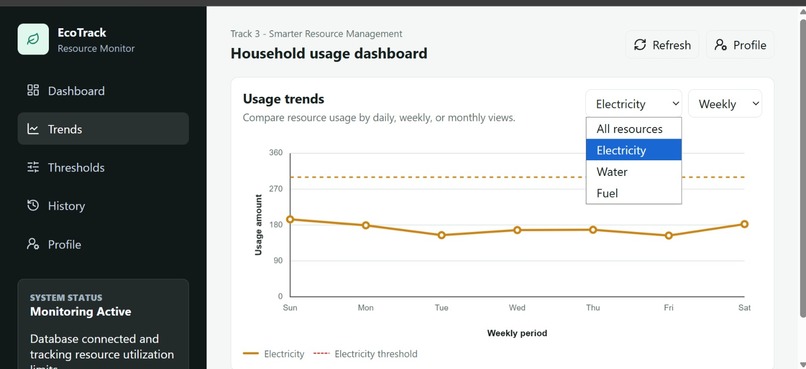
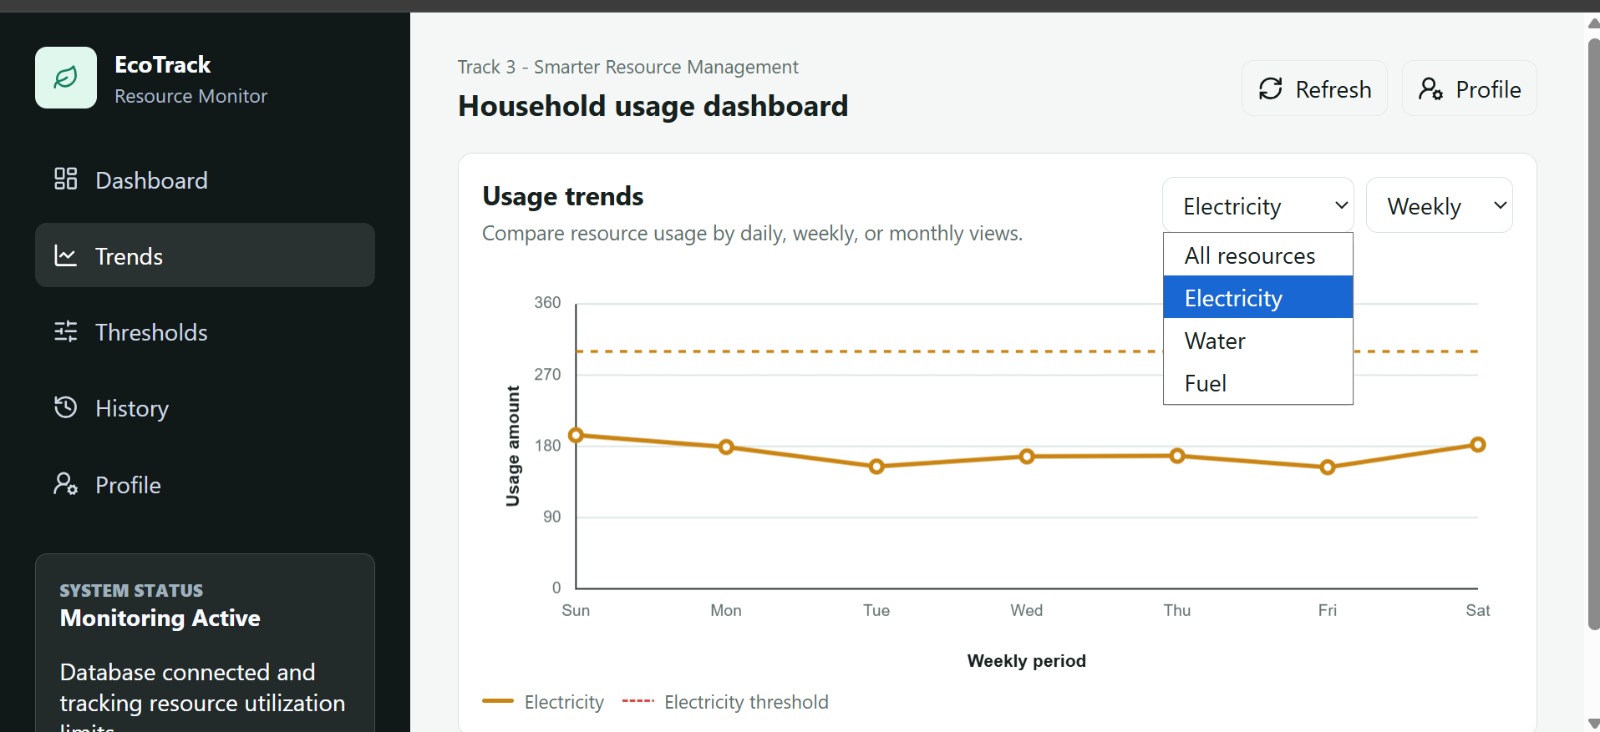
Resource Usage Trends (electricity)
-
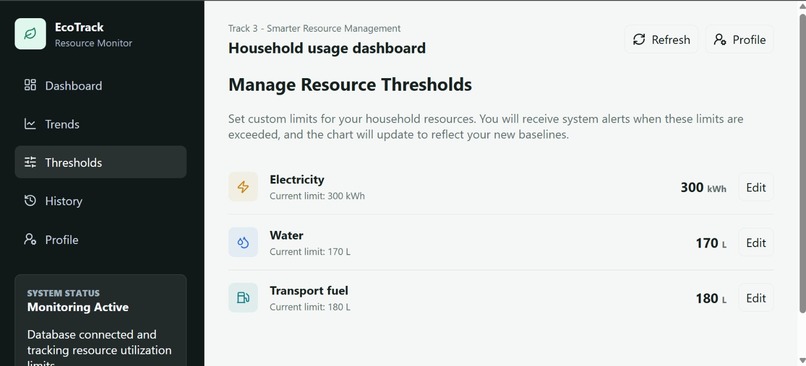
Manage Threshold
-
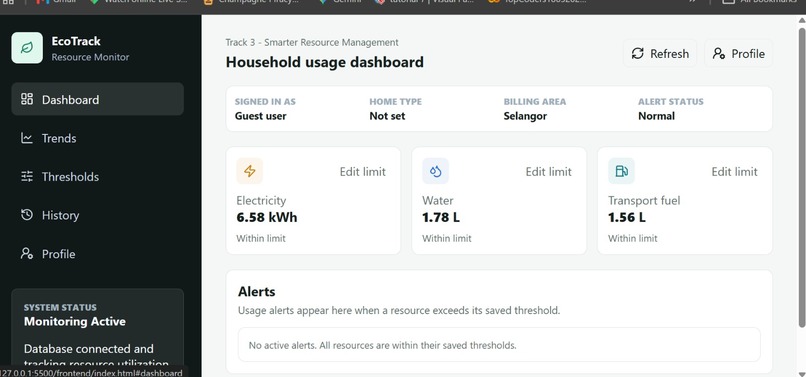
Dashboard
Inspiration
Track 3 of ImagineHack - DoubleDot: Smarter Resource Management, laid out a problem we recognized immediately: businesses and communities routinely lose track of how much electricity, water, and transport fuel they're actually using, and only find out it was too much when the bill arrives. By then it's too late to do anything but absorb the cost. We wanted to build something that closes that gap, a simple dashboard that shows usage as it happens and speaks up the moment it crosses a line, instead of waiting for a monthly statement to tell the story.
What it does
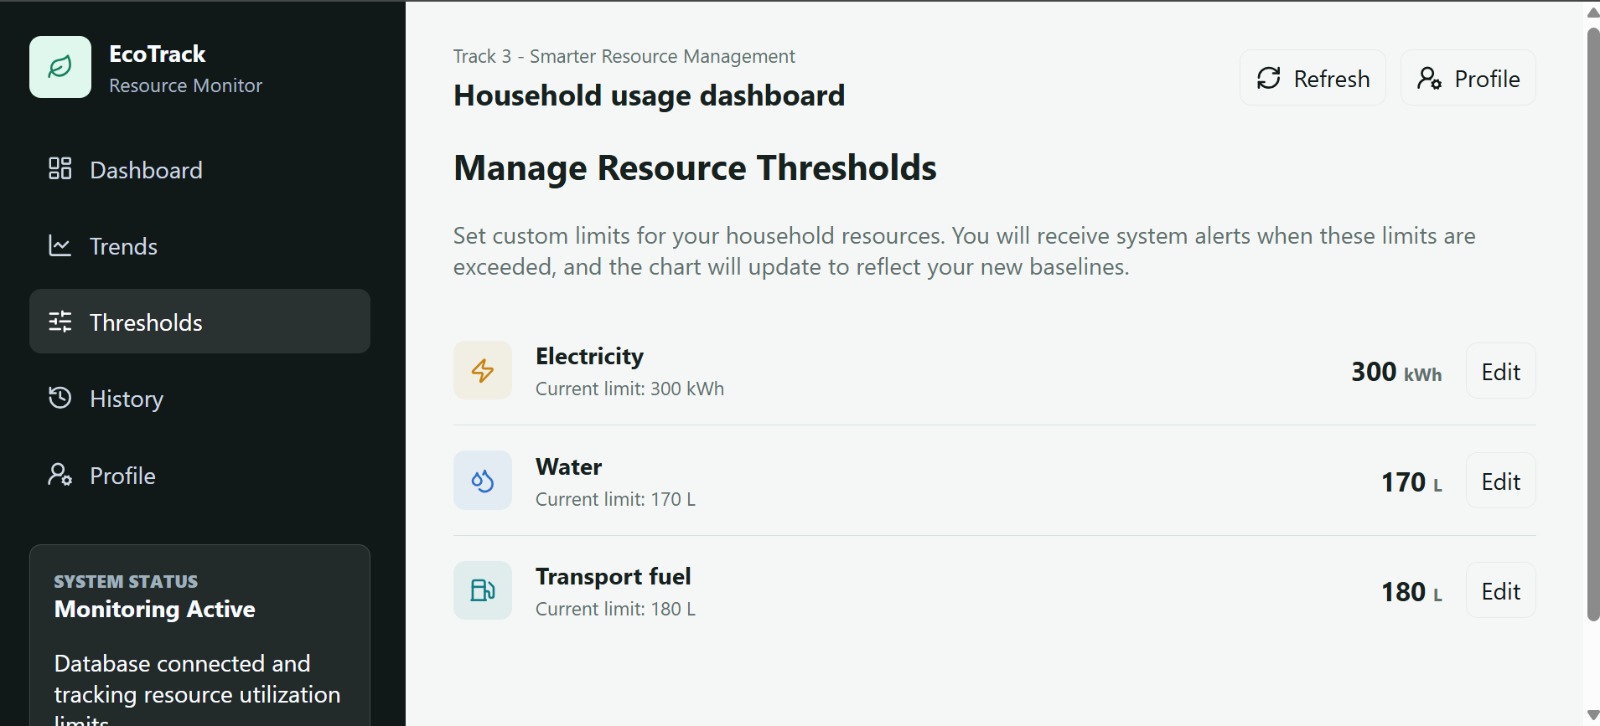
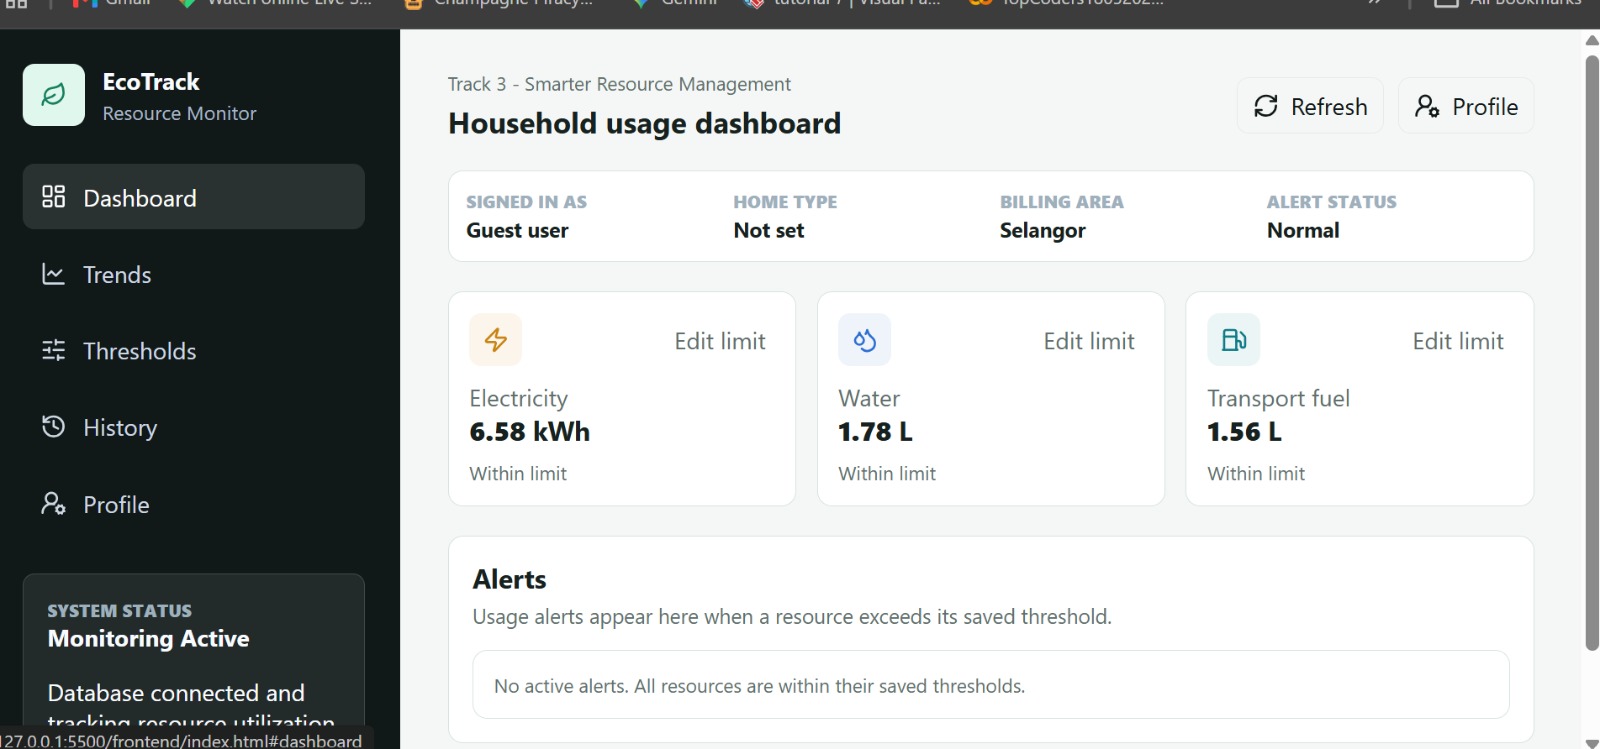
EcoTrack Resource Dashboard tracks three resources: electricity, water, and transport fuel and gives a clear picture of how each is trending. Users can set their own usage threshold for every resource, right from the dashboard or a dedicated settings page, and the system raises an alert the instant usage crosses that line. Every alert is logged, so nothing slips by unnoticed. A history view lets users look back at past usage on a daily, weekly, or monthly basis, making it easy to tell whether a spike was a one-off or the start of a pattern worth addressing.
How we built it
We kept the stack deliberately simple so we could move fast: a frontend built with plain HTML, CSS, and JavaScript, a Python backend handling the threshold logic and alert checks, and SQLite as the database for storing resource readings, thresholds, and the alert history. With no framework overhead on either side, we could iterate on features quickly and keep the whole system easy to reason about under hackathon time pressure.
Challenges we ran into
Like most hackathon teams, our biggest constraint was time, deciding early which features were essential and which would have to wait. Getting the frontend and backend talking cleanly, agreeing on how data should flow between them, and making sure the threshold and alert logic stayed consistent across the dashboard, the settings page, and the history view all took more back-and-forth than we expected. Balancing a clean, usable interface against the limited hours available meant constantly re-prioritizing what "done" looked like for a first version.
Accomplishments that we're proud of
We're proud of landing on a focused feature set that does a few things well rather than spreading ourselves thin, a dashboard, editable thresholds, working alerts, and a genuinely useful history view, all working together as one coherent tool by the end of the hackathon. Keeping the stack simple without sacrificing functionality felt like the right call, and seeing the alert system actually trigger correctly against real threshold values was a solid payoff for the effort.
What we learned
We came away with a much better sense of how to scope a project for a hackathon timeline, what's genuinely core to the idea versus what can be cut or simplified without losing the point of the project. We also sharpened our skills in connecting a lightweight frontend to a Python backend and structuring an SQLite database to support real-time-feeling features like threshold checks and historical views, all while working under a deadline.
What's next for EcoTrack Resource Dashboard
Looking ahead, we'd like to expand beyond electricity, water, and transport fuel to cover more resource types relevant to different kinds of operations. We're also interested in adding more granular alert settings (like severity tiers or notification preferences), exporting usage history for reporting, and eventually exploring predictive insights flagging a resource that's trending toward its threshold before it actually gets there, rather than only reacting once it's crossed.

Log in or sign up for Devpost to join the conversation.