Inspiration As high school students in the Kitchener-Waterloo-Cambridge region, we wanted to understand how our daily choices impact the environment. We realized that most people don't know how much CO2 their activities produce, so we built a tool to make carbon tracking simple and visual.
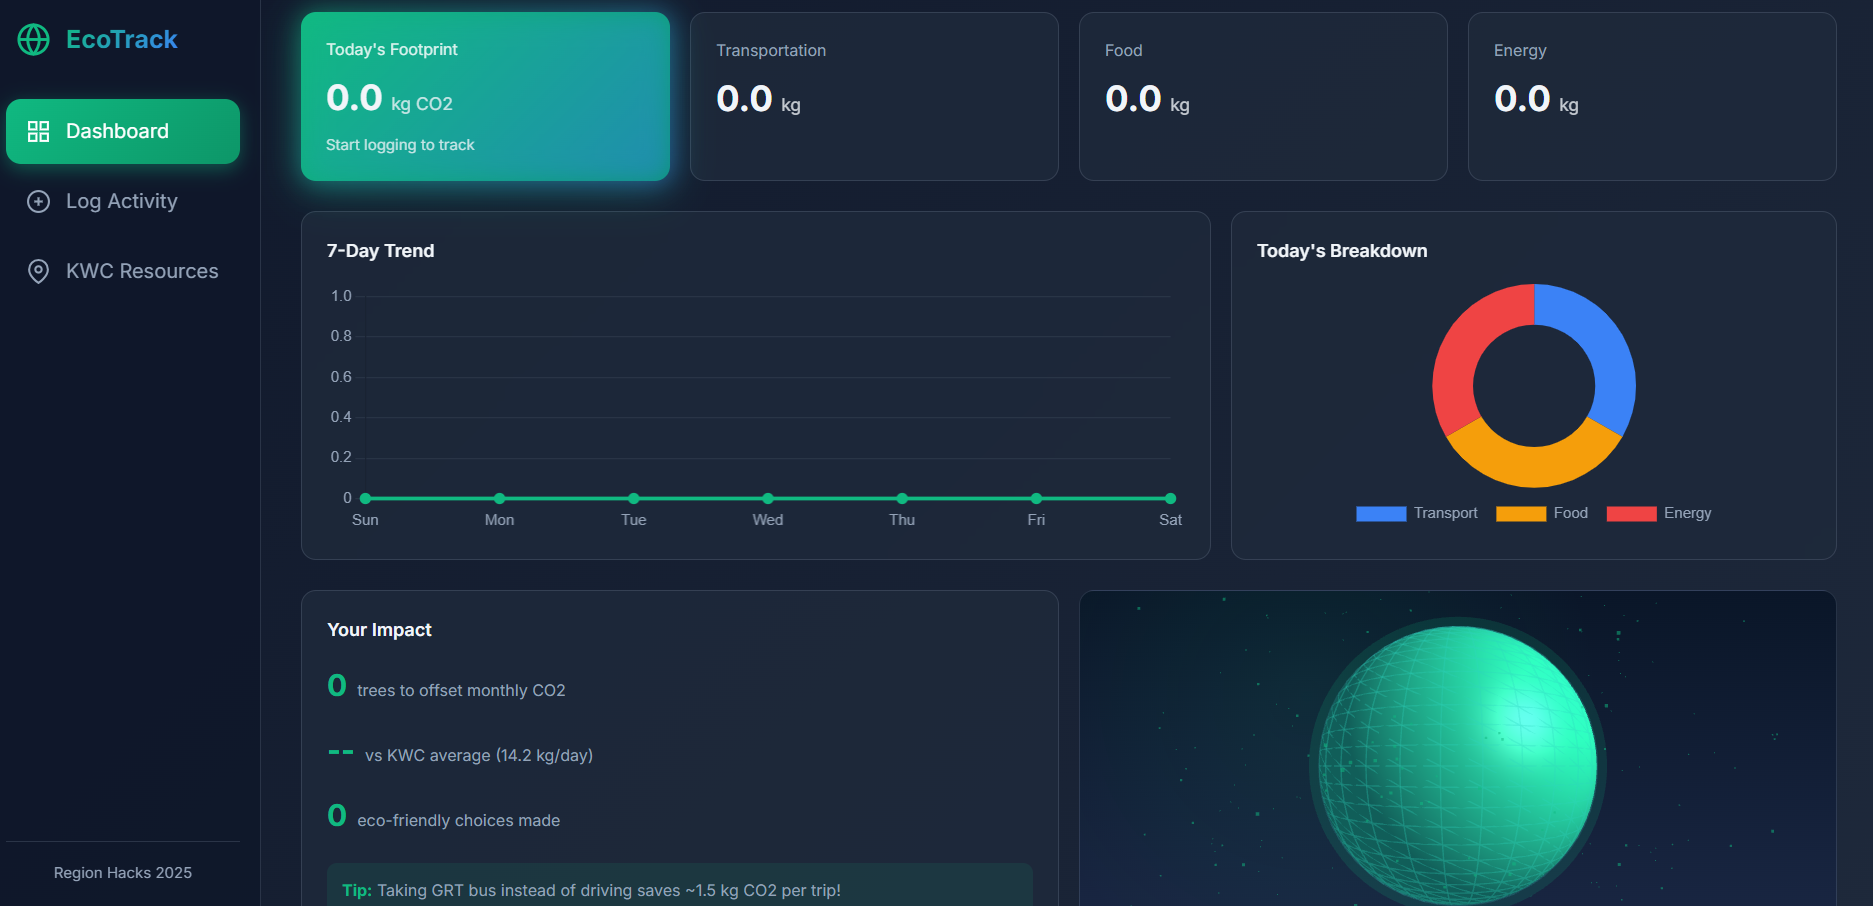
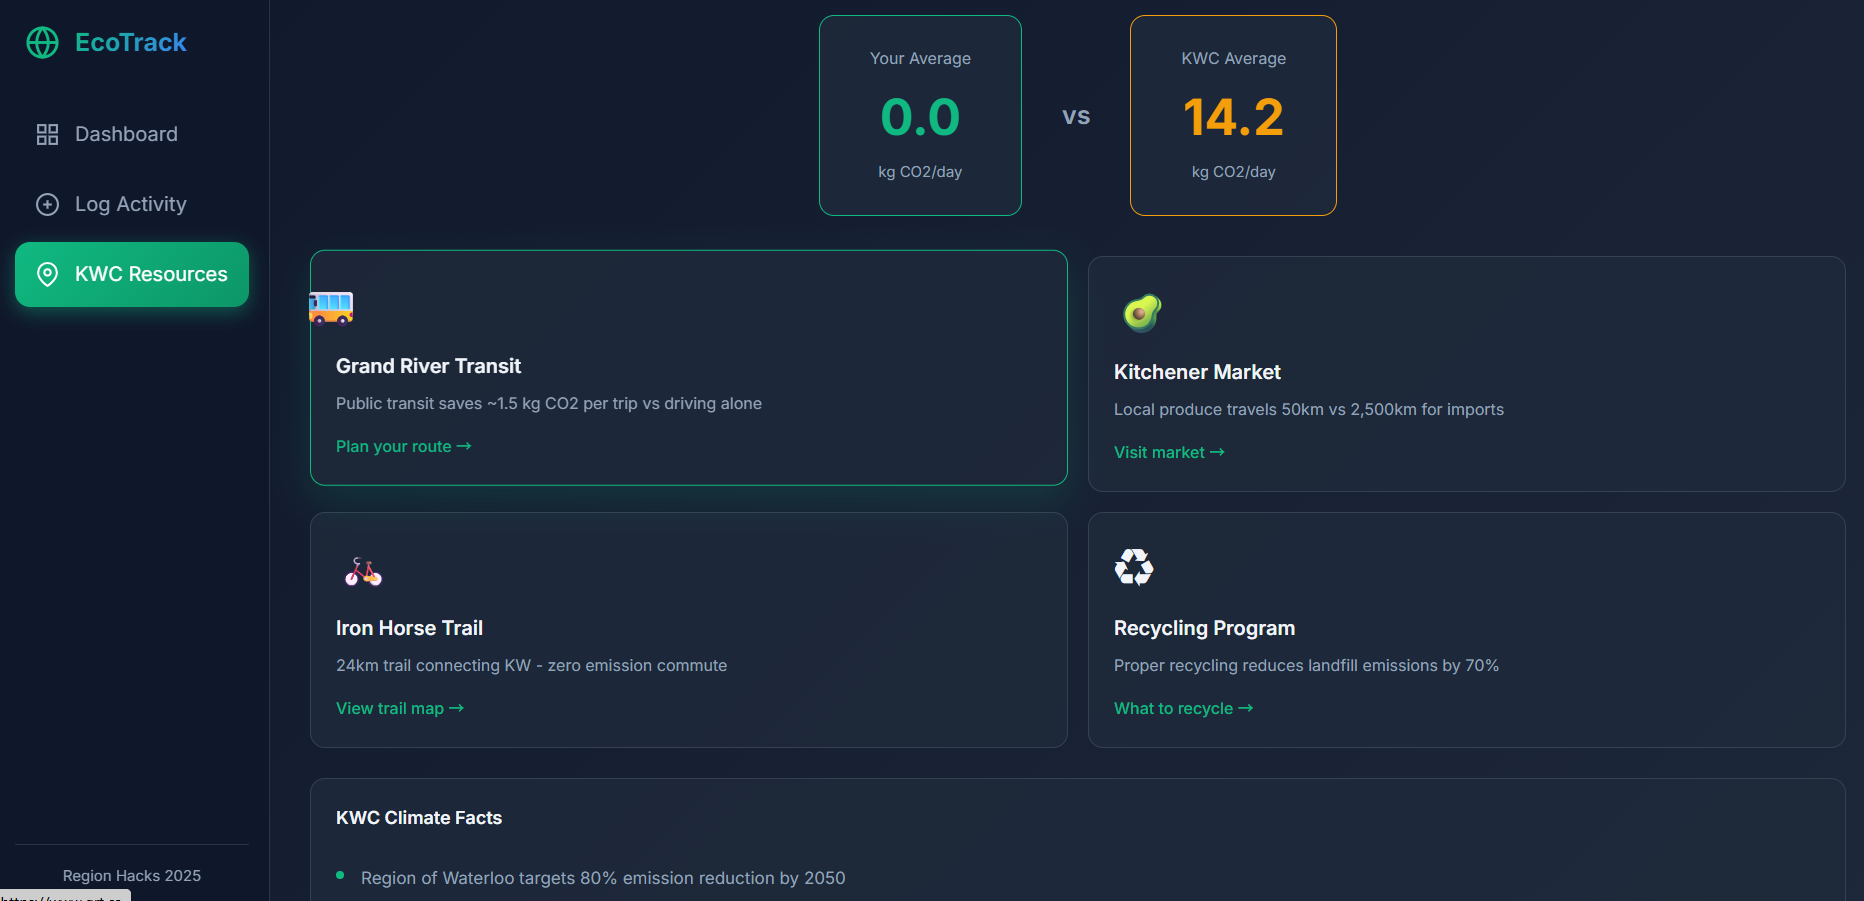
What it does EcoTrack helps users track their daily carbon footprint across three categories: transportation, food, and energy. The app features an interactive 3D Earth that changes color based on your emissions - green when you're doing well, red when emissions are high. It also provides local KWC resources like GRT transit info and Kitchener Market to help users make eco-friendly choices.
How we built it We built EcoTrack using HTML, CSS, and JavaScript. We used Chart.js for data visualization and Three.js for the 3D Earth globe. All data is stored locally in the browser using localStorage, making it fast and private.
Challenges we ran into Getting the 3D Earth to render properly and change colors smoothly based on user data was tricky. We also had to balance having enough features to be useful while keeping the interface simple enough for anyone to use.
Accomplishments that we're proud of The interactive 3D Earth that responds to user behavior is our favorite feature. We're also proud of making the app specific to KWC with local resources and regional carbon comparisons.
What we learned We learned about carbon emission calculations, Three.js 3D graphics, and how to create responsive data visualizations. We also learned the importance of focusing on core features rather than trying to do everything.
What's next for EcoTrack We want to add user accounts so people can track their progress over time, a community leaderboard with real data, and push notifications to remind users to log their activities.

Log in or sign up for Devpost to join the conversation.