EcoTrack - Personal Carbon Footprint Dashboard
🌱 What Inspired This Project
Climate change is one of the most pressing challenges of our time, yet many people struggle to understand their personal environmental impact. I was inspired by the growing awareness of environmental responsibility among individuals, especially in developing countries like Bangladesh, where climate effects are felt most acutely.
The inspiration came from a simple observation: people want to be environmentally conscious, but they lack accessible tools to measure and track their daily carbon footprint. While there are complex enterprise solutions and basic carbon calculators, there's a gap for intuitive, engaging personal tracking tools that make environmental consciousness feel achievable rather than overwhelming.
🎯 What Problem Does EcoTrack Solve
EcoTrack addresses several critical issues:
- Lack of Awareness: Most people have no idea how much CO2 their daily activities generate
- No Actionable Insights: Existing tools provide numbers without context or goals
- Poor User Experience: Environmental apps are often complex, boring, or guilt-inducing
- No Progress Tracking: People can't see their improvement over time
- Missing Gamification: Environmental responsibility needs to be engaging, not burdensome
🛠️ How I Built EcoTrack
Technology Stack
- Frontend: Vanilla HTML, CSS, and JavaScript for maximum compatibility
- Charts: Chart.js for interactive data visualization
- Design: Custom CSS with modern gradients, animations, and responsive design
- Icons: Emoji and custom styling for accessibility
Architecture Decisions
I chose a single-file HTML application for several strategic reasons:
- Zero Deployment Complexity: Works instantly on any device
- Hackathon-Friendly: Easy to demo without server setup
- Accessibility: No internet required after initial load
- Cross-Platform: Runs on any modern browser
Core Features Implemented
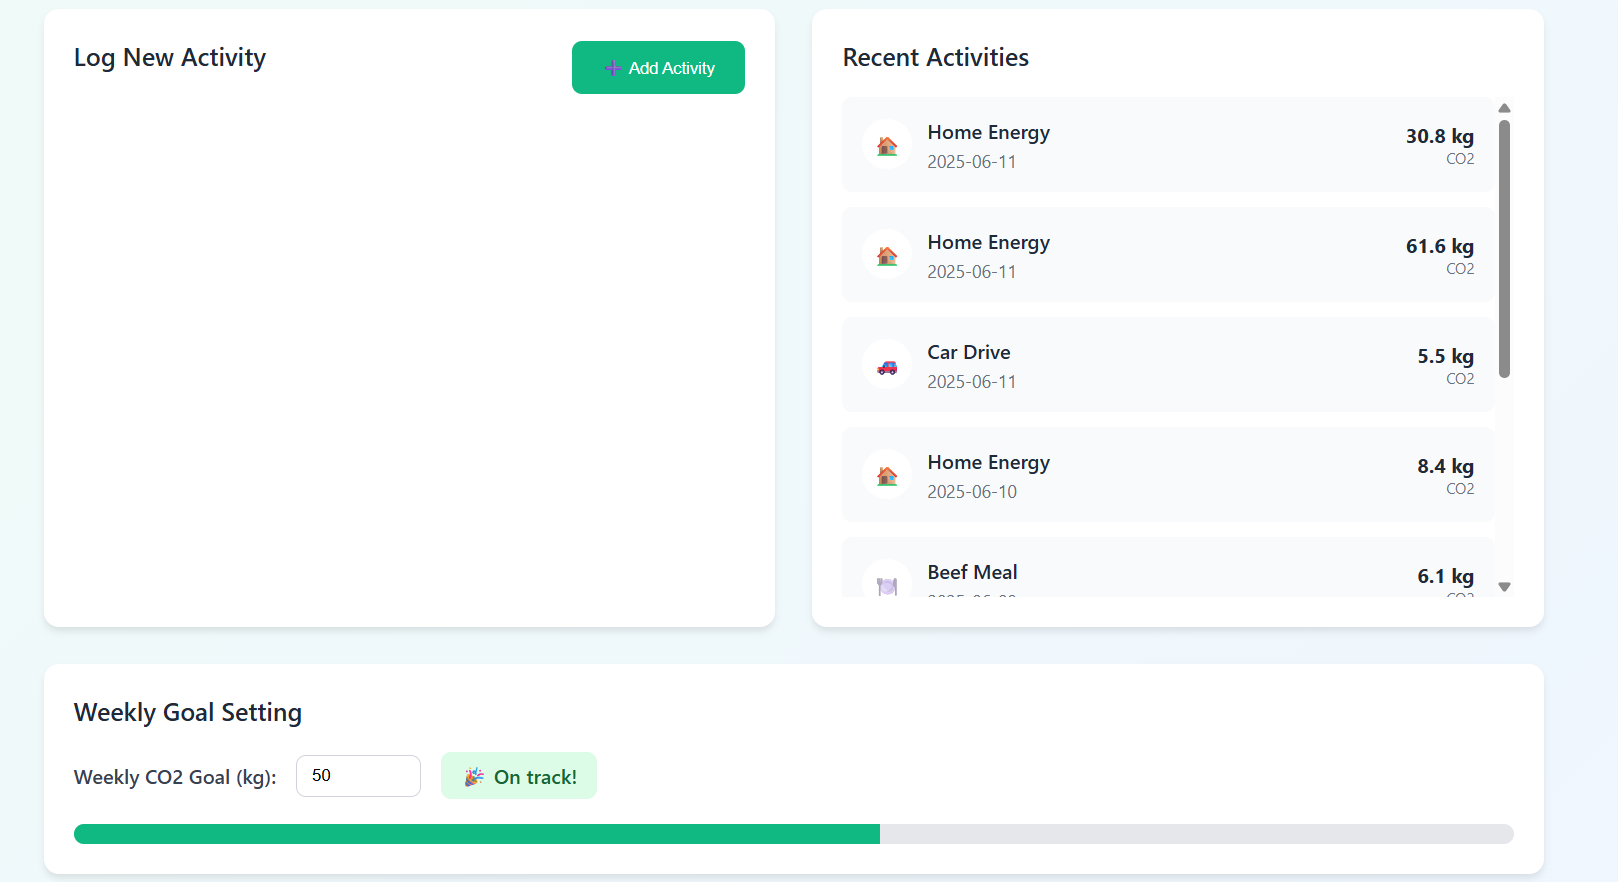
1. Smart Activity Tracking
const emissionFactors = {
    transport: { 'Car Drive': 0.22, 'Public Transit': 0.08 },
    energy: { 'Home Energy': 0.7, 'Solar Power': 0.05 },
    food: { 'Beef Meal': 6.1, 'Vegetarian Meal': 0.4 }
};
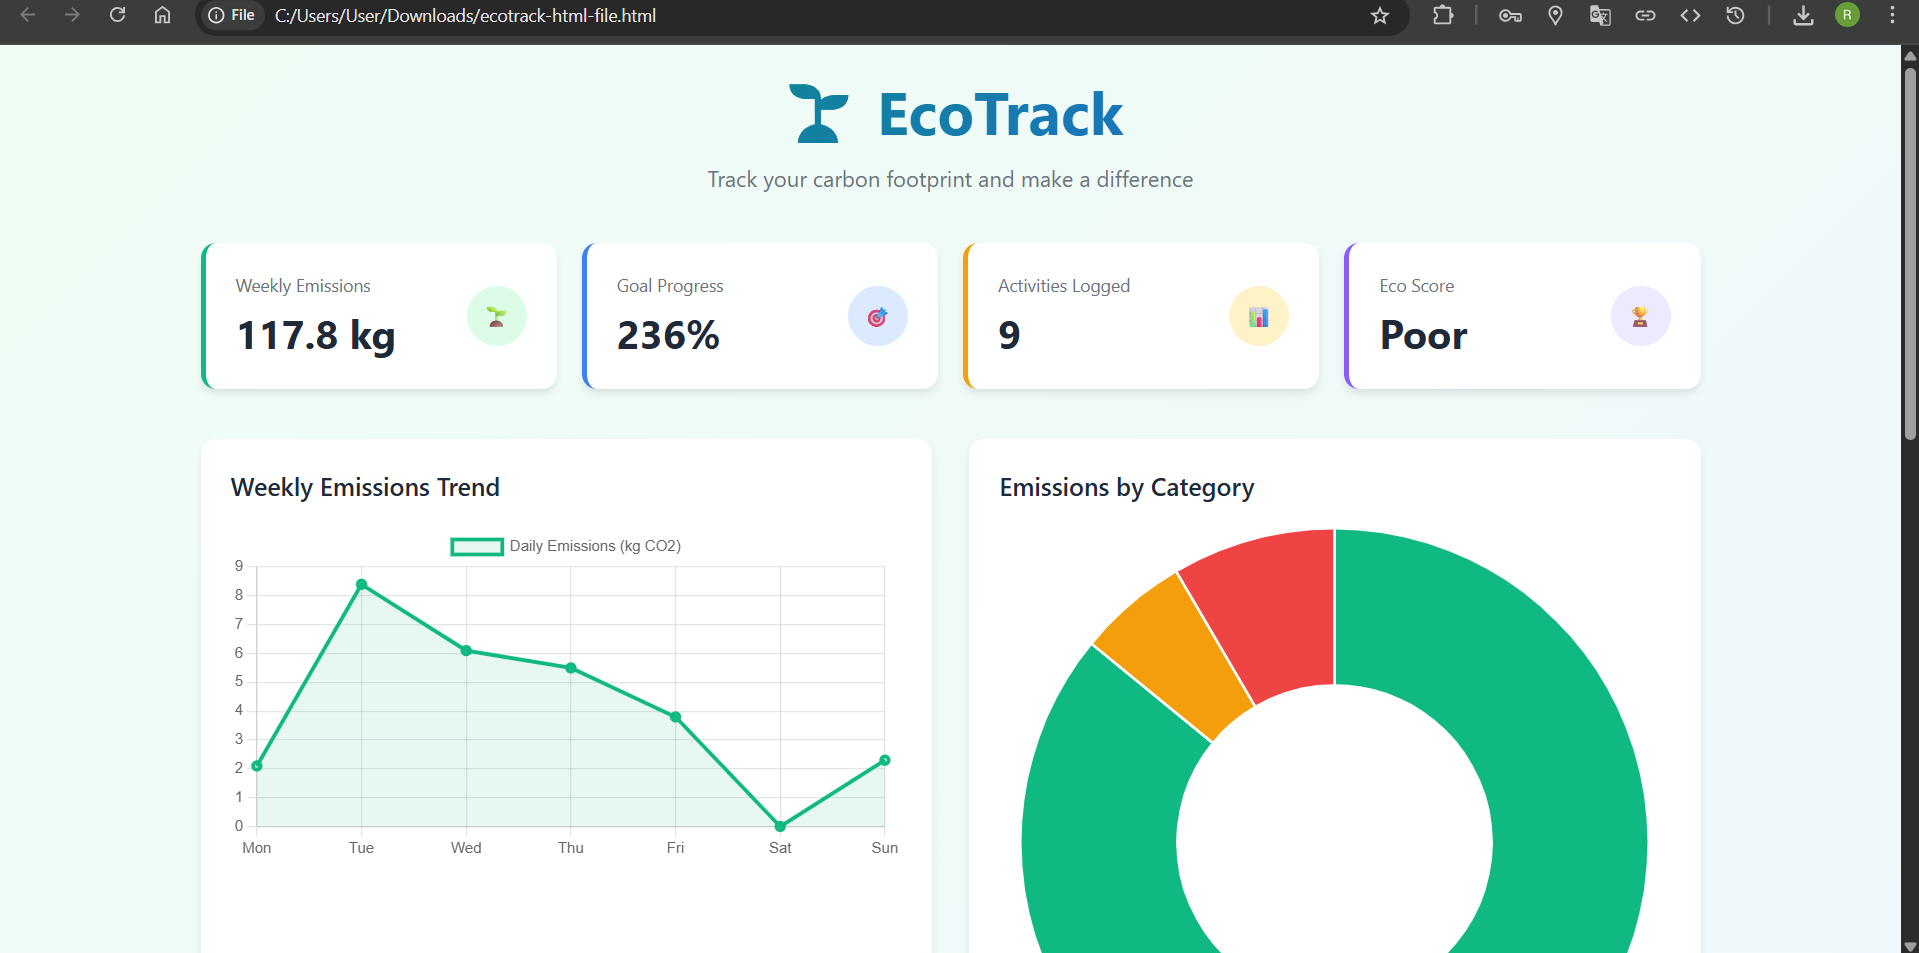
2. Real-Time Data Visualization
- Weekly emission trends using line charts
- Category breakdown with doughnut charts
- Dynamic updates without page refresh
3. Goal-Based Gamification
- Personal weekly CO2 targets
- Progress tracking with visual feedback
- Achievement system with color-coded status
4. Responsive Design
- Mobile-first approach
- CSS Grid for flexible layouts
- Touch-friendly interfaces
🚧 Challenges I Faced
1. Accurate Emission Calculations
Challenge: Finding reliable carbon emission factors for different activities. Solution: Researched EPA, IPCC, and academic sources to create a comprehensive factor database. Implemented region-specific calculations where possible.
2. Data Visualization Performance
Challenge: Charts were slow to update with large datasets. Solution: Implemented data aggregation and limited recent activities display to maintain smooth performance.
3. User Experience Balance
Challenge: Making environmental tracking feel positive rather than guilt-inducing. Solution:
- Used encouraging language ("On track!" vs "You're polluting!")
- Gamified progress with achievement badges
- Focused on improvement rather than absolute numbers
4. Cross-Browser Compatibility
Challenge: Ensuring consistent behavior across different browsers and devices. Solution: Used vanilla JavaScript with fallbacks, tested on multiple browsers, and implemented progressive enhancement.
5. Memory Management
Challenge: Preventing memory leaks in long-running single-page applications. Solution: Implemented proper event listener cleanup and optimized chart update cycles.
📚 What I Learned
Technical Skills
- Advanced CSS: Mastered modern layout techniques (Grid, Flexbox) and animation
- Chart.js Mastery: Deep dive into data visualization best practices
- Performance Optimization: Learned to balance features with performance
- Responsive Design: Mobile-first development strategies
Domain Knowledge
- Environmental Science: Understanding carbon footprint calculations and factors
- UX for Social Good: How to make environmental apps engaging rather than preachy
- Data Presentation: Effective ways to communicate environmental data to users
Product Development
- MVP Thinking: Prioritizing core features for maximum impact
- User-Centered Design: Balancing functionality with simplicity
- Hackathon Strategy: Building impressive demos within time constraints
🏆 What Makes EcoTrack Special
1. Immediate Value
Users see instant feedback on their activities, making environmental impact tangible and actionable.
2. Behavioral Psychology
The app uses positive reinforcement and goal-setting to encourage sustainable behaviors without being preachy.
3. Accessibility First
Works on any device, requires no installation, and is designed for users with varying technical literacy.
4. Scalable Foundation
Built with expansion in mind - can easily integrate IoT devices, social features, or corporate dashboards.
🚀 Future Roadmap
Phase 1: Enhanced Tracking
- GPS integration for automatic transport logging
- Smart home device integration
- Receipt scanning for food carbon calculation
Phase 2: Social Features
- Family/team challenges
- Community leaderboards
- Carbon offset marketplace integration
Phase 3: AI Insights
- Personalized reduction recommendations
- Predictive modeling for emission trends
- Smart goal adjustment based on behavior patterns
Phase 4: Enterprise Integration
- Corporate sustainability dashboards
- ESG reporting tools
- API for third-party integrations
💡 Key Insights for Environmental Tech
- Make it Personal: People care more about their own impact than global statistics
- Focus on Progress: Improvement matters more than perfection
- Keep it Simple: Complex environmental calculations should be invisible to users
- Positive Messaging: Encouragement works better than guilt
- Immediate Feedback: Real-time updates create habit formation
🌍 Impact Potential
EcoTrack has the potential to make environmental consciousness mainstream by:
- Democratizing Carbon Tracking: Making sophisticated environmental monitoring accessible to everyone
- Driving Behavior Change: Gamification and goal-setting proven to modify habits
- Creating Environmental Awareness: Educating users about the carbon impact of daily activities
- Supporting Climate Goals: Individual action aggregated can contribute to national and global climate targets
🏁 Conclusion
Building EcoTrack taught me that the most impactful environmental solutions aren't always the most technically complex ones. Sometimes, the key is making existing knowledge accessible, engaging, and actionable.
This project represents more than just a carbon tracker - it's a bridge between environmental science and everyday behavior, designed to make sustainability feel achievable rather than overwhelming. In a world facing climate challenges, tools like EcoTrack can empower individuals to be part of the solution.
The future of environmental technology isn't just about measuring impact - it's about inspiring action.

Log in or sign up for Devpost to join the conversation.