Inspiration
We wanted to create a simple and interactive way for people to understand and reduce their carbon footprint. Most tools are too complex or outdated, so we built something modern and user-friendly.
What it does
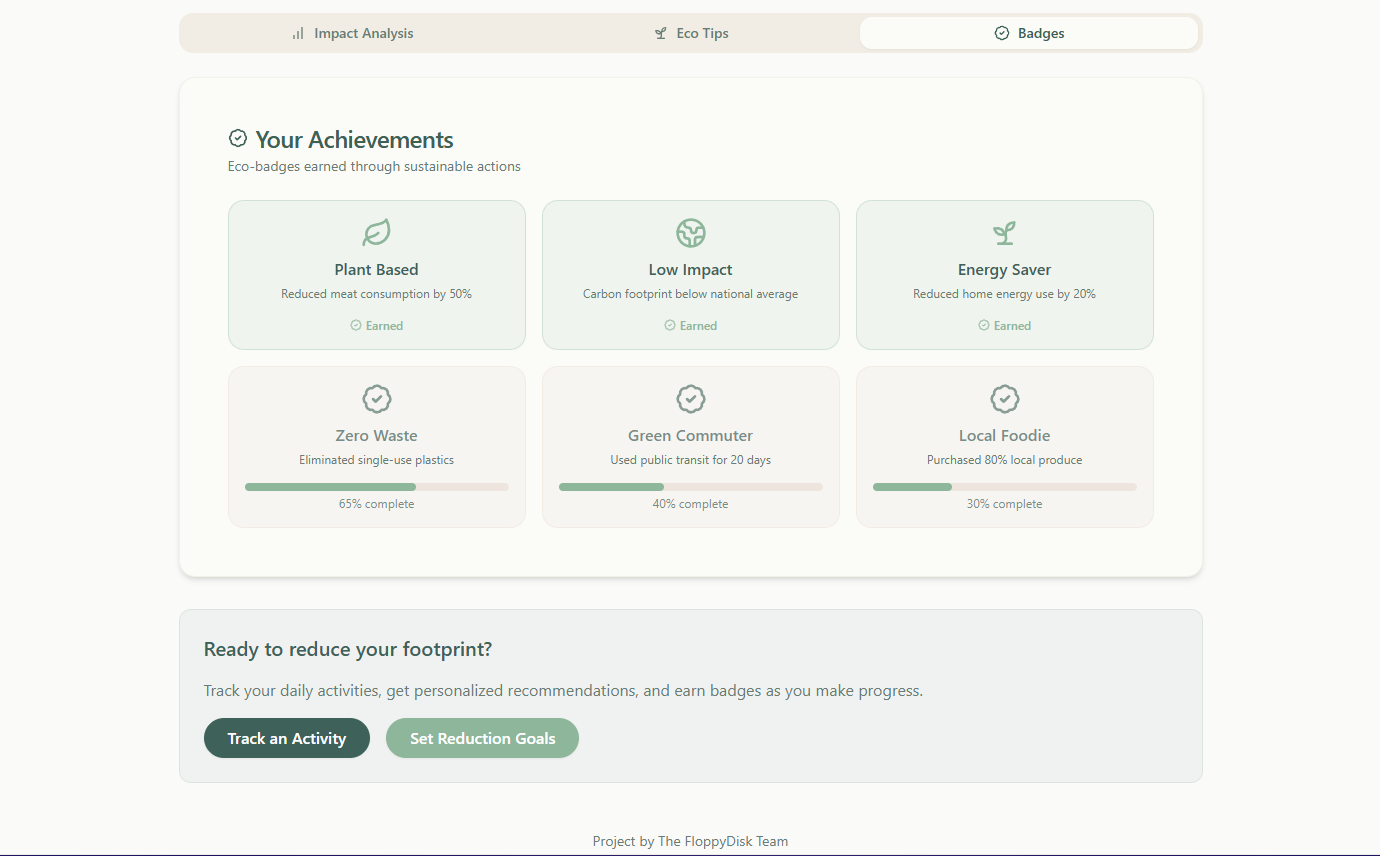
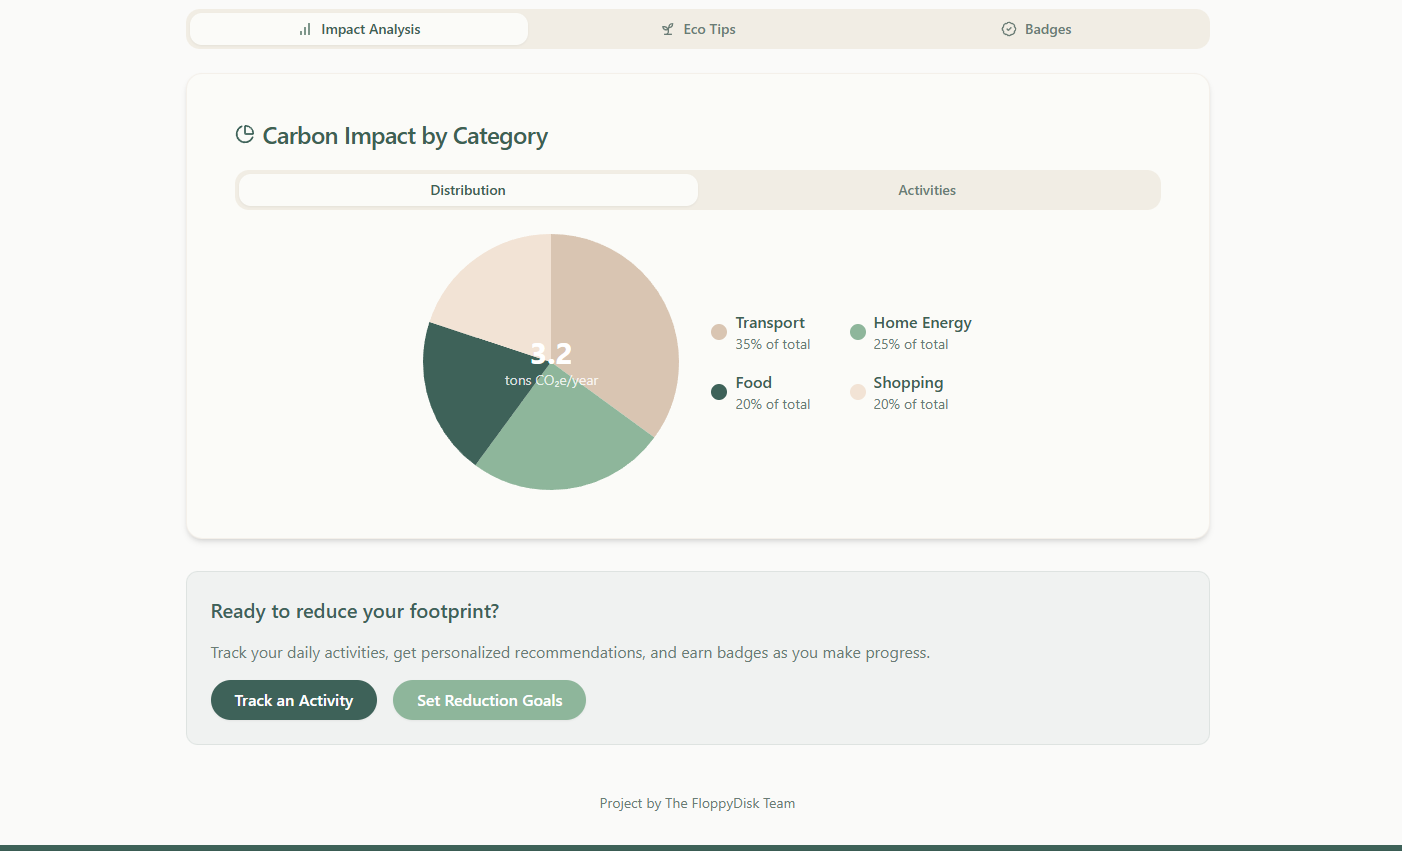
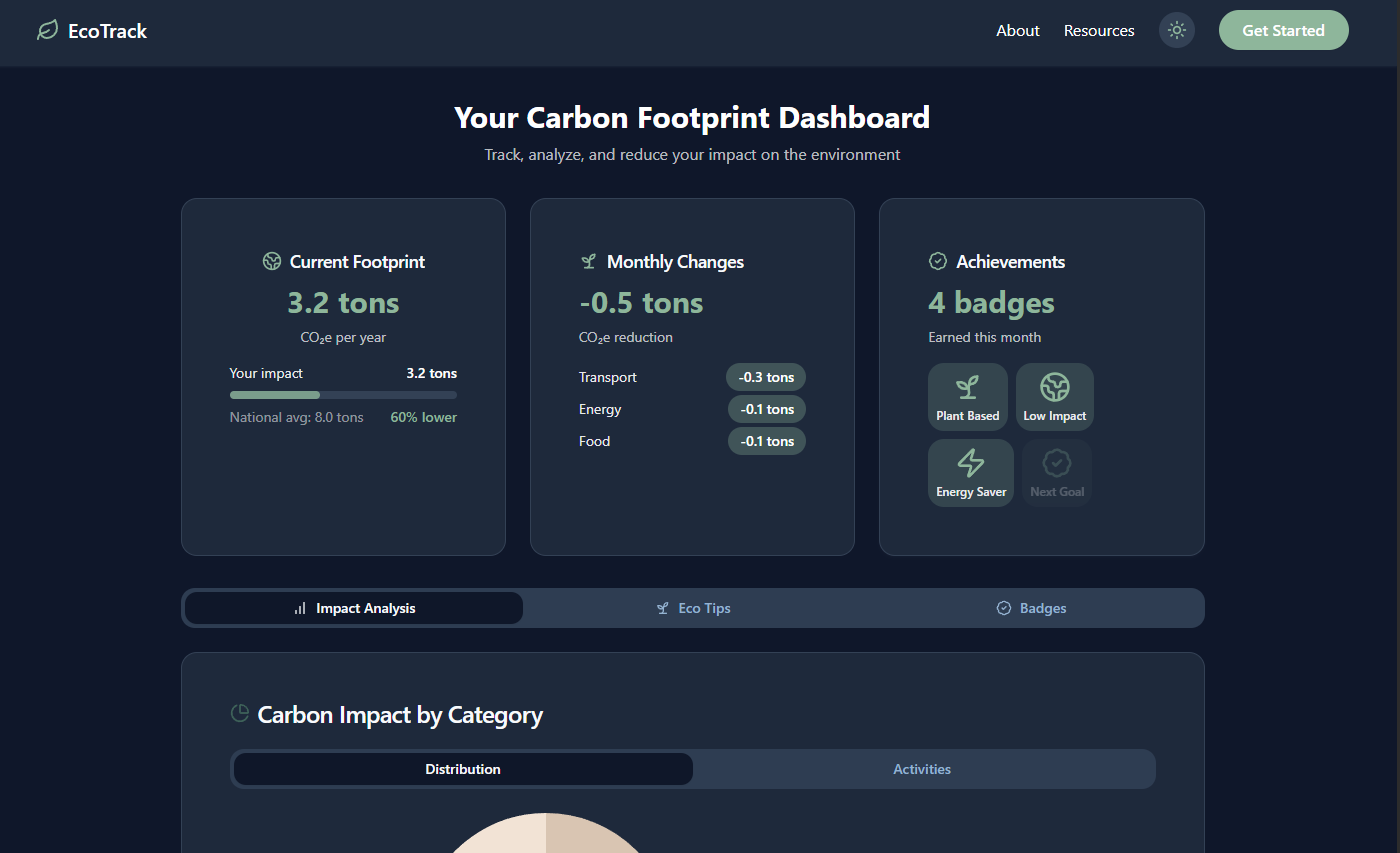
EcoTrack tracks a user's annual carbon footprint, shows monthly CO2e reduction across categories like transport, energy, and food, and rewards them with badges for eco-friendly actions.
How we built it
The frontend was built using React and Tailwind CSS. The backend uses Node.js for handling data. We designed the UI in Figma and used mock data for simulation.
Challenges we ran into
Making the dashboard clean but informative Balancing design and performance Keeping category data meaningful with limited time
Accomplishments that we're proud of
Functional and clean dashboard Interactive badge system Solid frontend-backend integration
What we learned
Better UI planning with Figma Handling data flow in React apps Efficient component structuring
What's next for Ecotrack
Add real-time data support User login and history tracking More badge categories and social sharing

Log in or sign up for Devpost to join the conversation.