-
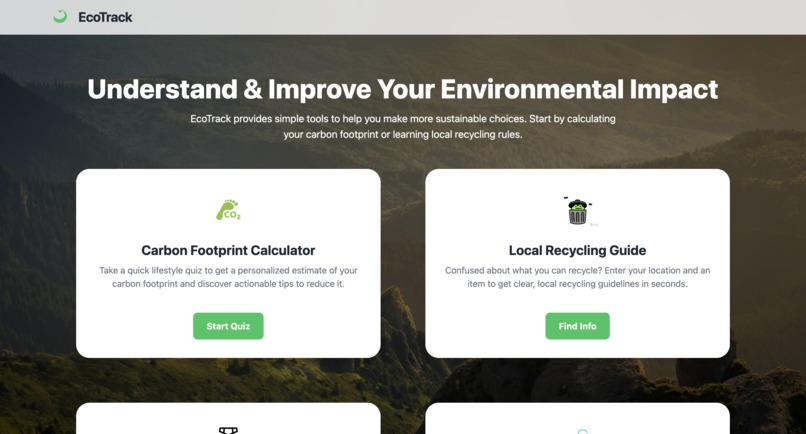
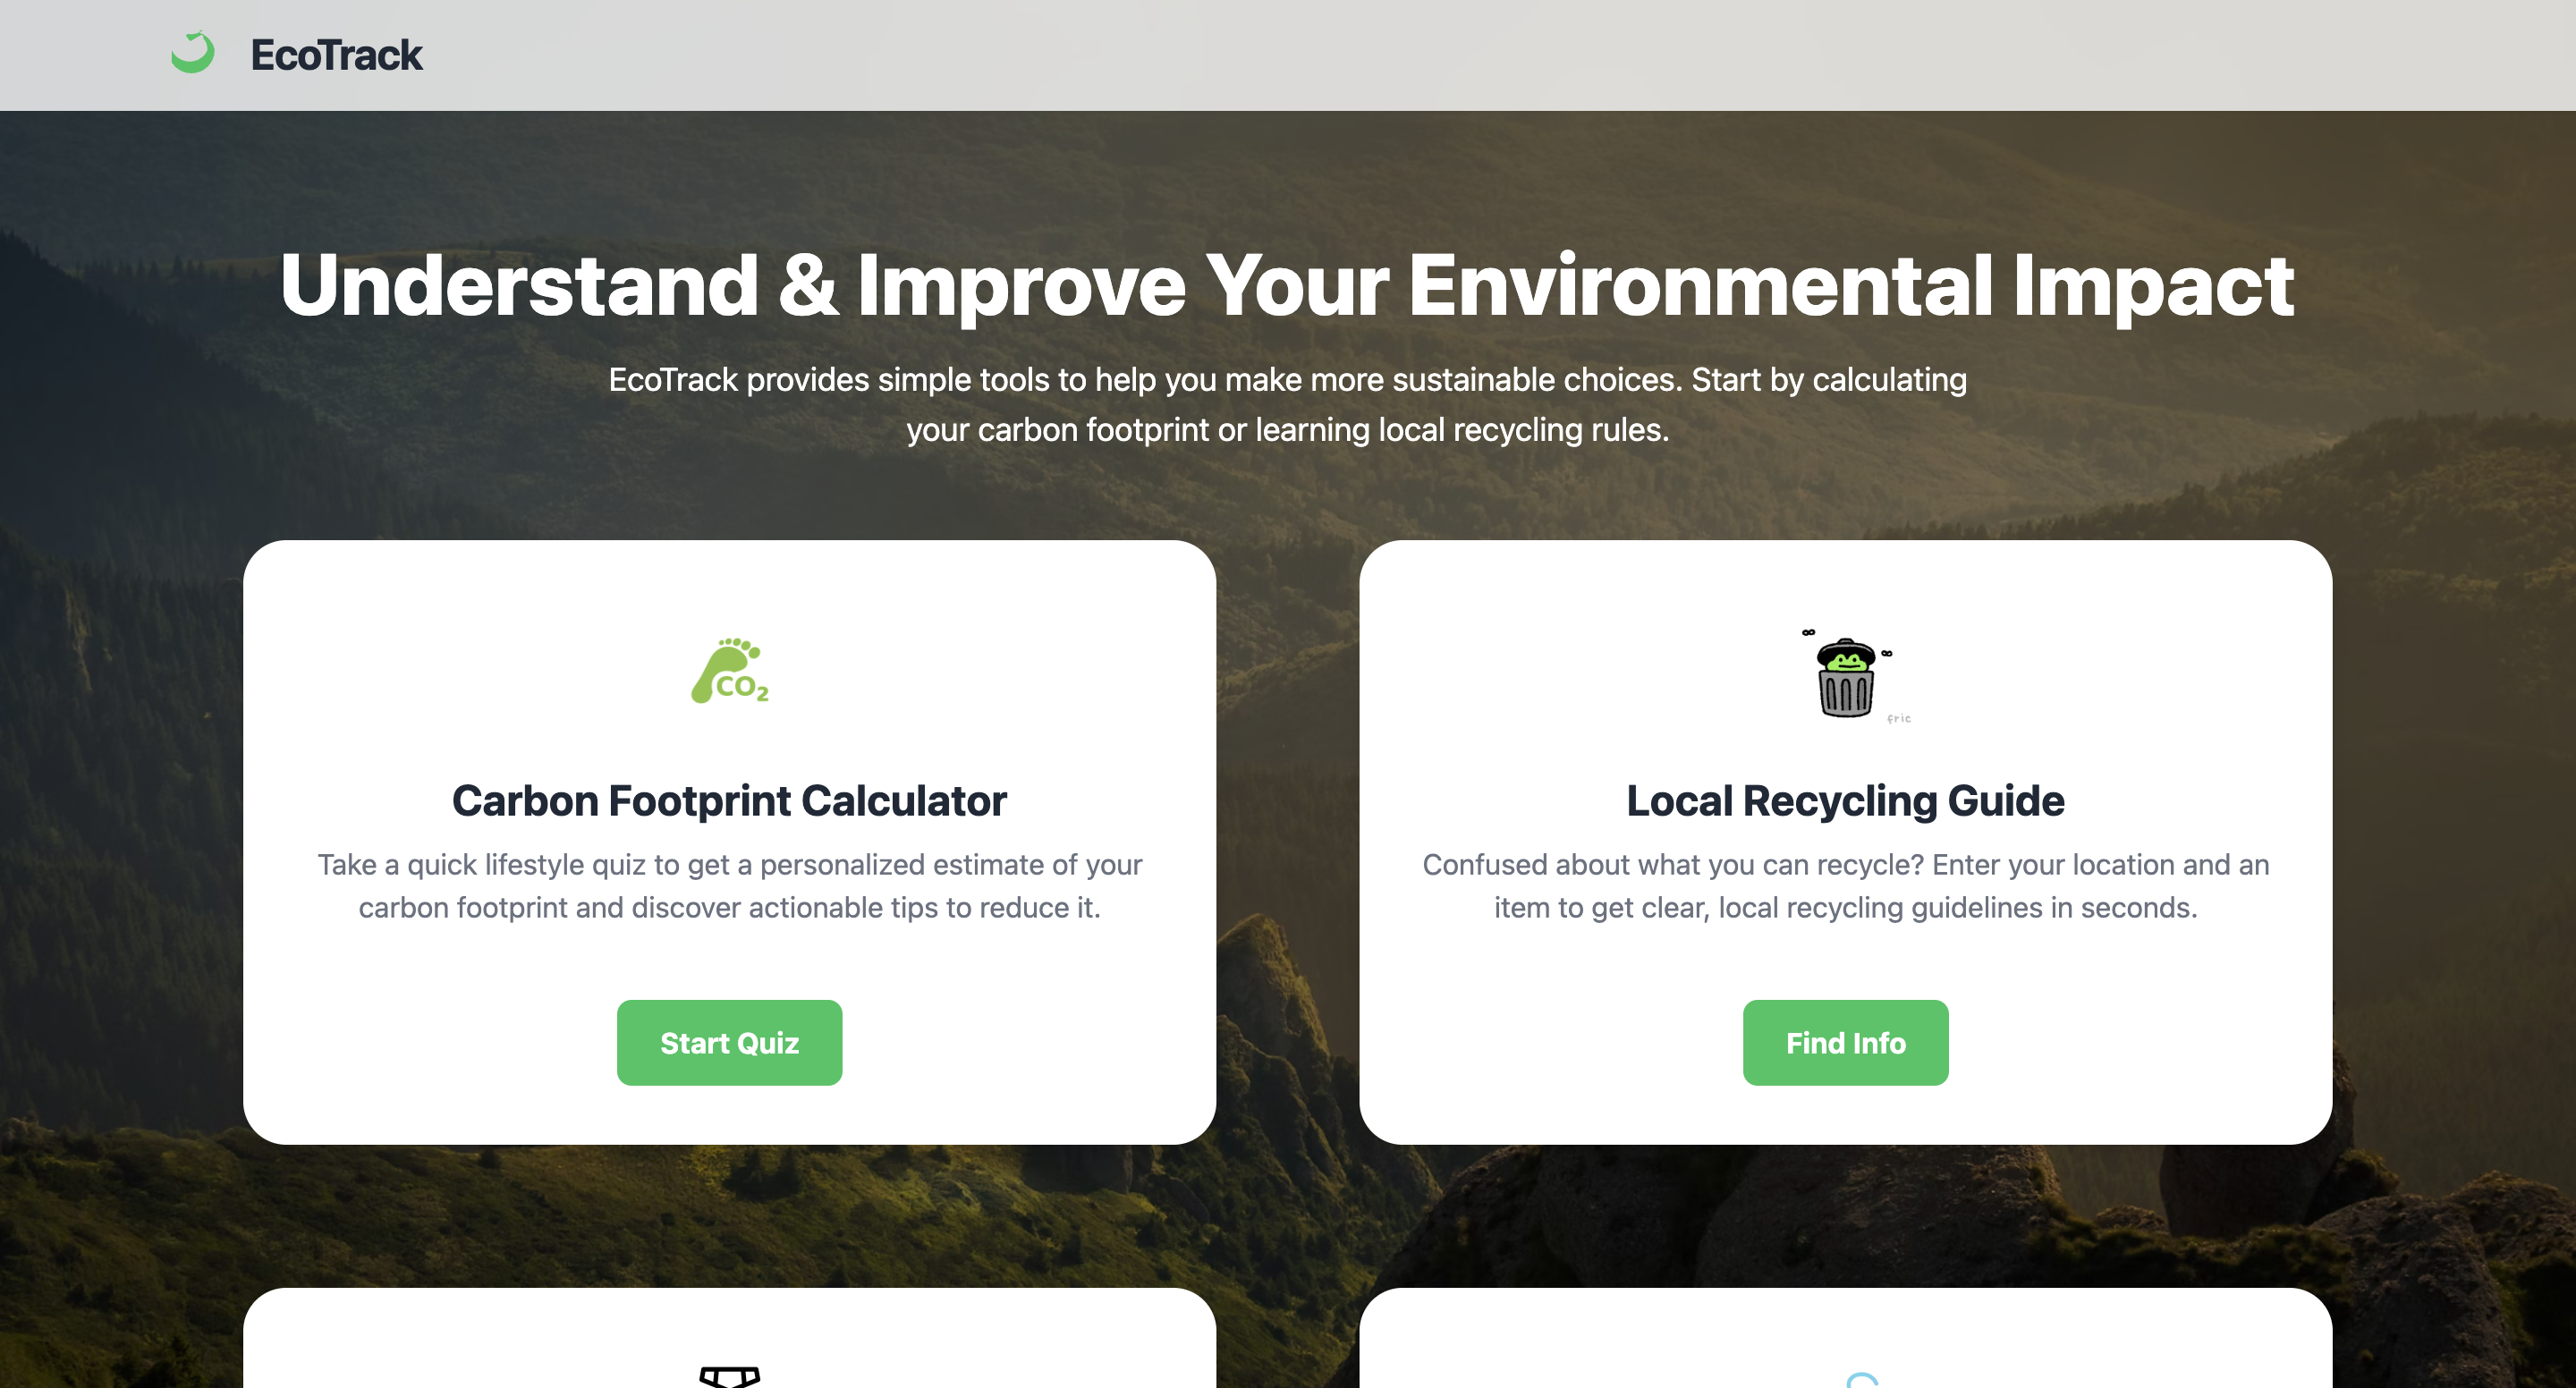
Front page
-
-

-

Resource Locater
-
Resource Locater

EcoTrack
Inspiration
EcoTrack was inspired by the need for accessible tools that help individuals understand their environmental impact. We wanted a simple, interactive platform that encourages sustainable choices without overwhelming users with data.
What it does
EcoTrack allows users to:
- Calculate their carbon footprint through a lifestyle quiz.
The carbon footprint is estimated using the formula:
$$\text{CF} = \sum_i E_i \times F_i$$
Where:
- (E_i) = energy consumption of activity (i)
(F_i) = emission factor of activity (i)
- Access local recycling guidelines based on location and item.
- Track eco-friendly actions and see their positive impact over time.
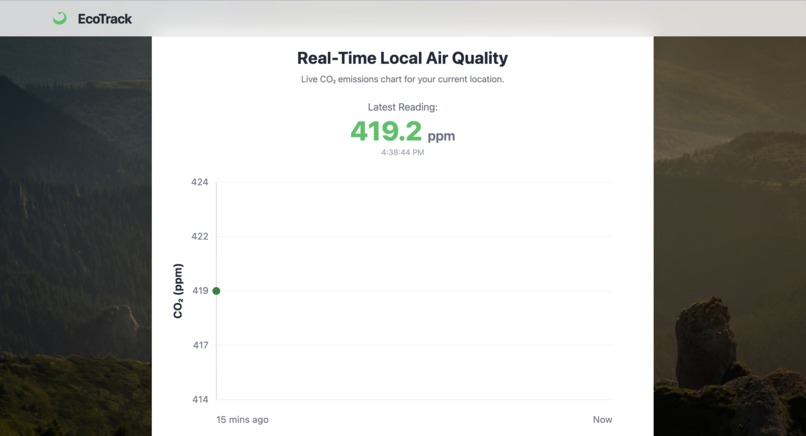
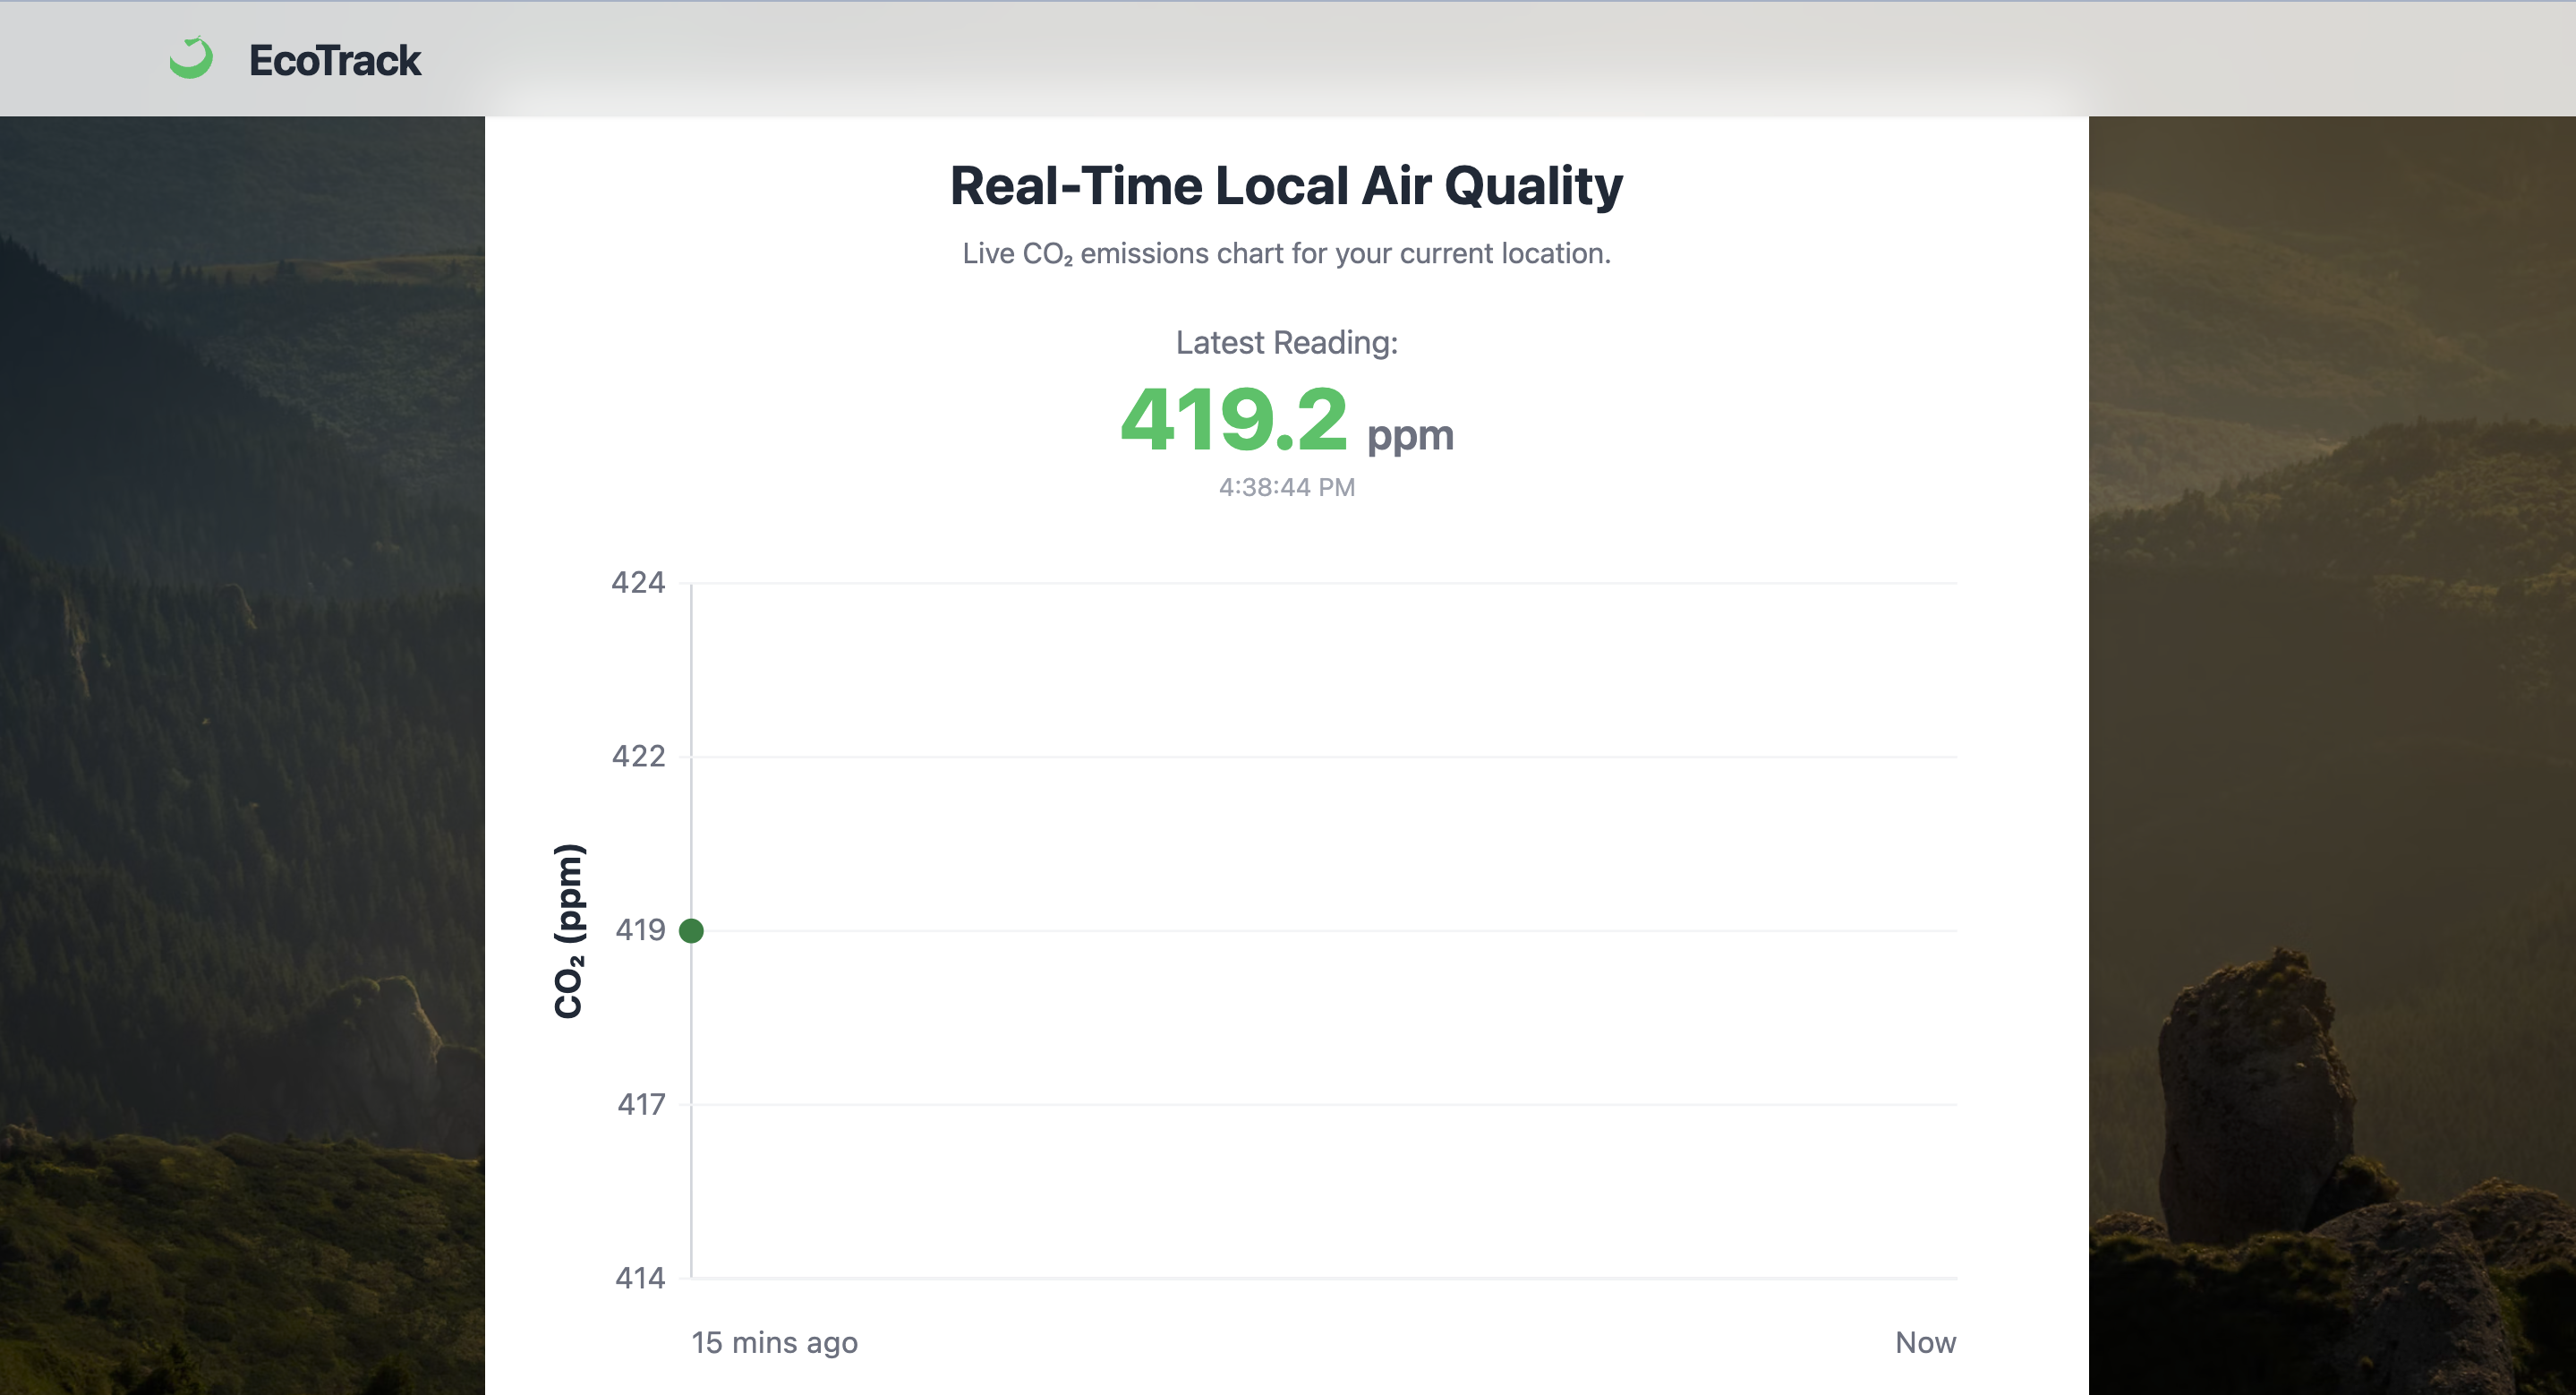
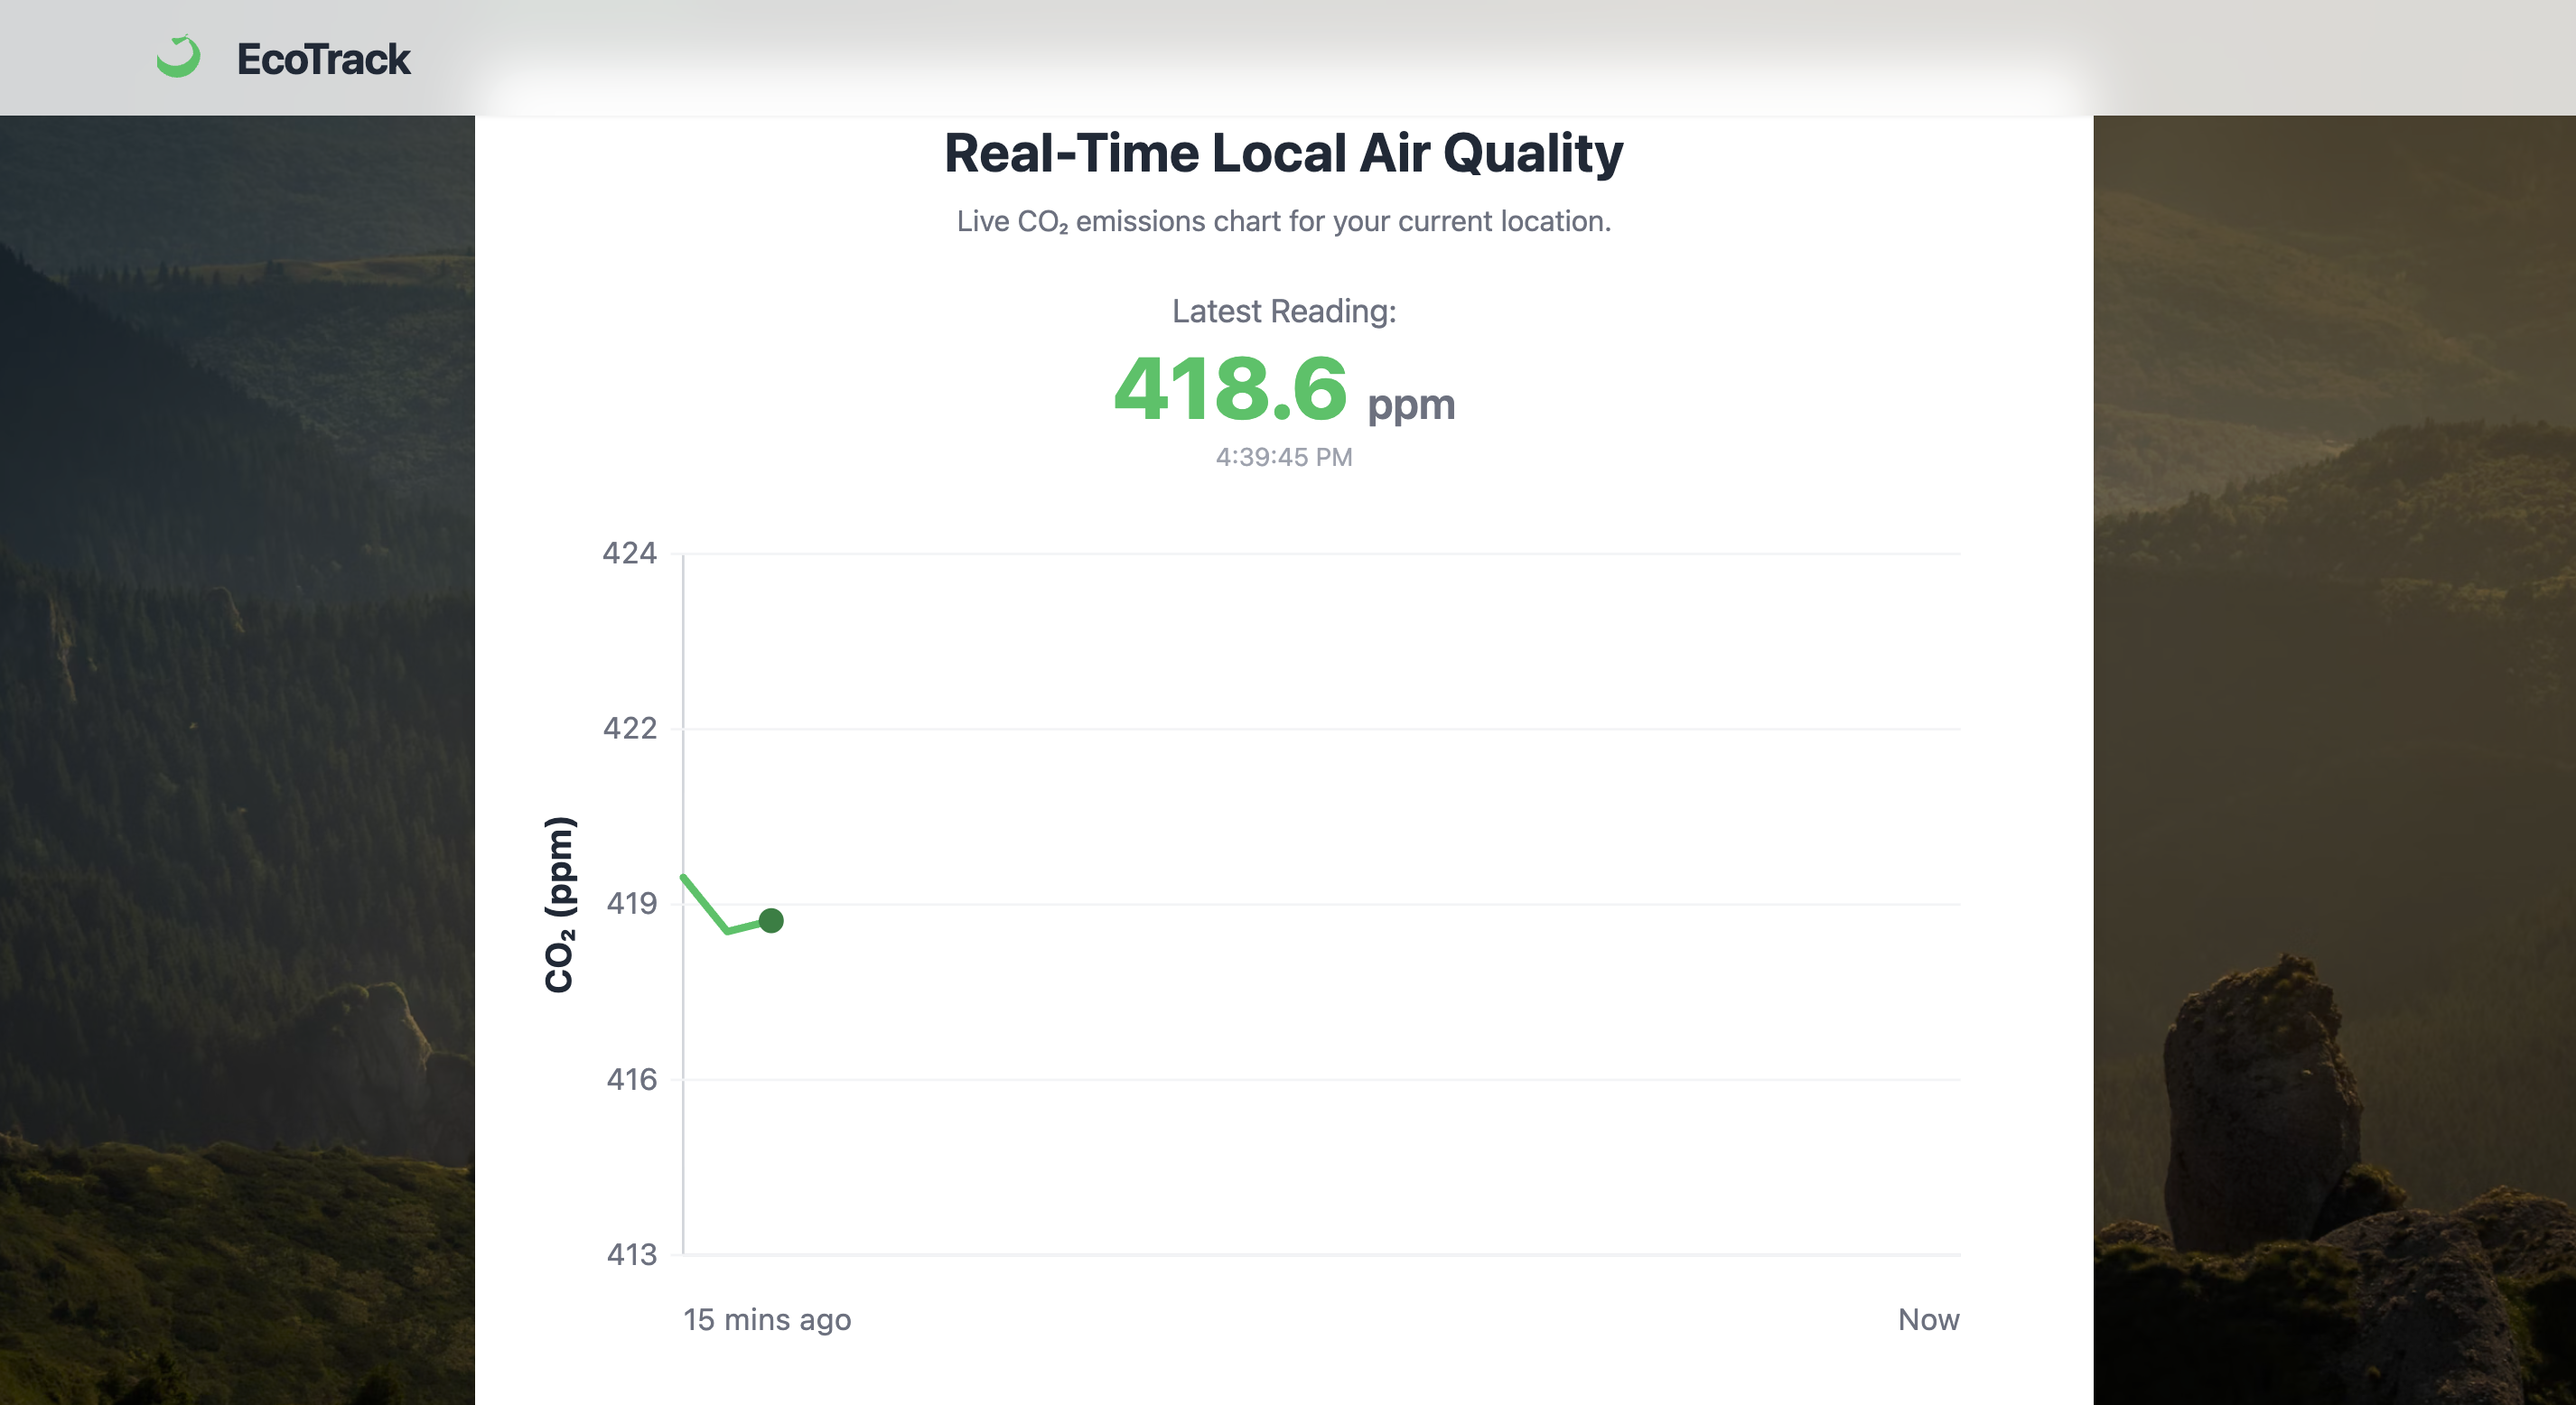
Users earn points for actions, - Monitor live air quality data to make informed choices about the environment.
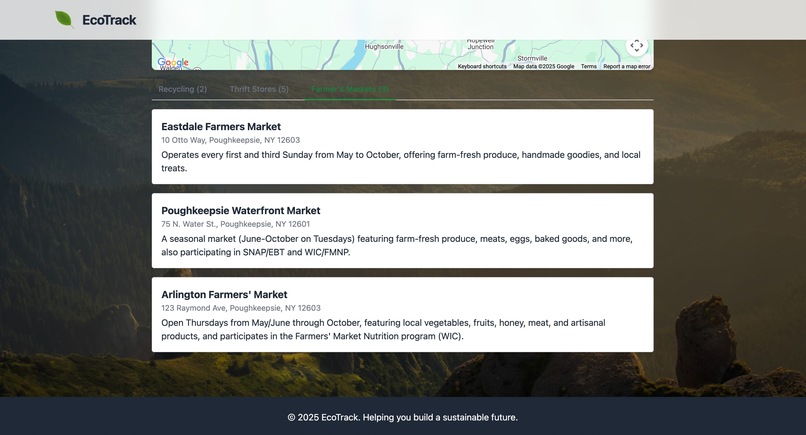
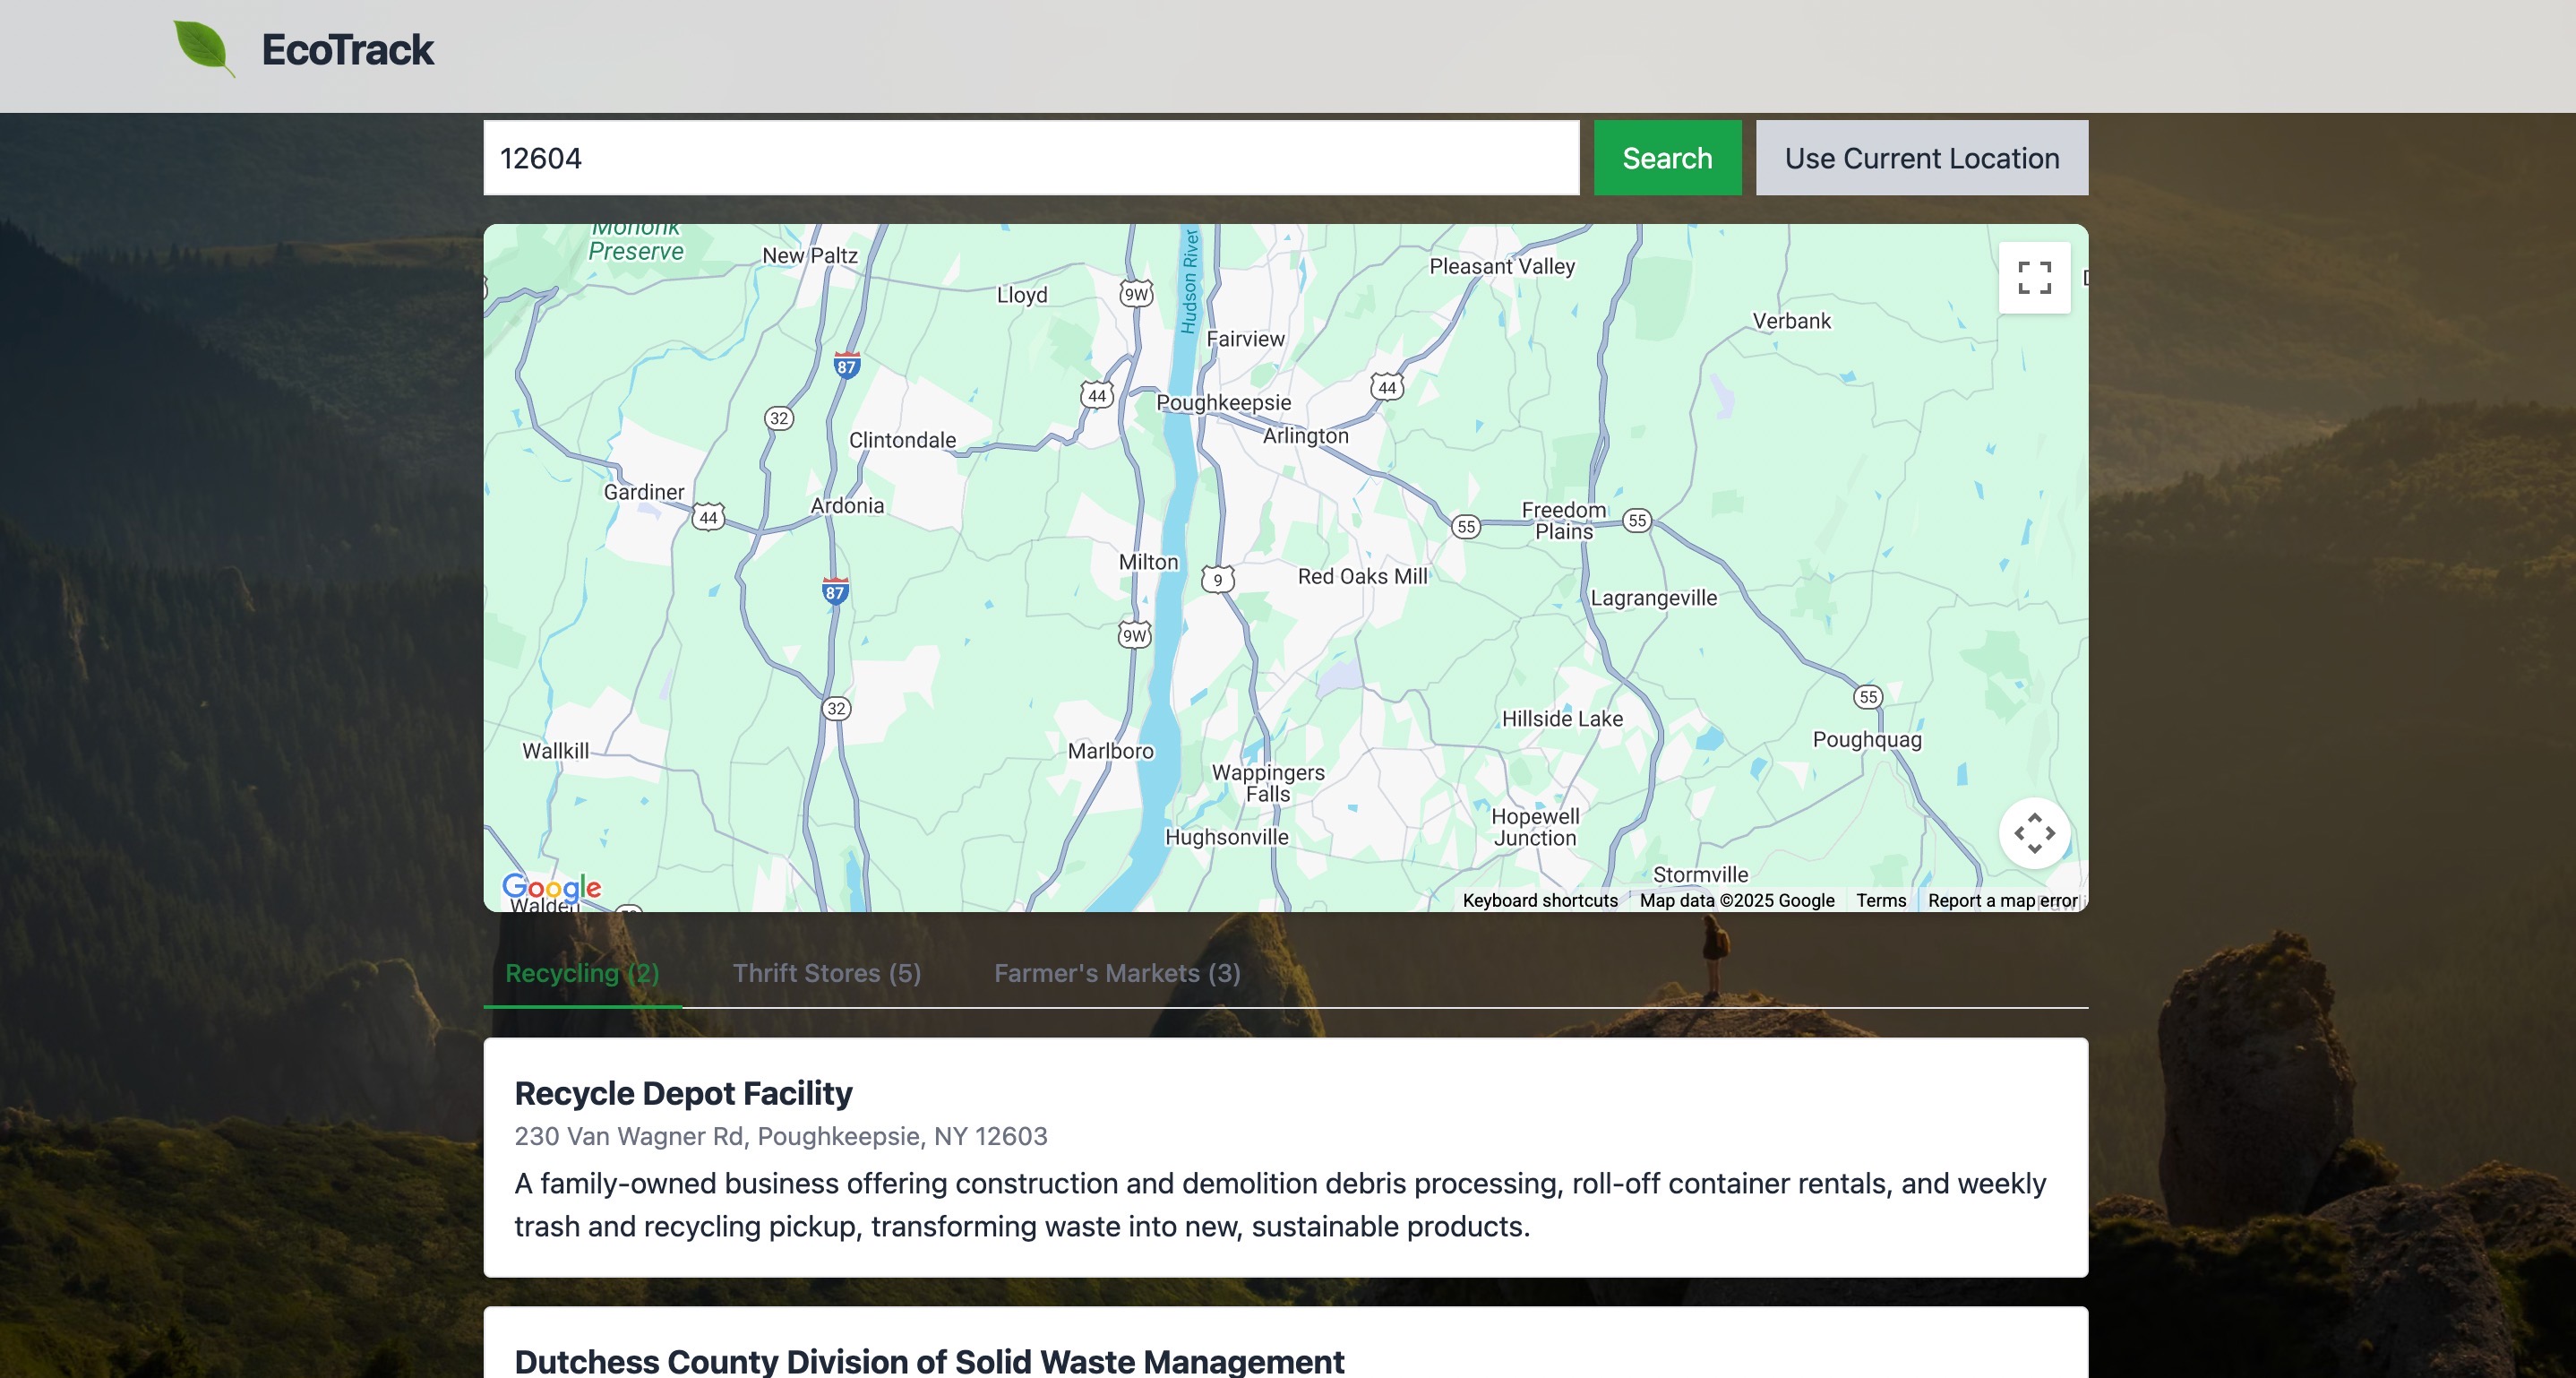
CO₂ concentration is displayed in parts per million (ppm) -See local resouces such as thrift stores, farmers market, and recycling centers based on location. ---
- Access local recycling guidelines based on location and item.
How we built it
- Frontend: React with Tailwind CSS for responsive design and smooth animations.
- Backend: TypeScript/Node.js API for handling quiz results, eco-action logs, and fetching recycling data.
- Data: Integrated public environmental APIs for air quality and local recycling information.
- UX Enhancements: Feature cards with hover effects, animated icons, and a semi-transparent background overlay.
Challenges we ran into
- Making the UI visually appealing while keeping the background interactive and unobtrusive.
- Ensuring real-time air quality data is loaded efficiently without slowing down the app.
- Balancing animation effects with accessibility and readability.
Accomplishments that we're proud of
- A fully interactive and responsive platform that guides users toward sustainability.
- Integration of multiple data sources, including local recycling and live air quality feeds.
- A smooth and visually appealing design that combines informative content with playful animations.
What we learned
- How to design a user-friendly interface that communicates environmental data clearly.
- Effective use of Tailwind CSS and React animations for interactive elements.
- Techniques for integrating and visualizing live API data in a performant way.
What's next for EcoTrack
- Adding more personalized recommendations based on users’ carbon footprint trends.
- Gamifying eco-friendly actions to encourage long-term engagement.
- Expanding the database to cover more local recycling rules and sustainable resources globally.

Log in or sign up for Devpost to join the conversation.