-
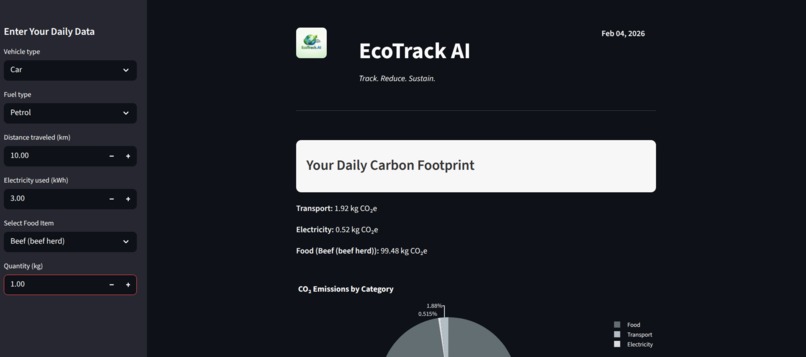
Daily Carbon Footprint
-
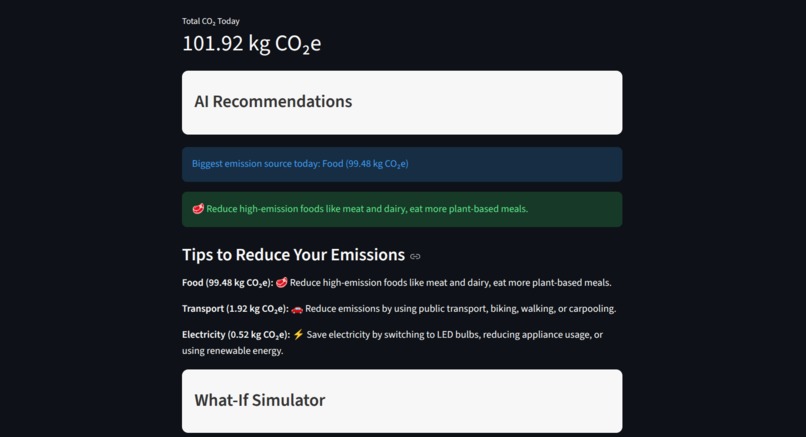
AI Recommendations
-
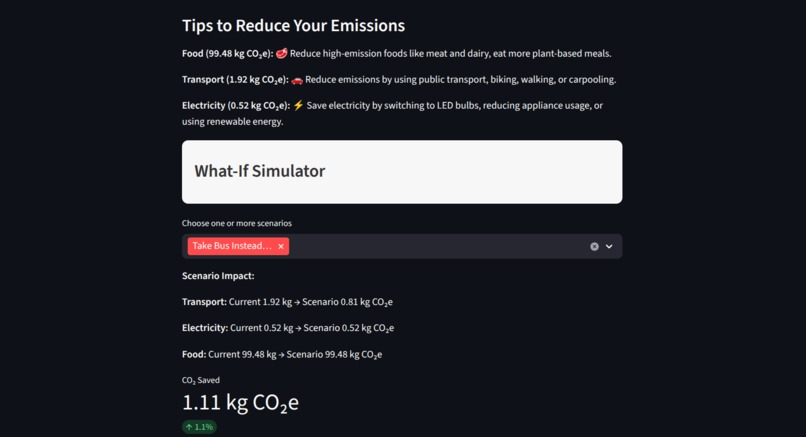
What-If Simulator
-
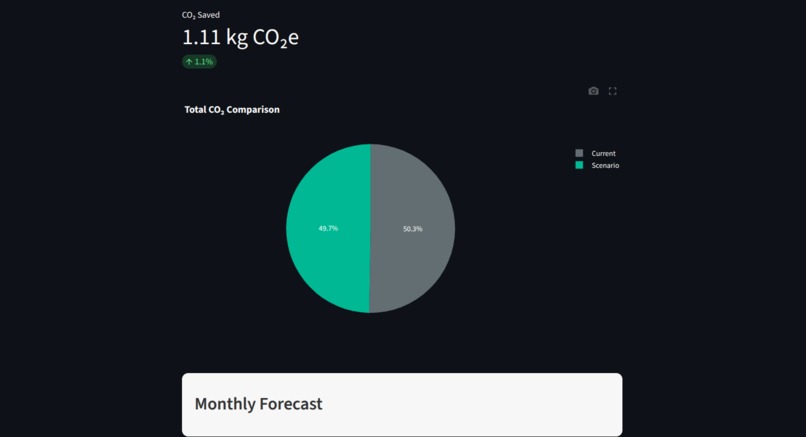
What-If Simulator


About EcoTrack AI 🌱
Inspiration
The idea for EcoTrack AI came from the growing concern about climate change and the lack of accessible tools for individuals to measure and reduce their carbon footprint.
While there are several carbon calculators online, most are static, hard to interpret, and do not provide actionable insights or predictive capabilities.
We wanted to create a hackathon-ready solution that not only calculates emissions but also motivates users to take concrete steps toward sustainability.
What We Learned
Throughout this project, we learned:
- How to handle real-world datasets for transport, electricity, and food emissions.
- Streamlit UI/UX design for interactive dashboards and charts.
- The importance of personalization and gamification in behavior-change applications.
- Techniques for forecasting future carbon emissions using historical data.
- Structuring a project modularly, keeping the core calculator, AI recommendations, forecasting, and history tracking separate but integrated.
How We Built It
- Core Calculator:
We started by building a reliable carbon footprint calculator using verified emission factors from datasets.
The daily footprint (E_{\text{total}}) is calculated as:
$$ E_{\text{total}} = E_{\text{transport}} + E_{\text{electricity}} + E_{\text{food}} $$
where:
- transport = Emissions from car, bus, train, or flight
- text{electricity = Emissions from electricity usage (kWh)
- food = Emissions from meat and plant-based meals
Dashboard & UI:
Using Streamlit, we created a single-page dashboard with a sidebar for inputs, sections for output metrics, charts, and AI recommendations.
The dashboard includes:- Emissions breakdown pie chart
- Total daily CO₂ metric
- AI recommendations
- What-If simulator
- Forecasting module
- EcoScore + badges
- Historical progress chart
- Emissions breakdown pie chart
AI Recommendations:
Developed a simple heuristic AI system that identifies the biggest emission sources and provides actionable tips.
Example:“Your largest contributor today is Transport (62%). Consider taking public transport or carpooling.”
What-If Simulator:
Users can test lifestyle changes and immediately see predicted CO₂ savings.- Vegetarian meals twice a week
- Switching from car to bus
- Reducing electricity usage
- Vegetarian meals twice a week
Forecasting:
Monthly forecasts are generated using simple trend calculations based on daily input data:
$$ E_{\text{monthly}} \approx 30 \times E_{\text{daily}} $$
Users can compare their current trajectory with the reduction scenarios.
Sustainability Score & Gamification:
The EcoScore encourages daily improvement:- 0–40: Eco Beginner
- 41–70: Green Champion
- 71–100: Climate Hero
- 0–40: Eco Beginner
Data Persistence:
All daily emissions and EcoScore data are stored in a SQLite database, allowing progress tracking and history visualization.
Challenges Faced
- Integrating multiple modules (calculator, AI recommendations, forecasting, what-if scenarios) into a single coherent dashboard.
- Handling multiple food items dynamically in real-time while keeping calculations accurate.
- Ensuring UI clarity and spacing for judges to quickly understand metrics.
- Mapping CSV datasets to consistent DB fields without errors.
- Forecasting and What-If calculations had to be simple yet meaningful for hackathon presentation.
Reflection
This project taught us how to turn raw datasets into actionable insights using AI and interactive visualizations.
It also emphasized the importance of UX in sustainability apps: if insights are not clear, users won’t act on them.
EcoTrack AI is not just a calculator; it’s a decision-driven platform that empowers individuals to see the impact of their choices and motivates behavior change for a greener future. 🌍

Log in or sign up for Devpost to join the conversation.