Inspiration
The ECOSPHERE project is driven by the need for real-time environmental intelligence, enabling proactive measures for sustainability through data collection, analysis, and visualization of weather and air quality information.
What it does
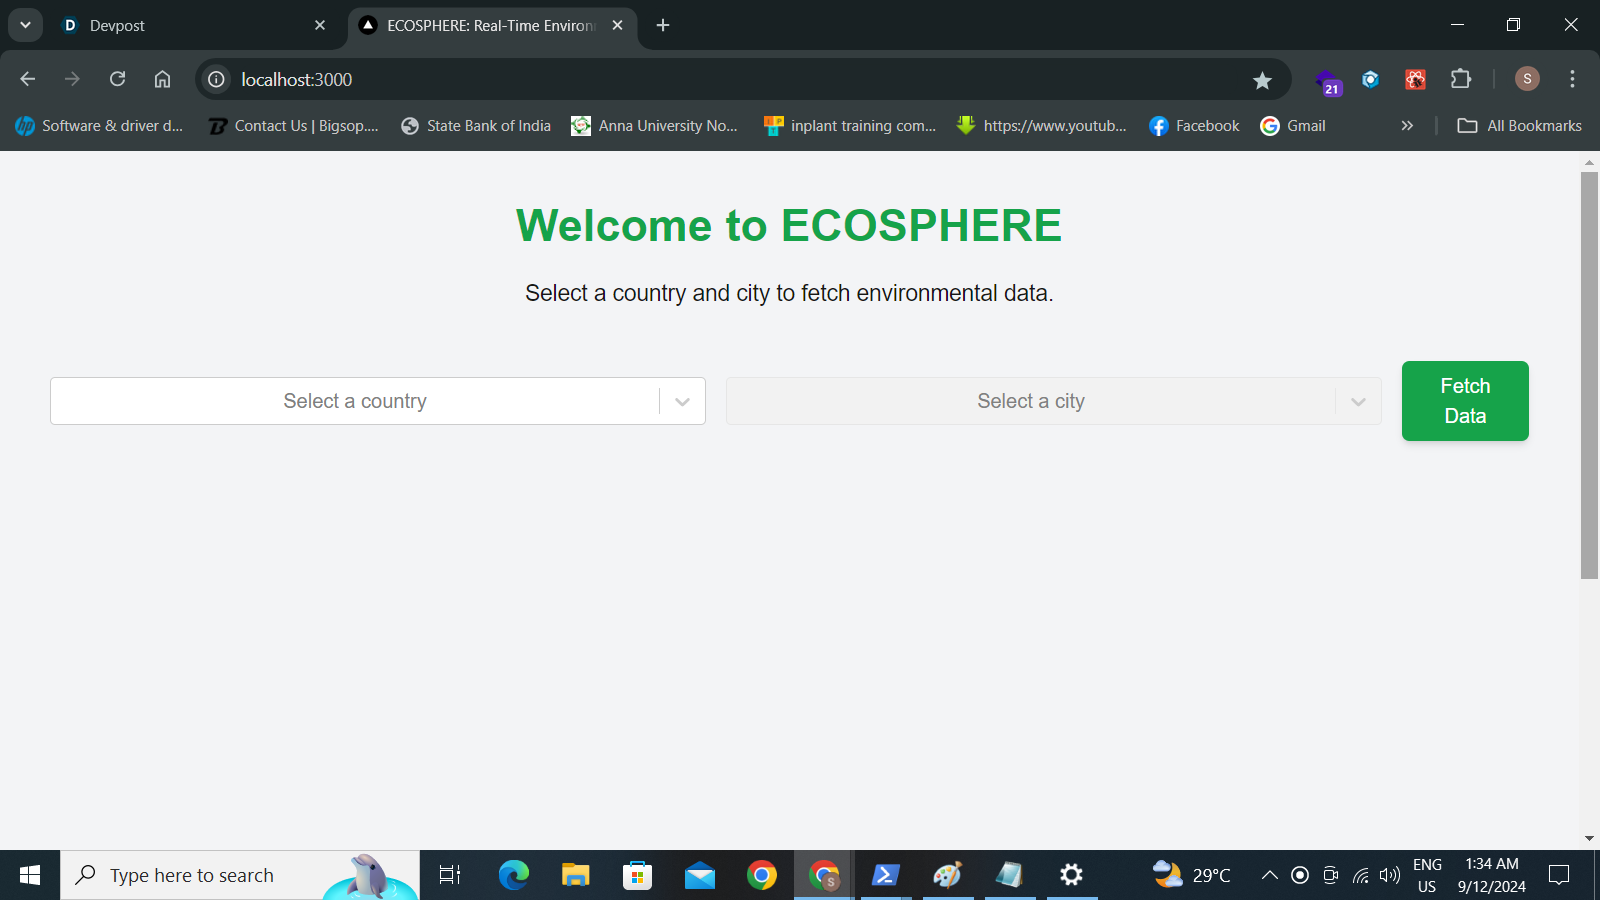
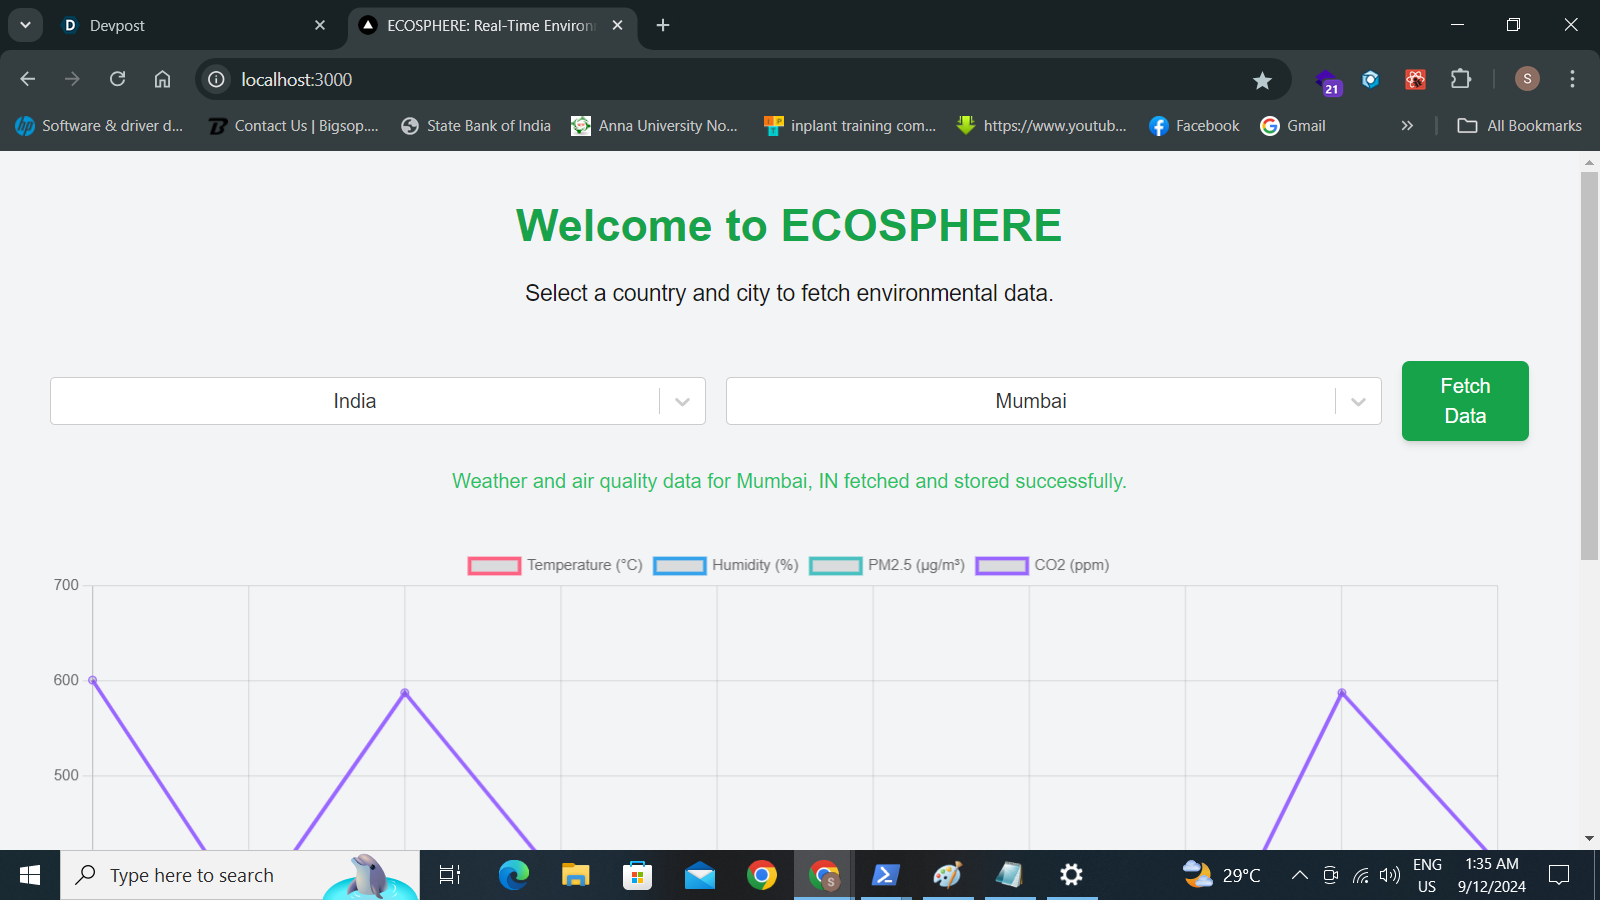
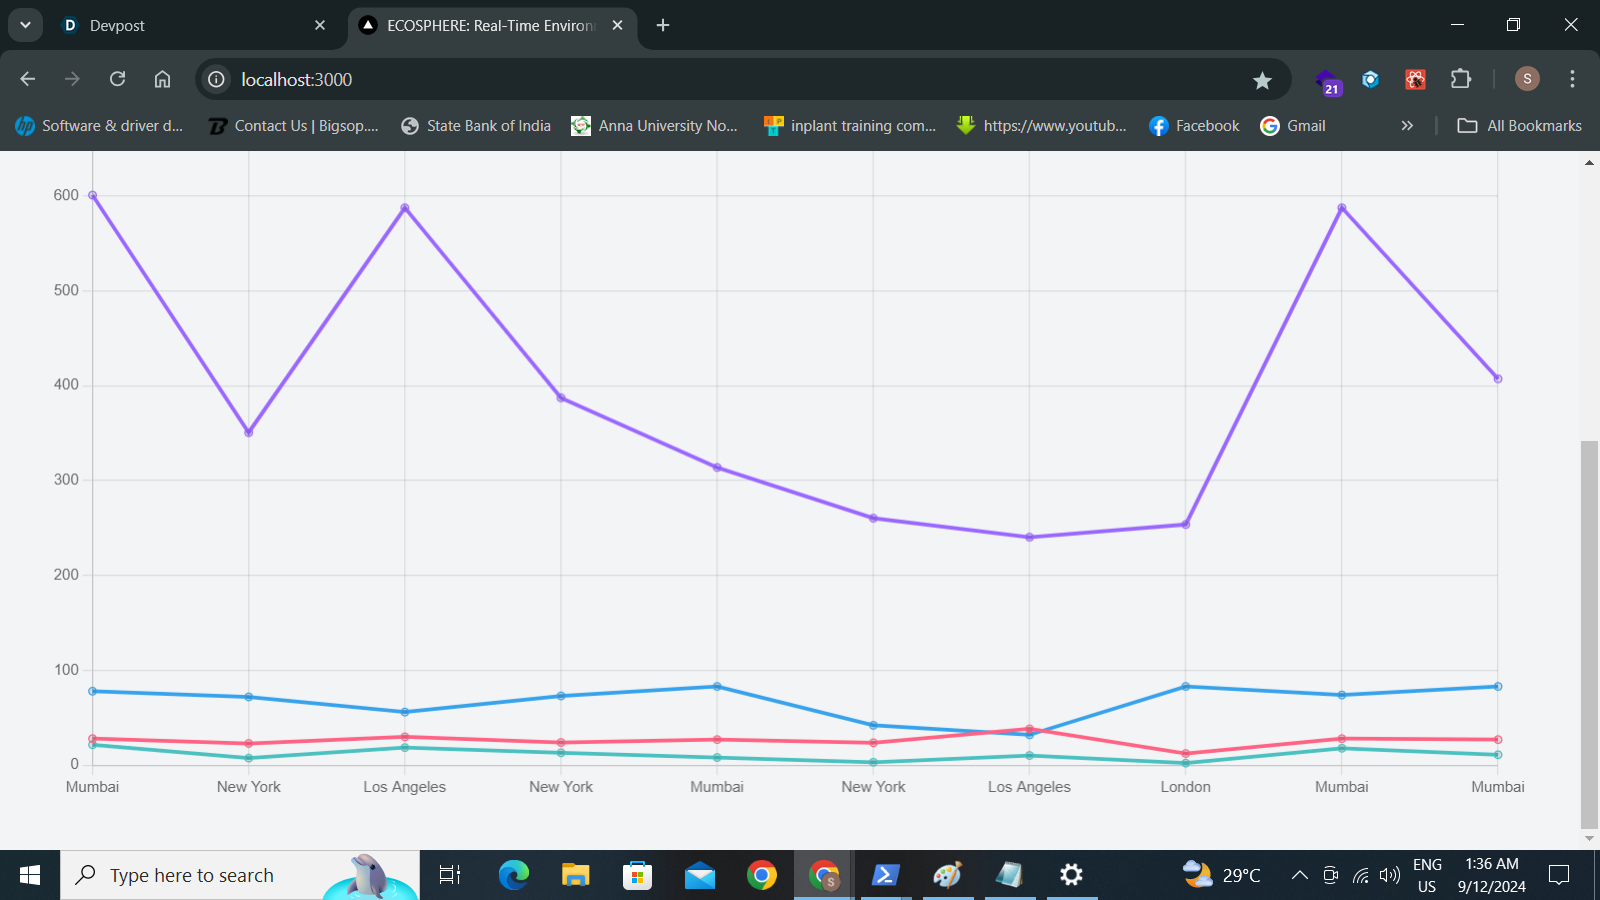
ECOSPHERE gathers, processes, and visualizes environmental data in real-time, focusing on weather and air quality. It aims to offer valuable insights through a public interface, helping stakeholders make informed decisions.
How we built it
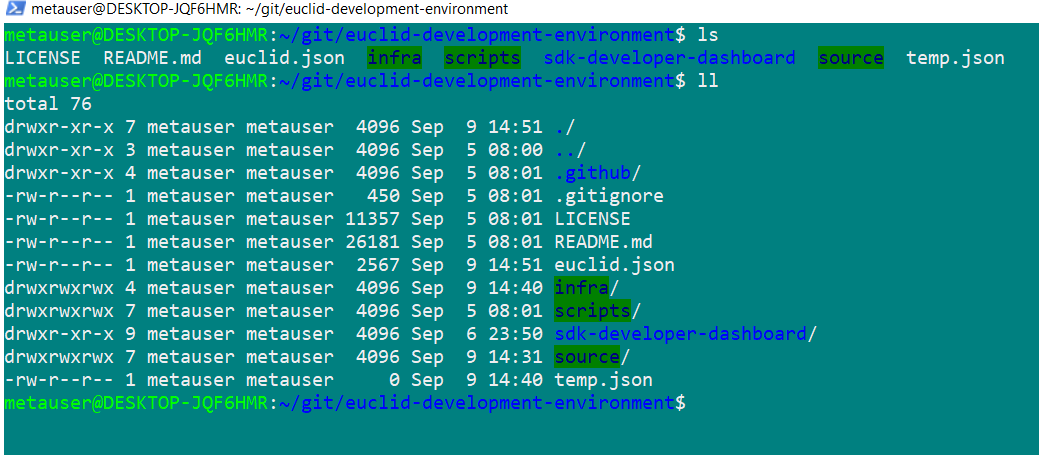
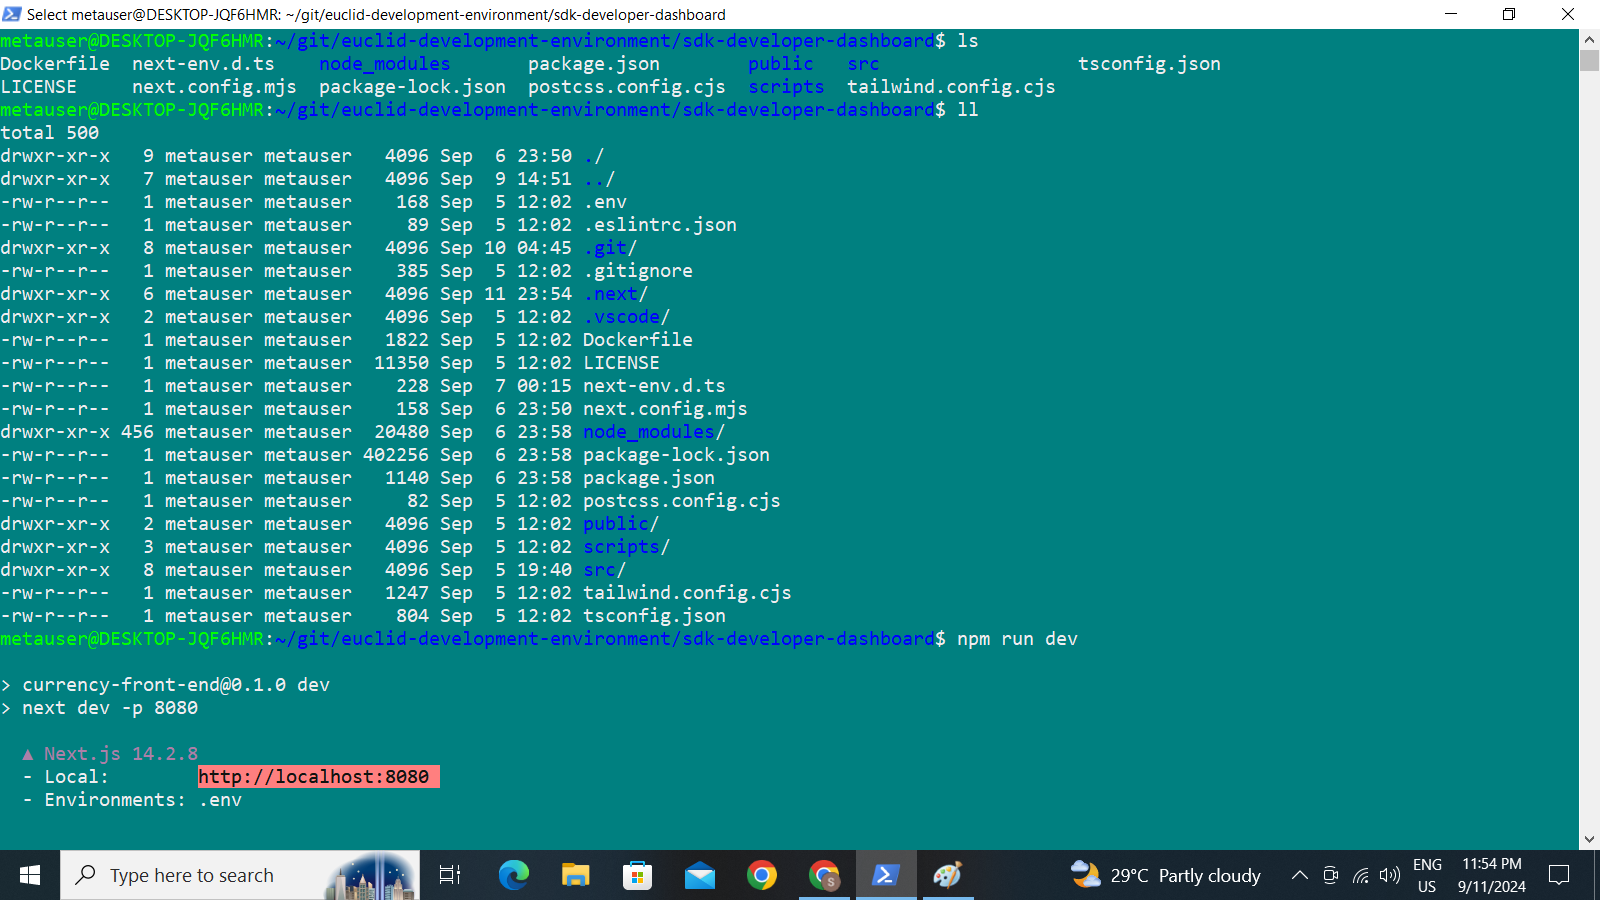
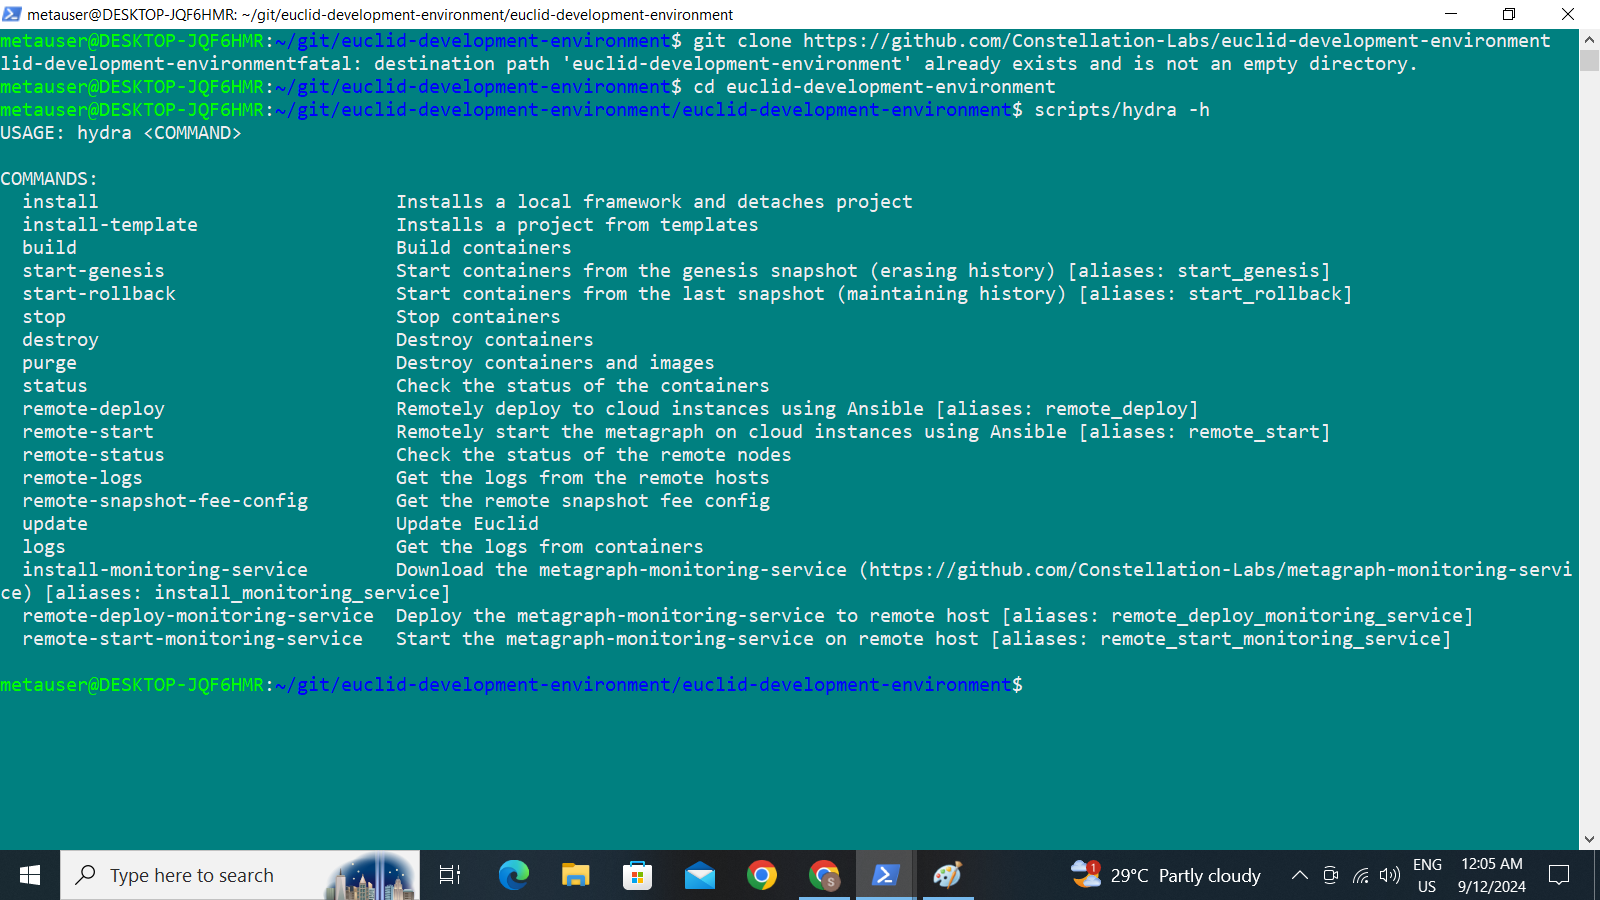
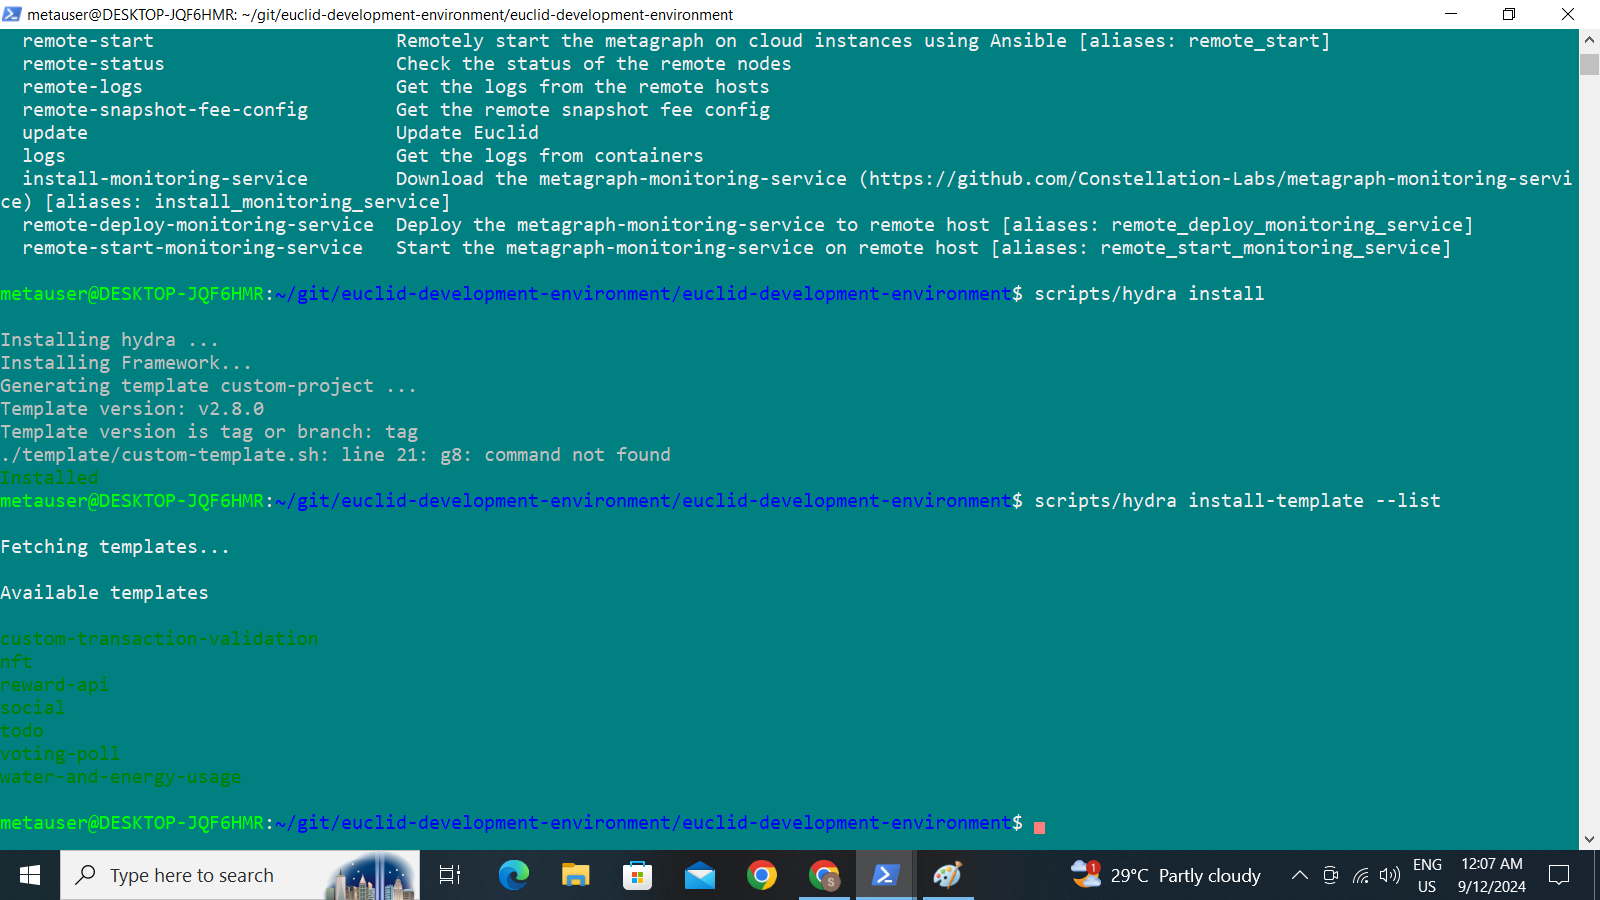
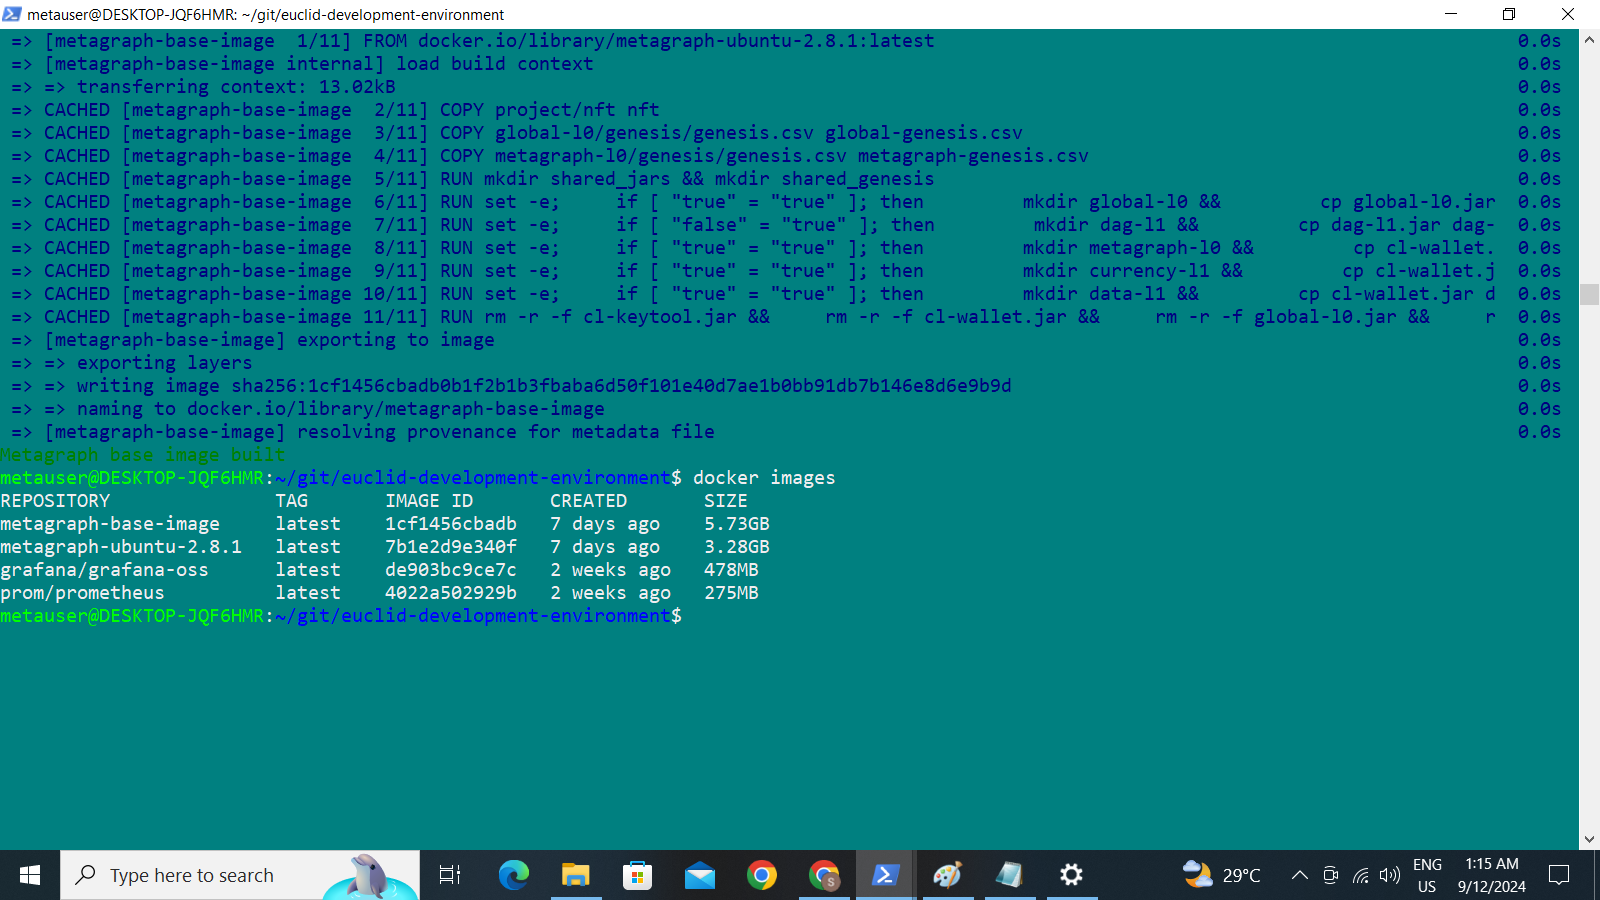
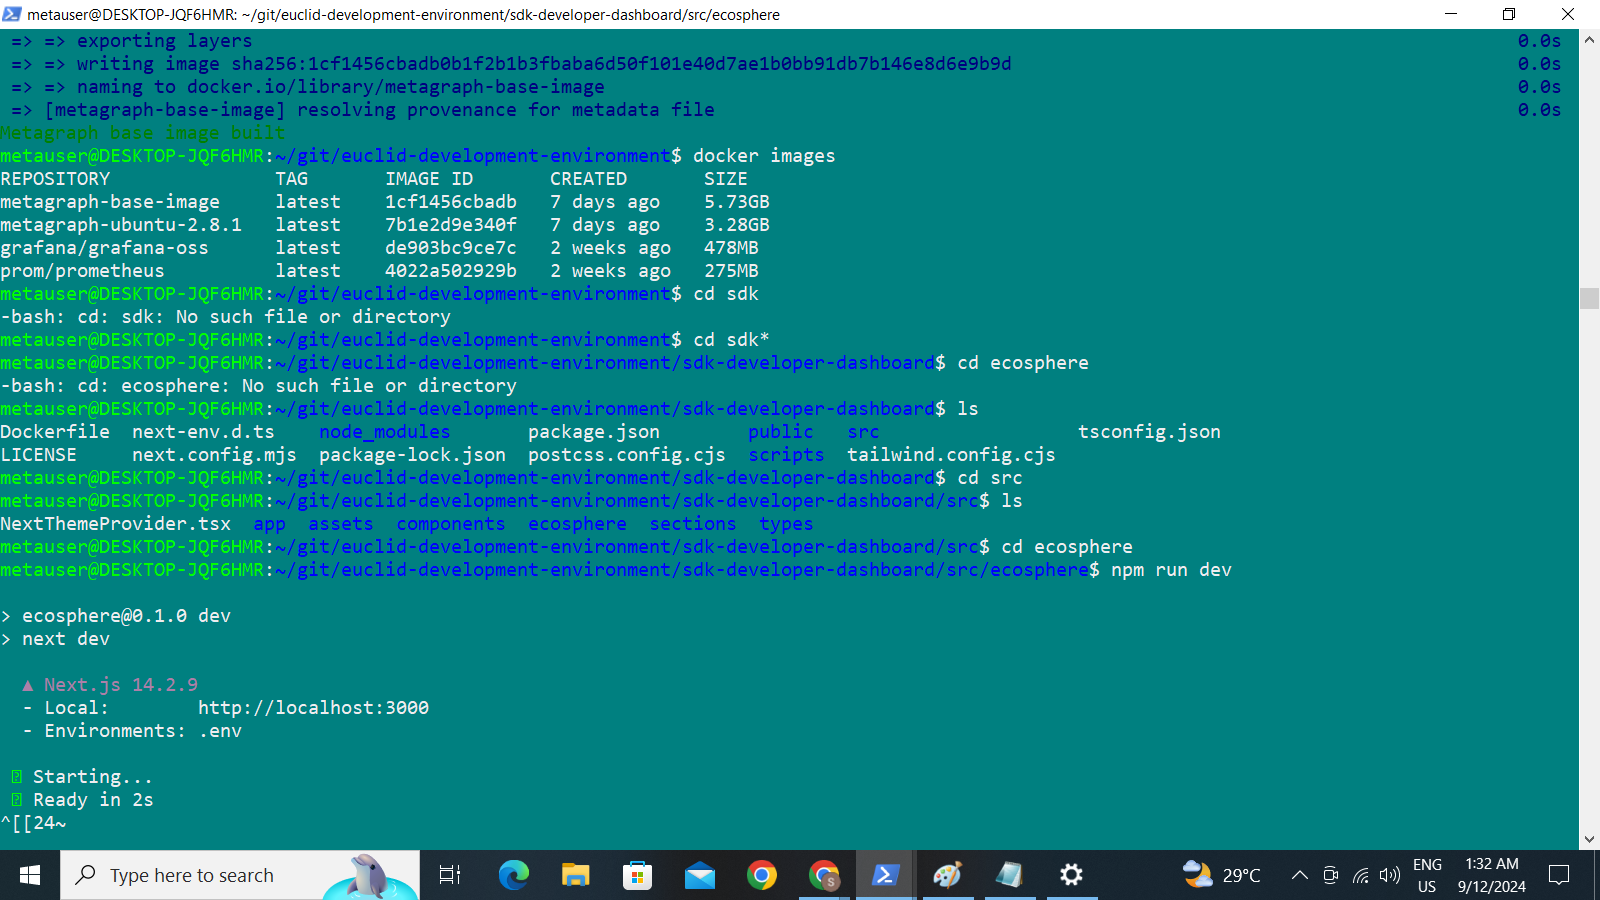
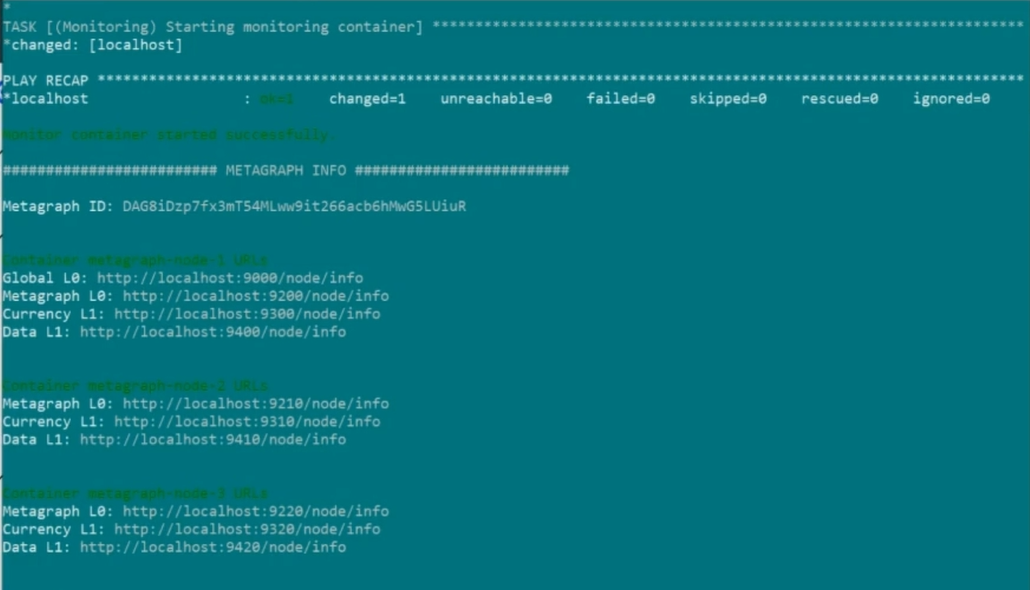
We utilized the Euclid SDK for metagraph development, integrating weather and air quality APIs. The project is structured around Docker, Grafana for visualization, and advanced data processing using Python.
Challenges we ran into
We encountered issues in setting up the SDK and managing Docker containers, along with complexities in integrating data sources and ensuring real-time processing accuracy.
Accomplishments that we're proud of
Successfully building a system to collect and visualize real-time environmental data and implementing seamless integration with Grafana for data dashboards.
What we learned
We deepened our understanding of metagraph technology, Docker containerization, and real-time data processing. We also enhanced our skills in API integration and environmental data analysis.
What's next for ECOSPHERE: A Metagraph for Real-Time Environmental Intelligence
We plan to expand data collection by integrating additional sensors for air, water, and noise pollution. Enhancements will also focus on predictive analytics, public data sharing, and improving the scalability of the system.


Log in or sign up for Devpost to join the conversation.