EcoSignal
Evidence-based environmental monitoring
What if a satellite tells you that vegetation has changed—but you don't know whether it is a real disturbance, a temporary signal, bad data, weather, or something else?
That question inspired EcoSignal.
EcoSignal is an evidence-based environmental monitoring prototype that detects unusual vegetation behavior from satellite observations, verifies whether the signal persists, and evaluates independent environmental evidence before recommending human investigation.
Its core principle is:
«An unusual measurement is a hypothesis, not a discovery.»
The system follows:
Detect → Verify → Explain
Why I built it
Satellite imagery makes it possible to monitor large areas without being physically present. But detecting something unusual is only the beginning.
A single unusual vegetation measurement can be misleading. It may result from data-quality issues, transient conditions, natural variation, or other factors that cannot be identified from the vegetation signal alone.
I wanted to build a system that did not immediately turn an anomaly into a confident environmental claim.
Instead, EcoSignal asks:
«Does this unusual signal have enough independent and persistent evidence to deserve investigation?»
- Detect
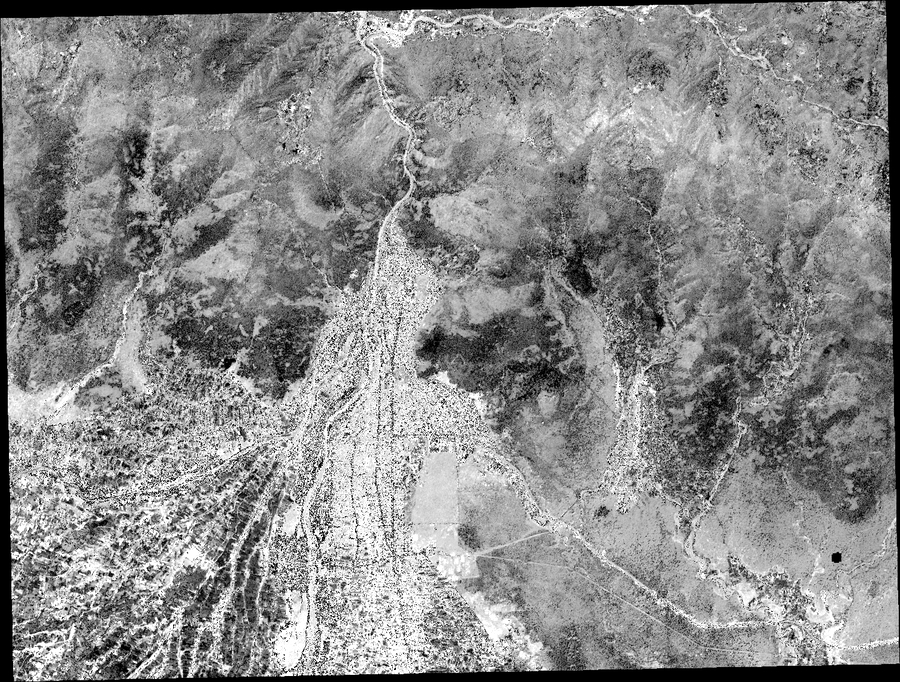
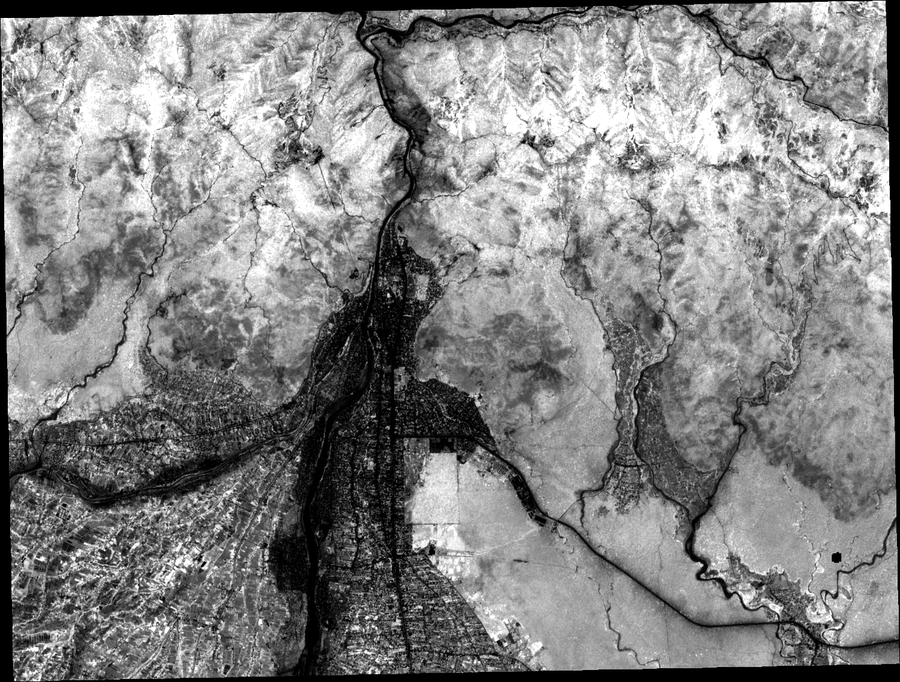
EcoSignal uses Sentinel-2 Level-2A satellite observations over a study area in Butwal, Nepal.
It derives NDVI (Normalized Difference Vegetation Index) from the red and near-infrared bands:
$$ NDVI = \frac{NIR - Red}{NIR + Red} $$
NDVI is a measurement derived from how vegetation reflects different wavelengths of light. EcoSignal uses changes in this measurement to identify pixels behaving unusually compared with a seasonal reference baseline.
The baseline uses robust statistics, including the median and MAD (Median Absolute Deviation), rather than relying only on the mean and standard deviation.
The target observation was March 30, 2025.
- Verify
Detection alone is not enough.
The initial detector was intentionally tested before being accepted. A naive configuration produced an anomaly covering approximately 42.2% of the usable area. I treated that result as a problem rather than presenting it as a successful detection.
The detector was then recalibrated using a robust anomaly-score approach with a 2.5-sigma threshold and minimum data-quality requirements.
At the selected threshold:
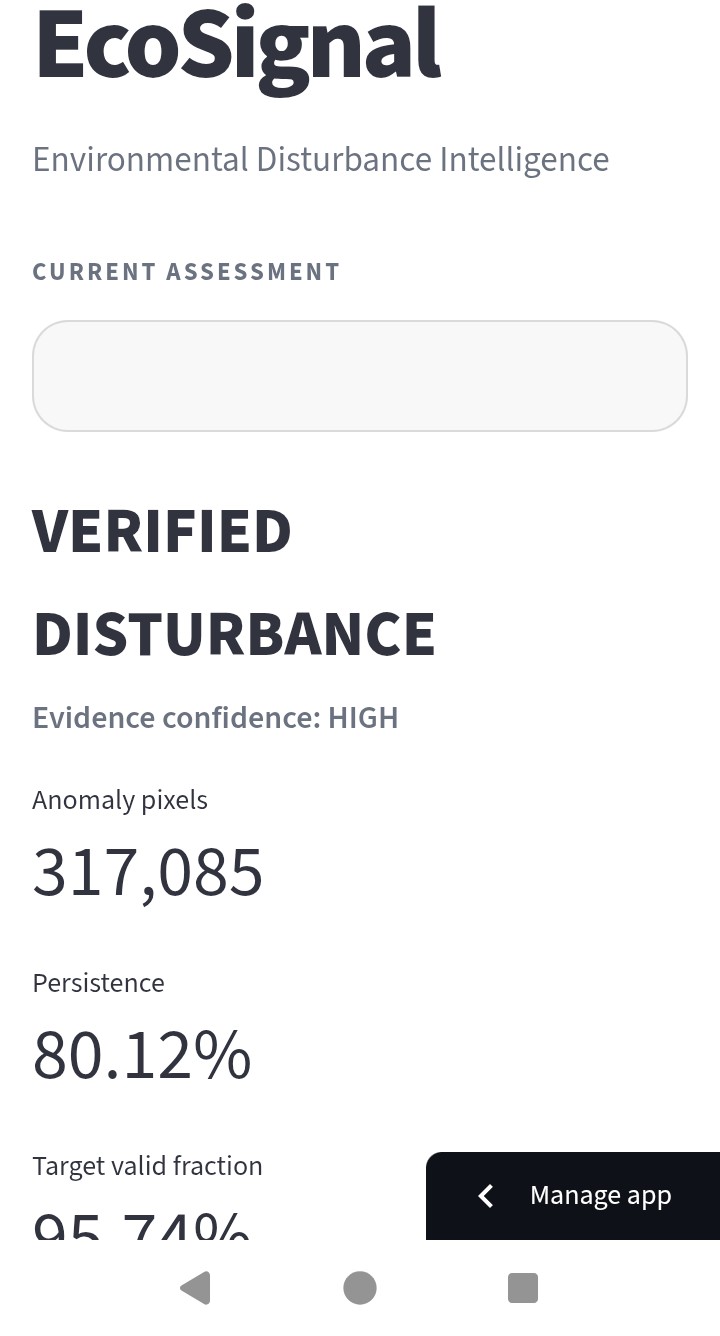
- 317,085 target pixels were identified as anomaly candidates.
- 80.12% of those initial anomaly pixels remained anomalous under the current persistence definition across later Sentinel-2 observations.
- Seven subsequent observations were used for persistence analysis.
The important distinction is that these are anomaly candidates and persistence measurements, not a claim that 80.12% of the pixels are confirmed real-world disturbances.
- Explain
EcoSignal evaluates independent evidence separately instead of combining everything into an unsupported causal claim.
Weather evidence
Historical weather context was evaluated using Open-Meteo's ERA5-Land reanalysis data.
For the target period:
- Mean temperature: 22.94°C
- Temperature anomaly: 0.45 standard deviations
- Maximum temperature anomaly: 0.53 standard deviations
- No unusual dry or warm condition was detected under the implemented thresholds.
Weather is treated as regional context, not as 10-meter ground truth.
Fire / thermal evidence
EcoSignal also evaluates NASA FIRMS VIIRS thermal detections around the target period.
For this case:
- 40 thermal detections
- 36 after the target date
- 4 before the target date
- 0 returned detections classified as high-confidence
- 40 detections classified by the retrieved data as presumed vegetation-fire type
- Total reported FRP: 78.96 MW
These are thermal-anomaly observations. They do not prove that a wildfire occurred at every detection location, and they do not prove that fire caused the observed vegetation anomaly.
Evidence decision
For the current demonstration case, the evidence engine produces:
VERIFIED_DISTURBANCE
with:
- Detection: supported
- Persistence: supported
- Weather support: not supported
- Fire/thermal support: present
- Data quality: supported
- Evidence score: 6/7
- Confidence label: HIGH
Here, VERIFIED_DISTURBANCE means that the anomaly passed EcoSignal's current evidence and persistence rules. It does not mean that a physical cause has been scientifically proven.
The system therefore recommends the signal for human investigation, rather than automatically assigning a cause.
Robustness testing
I also tested whether the result depended strongly on arbitrary parameter choices.
Changing the anomaly threshold from 2.0 to 4.0 sigma produced persistent fractions ranging from approximately 82.3% to 75.3%.
I also tested persistence-threshold sensitivity at 0.10, 0.25, 0.50, and 0.75, with the current case remaining classified as verified under all four tested thresholds.
Finally, I performed a leave-one-post-observation-out test, removing each of the seven subsequent Sentinel-2 observations one at a time.
The resulting persistence fraction ranged from approximately 57.4% to 80.1%.
This does not establish accuracy, precision, recall, or a general false-positive rate. It is a robustness test of the current demonstration case.
What I learned
One of the most important lessons was that getting a large number of detections is not the same as building a useful monitoring system.
My first detector produced an implausibly large anomaly area. Instead of hiding that result, I used it to rethink the detection criteria.
I learned to distinguish between:
- an unusual measurement,
- a persistent signal,
- independent supporting evidence,
- a possible explanation,
- and a scientifically validated causal conclusion.
That distinction shaped the entire architecture of EcoSignal.
Challenges
The main challenges were not simply getting satellite data onto a map.
I had to deal with:
- satellite scene discovery and acquisition,
- surface-reflectance preprocessing,
- cloud and scene-quality masking,
- different spatial resolutions between Sentinel-2 products,
- constructing a usable seasonal reference,
- avoiding over-sensitive anomaly detection,
- validating persistence across later observations,
- integrating weather and thermal evidence,
- keeping evidence sources separate,
- and making the deployment self-contained without committing large raw satellite datasets.
The final repository contains a compact deployment bundle so the public dashboard can demonstrate the validated case without requiring the entire generated satellite-processing dataset.
Technology
EcoSignal is built in Python and uses satellite geospatial processing, robust statistical detection, environmental evidence integration, validation workflows, and an interactive Streamlit dashboard.
The pipeline is designed as a reproducible sequence:
Satellite data → preprocessing → NDVI → seasonal baseline → anomaly detection → persistence verification → weather evidence → fire evidence → evidence engine → robustness validation → dashboard
Scientific limitations
EcoSignal is a prototype, not a production environmental-monitoring service.
Important limitations include:
- NDVI change does not identify a physical cause.
- Weather evidence is regional rather than pixel-level.
- FIRMS detections are thermal anomalies and do not establish causation.
- The current thresholds are engineering thresholds that require broader empirical calibration.
- The seasonal reference is based on the available pre-target observations rather than a long-term multi-year climatology.
- The current validation is a robustness demonstration for one case, not an accuracy benchmark against independently labeled ground truth.
These limitations are part of the design philosophy rather than something the system hides.
What makes EcoSignal different
Many environmental monitoring systems focus on detecting something unusual.
EcoSignal focuses on what happens after detection.
Instead of:
"The satellite detected something, therefore something happened."
EcoSignal asks:
"The satellite detected something unusual. Does it persist? Is the data trustworthy? Do independent observations support the signal? And is there enough evidence to justify human investigation?"
That shift—from automatic conclusion to evidence-based investigation—is the central idea behind EcoSignal.
Hackathon development
EcoSignal was created and developed during NextStep Hacks 2026.
I developed the EcoSignal repository, environmental-monitoring pipeline, evidence engine, validation workflow, dashboard, deployment bundle, and current demonstration case as part of the hackathon project.
I also conducted separate astronomy research before the hackathon. That research is not an earlier version of EcoSignal and is not being presented as the EcoSignal project. Where relevant, it served only as prior scientific background that influenced my methodological thinking.
Current result
For the March 30, 2025 Butwal demonstration case, EcoSignal identifies a persistent unusual vegetation signal and finds sufficient evidence under its current rules to recommend the area for human investigation.
It does not claim to have identified the physical cause.
That is intentional.
«Detect → Verify → Explain»
An unusual measurement is treated as a hypothesis, not a discovery.

Log in or sign up for Devpost to join the conversation.