-
-
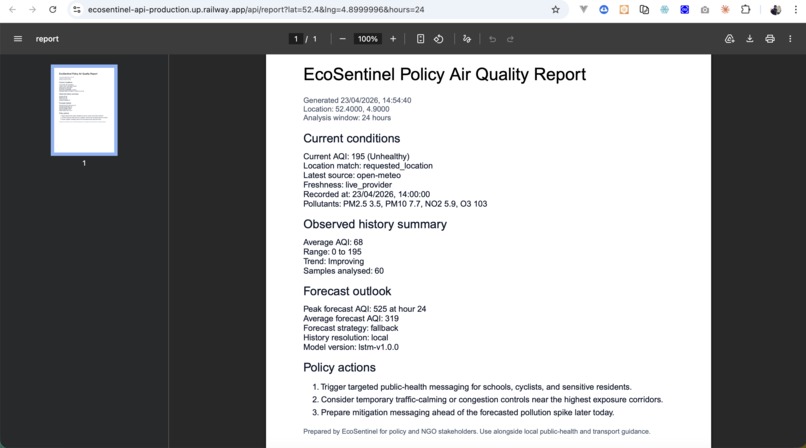
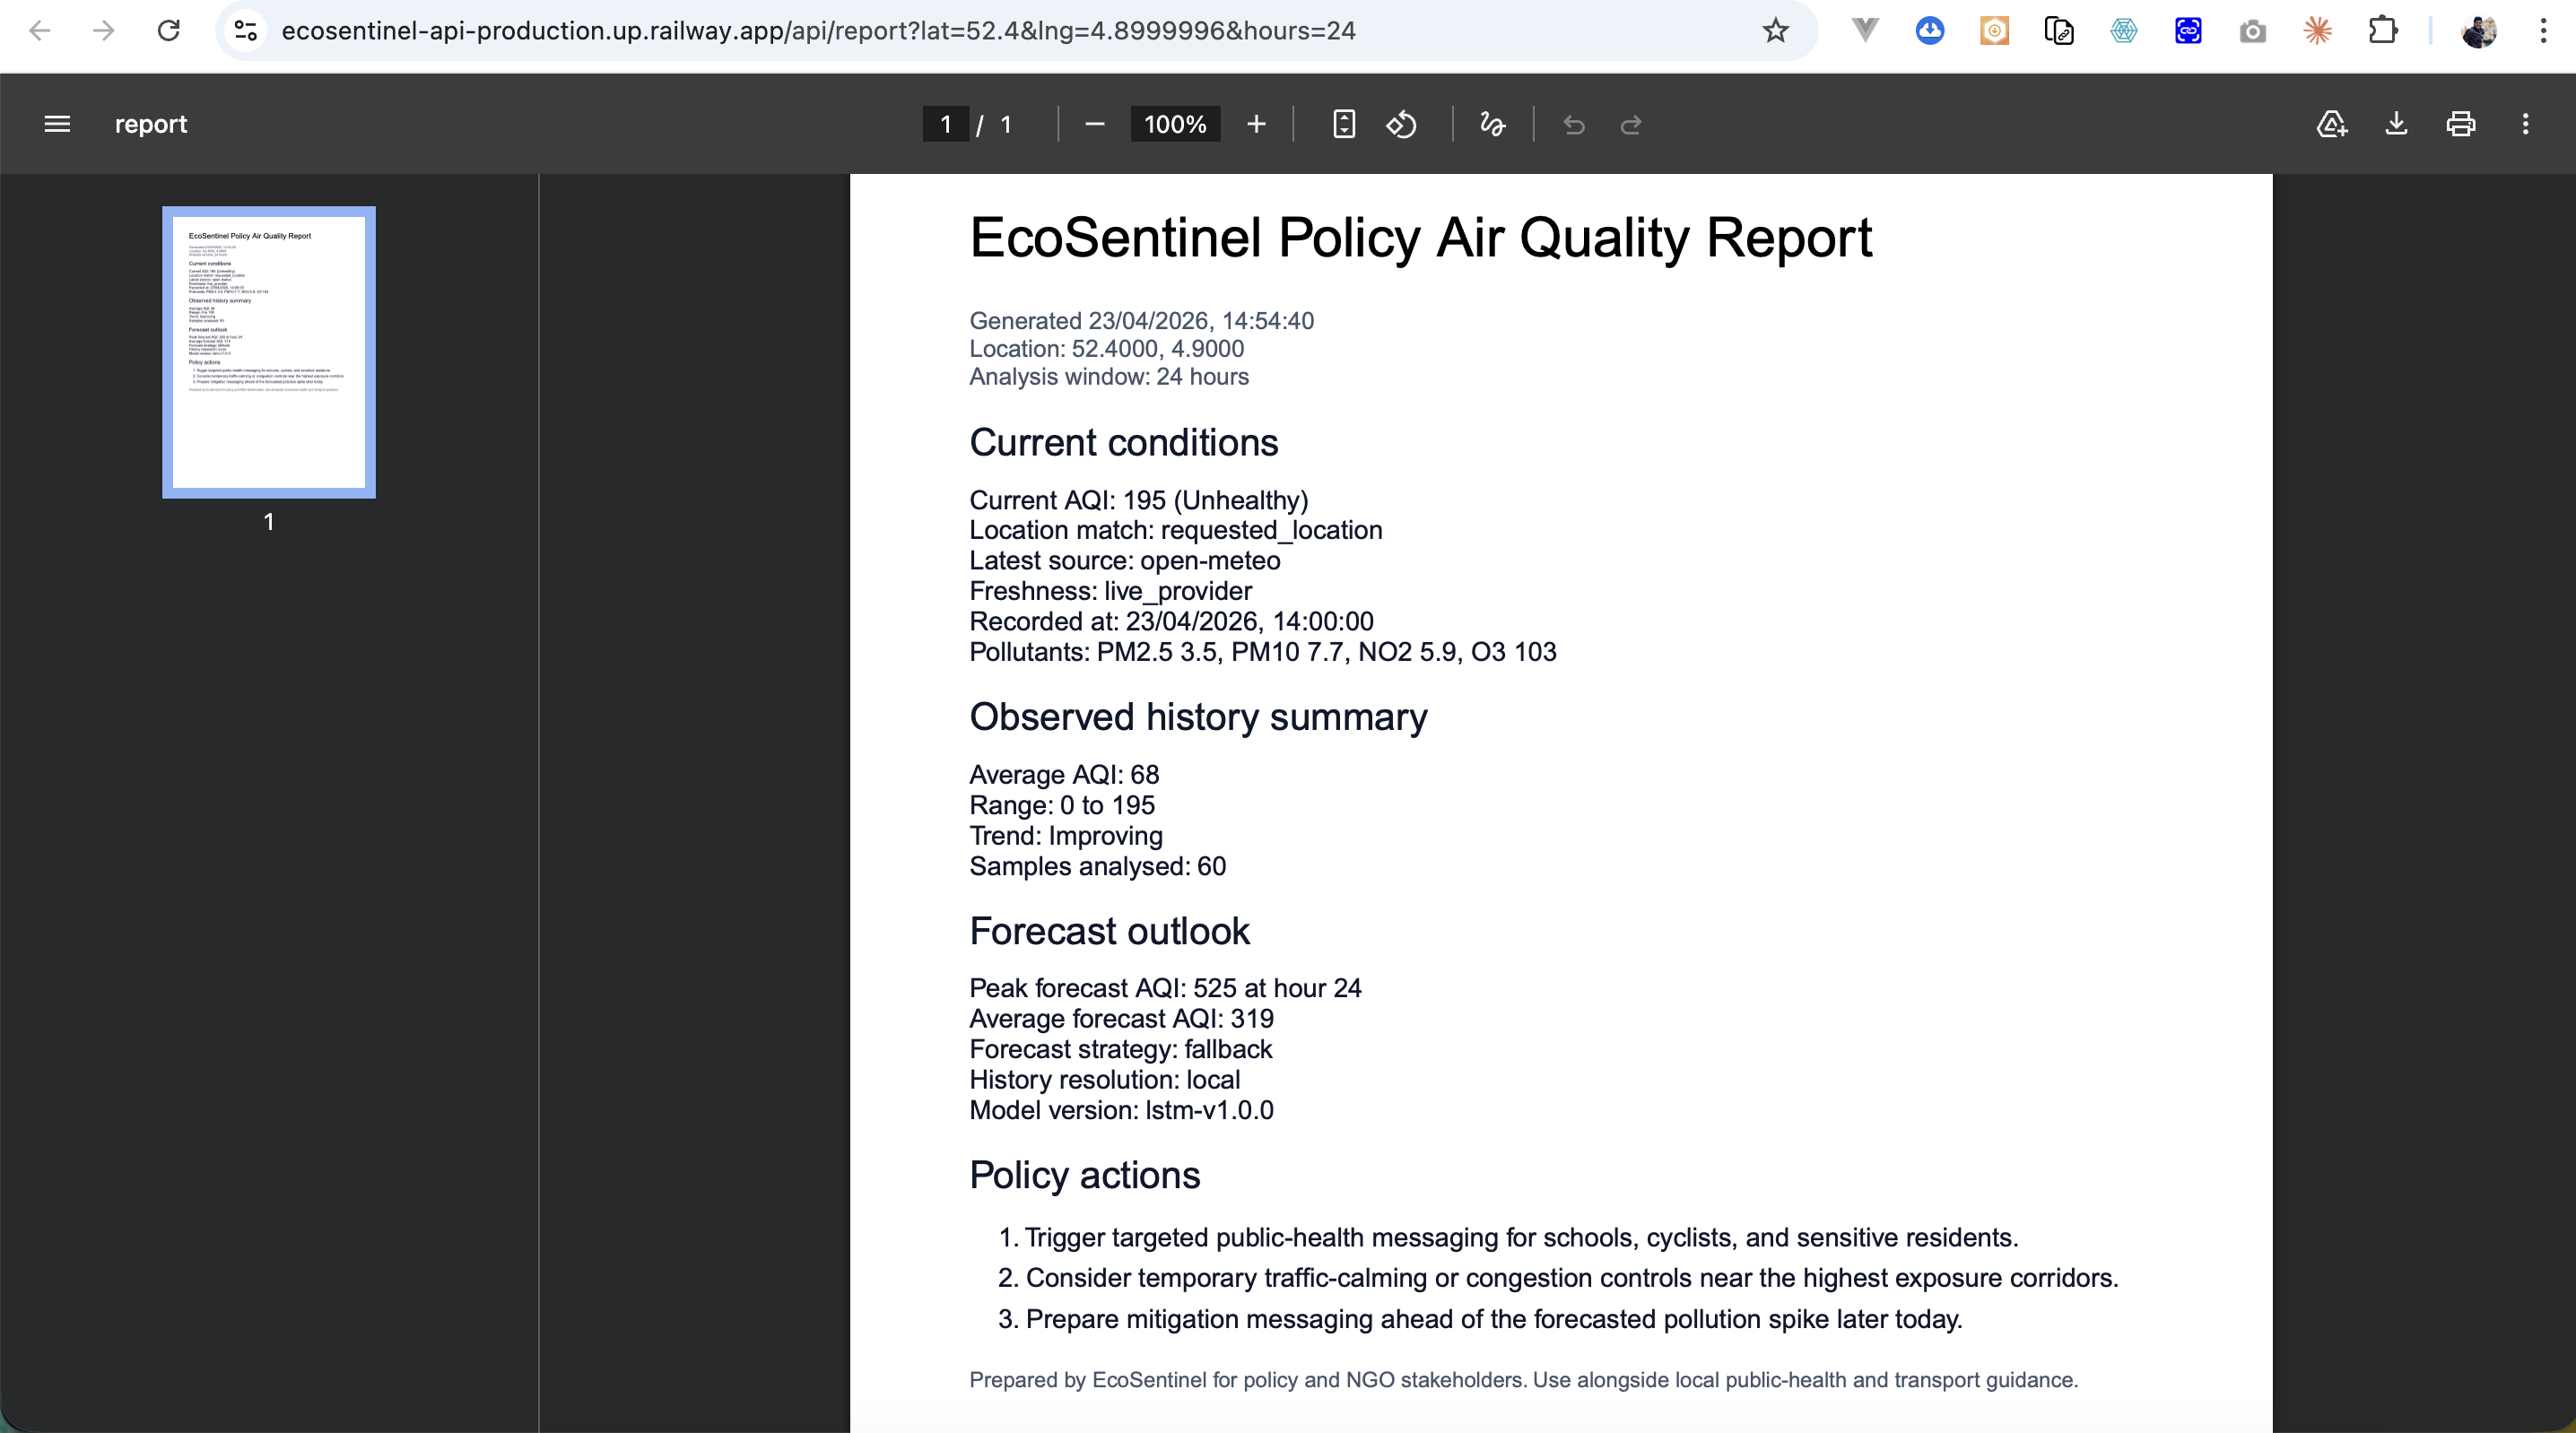
PDF report
-
-
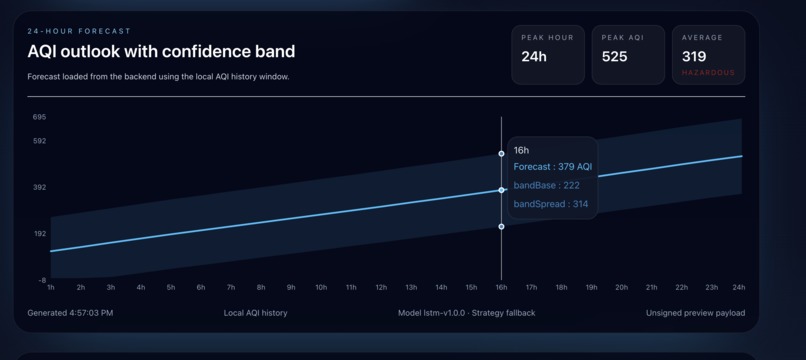
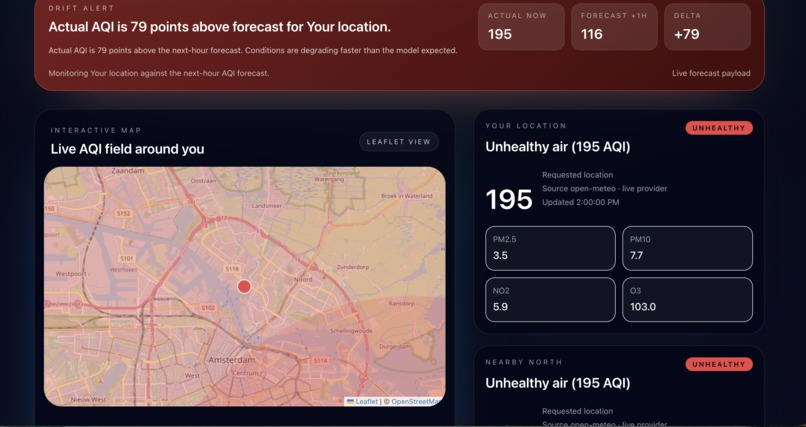
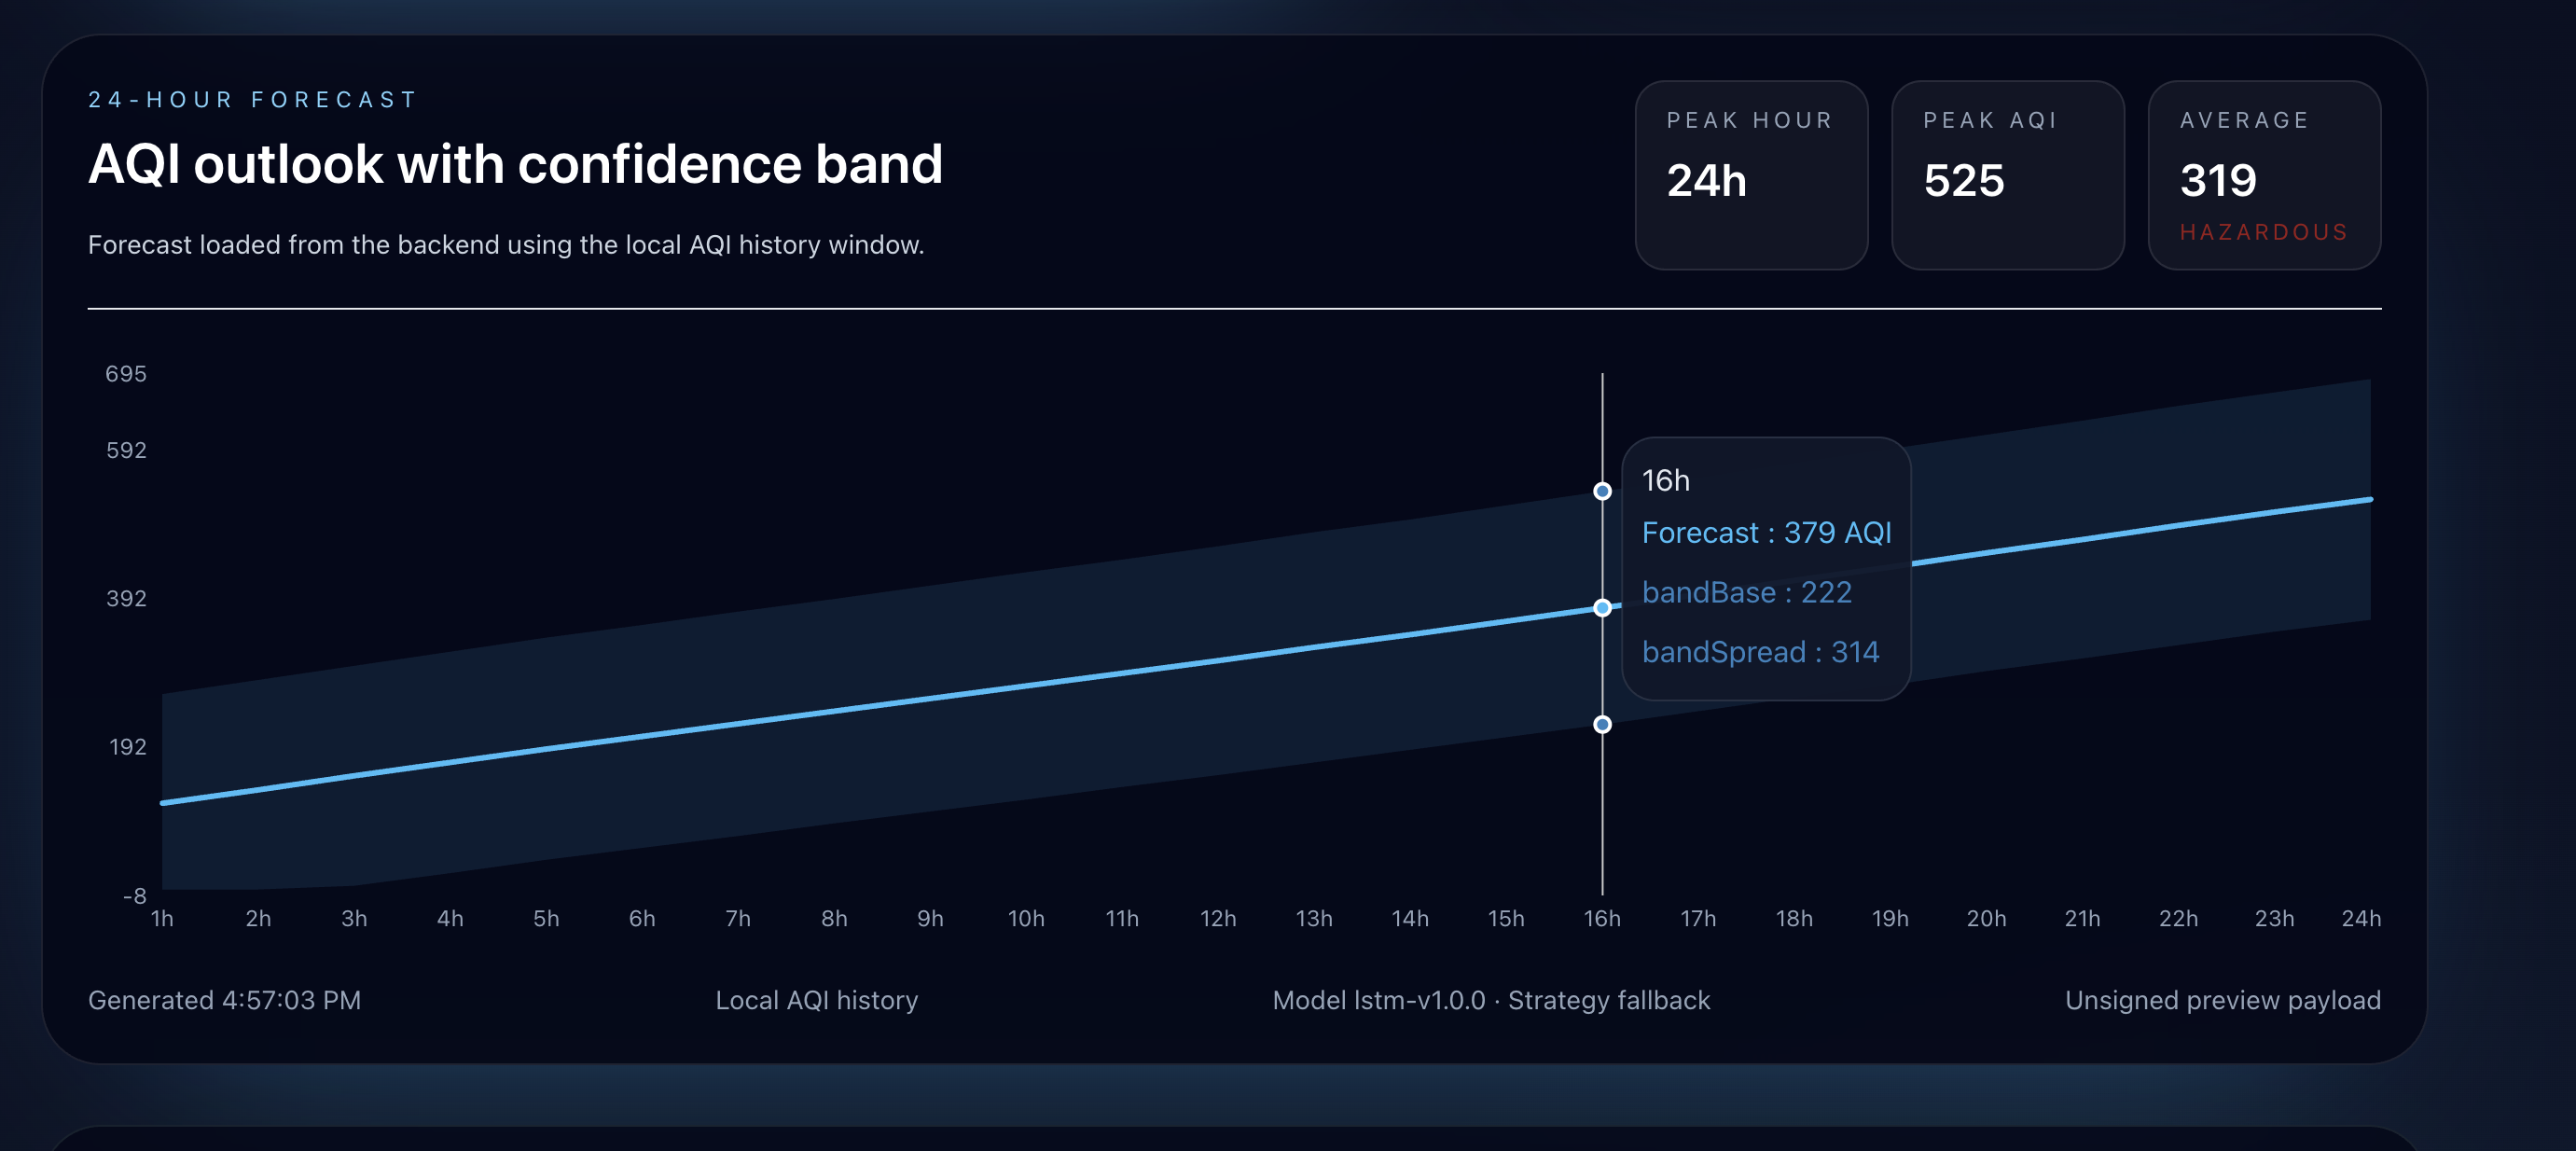
Forecast + drift
-
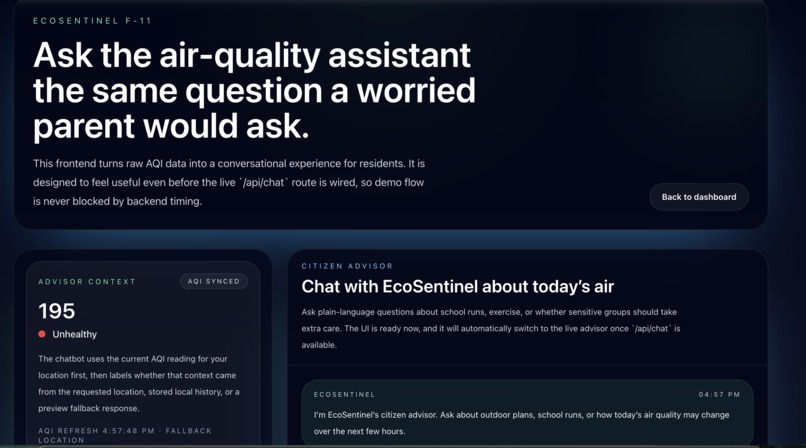
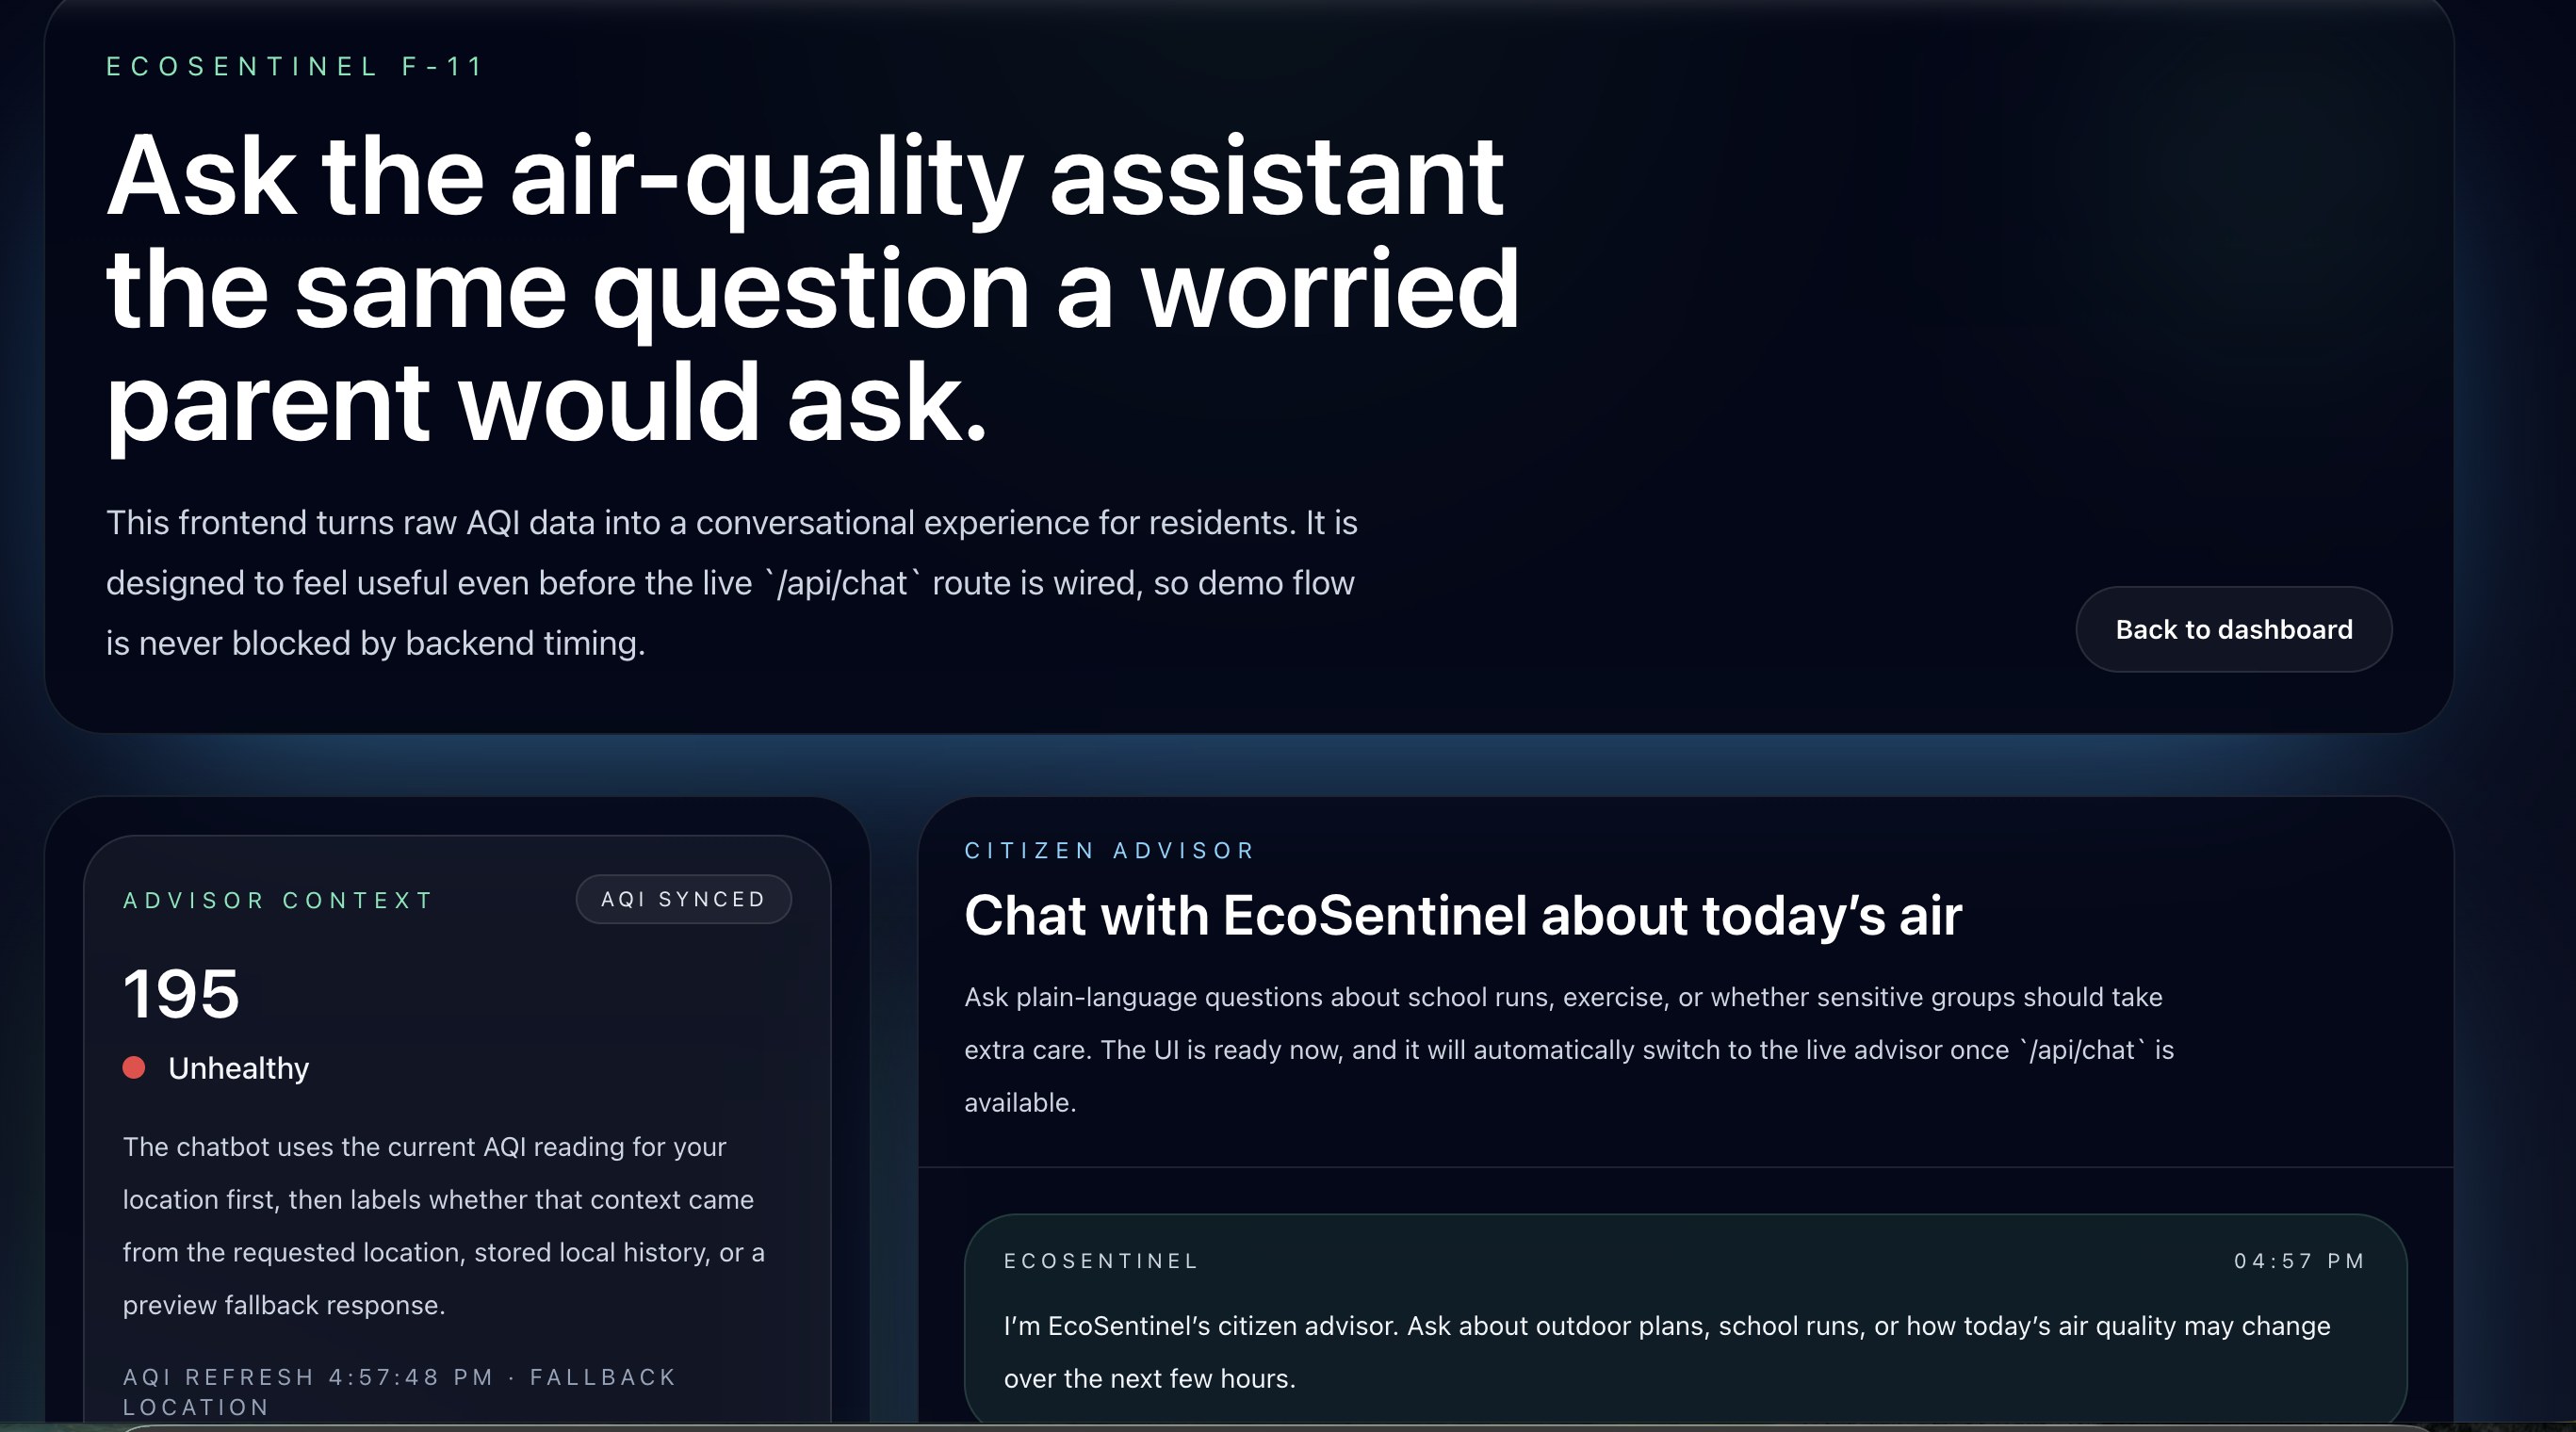
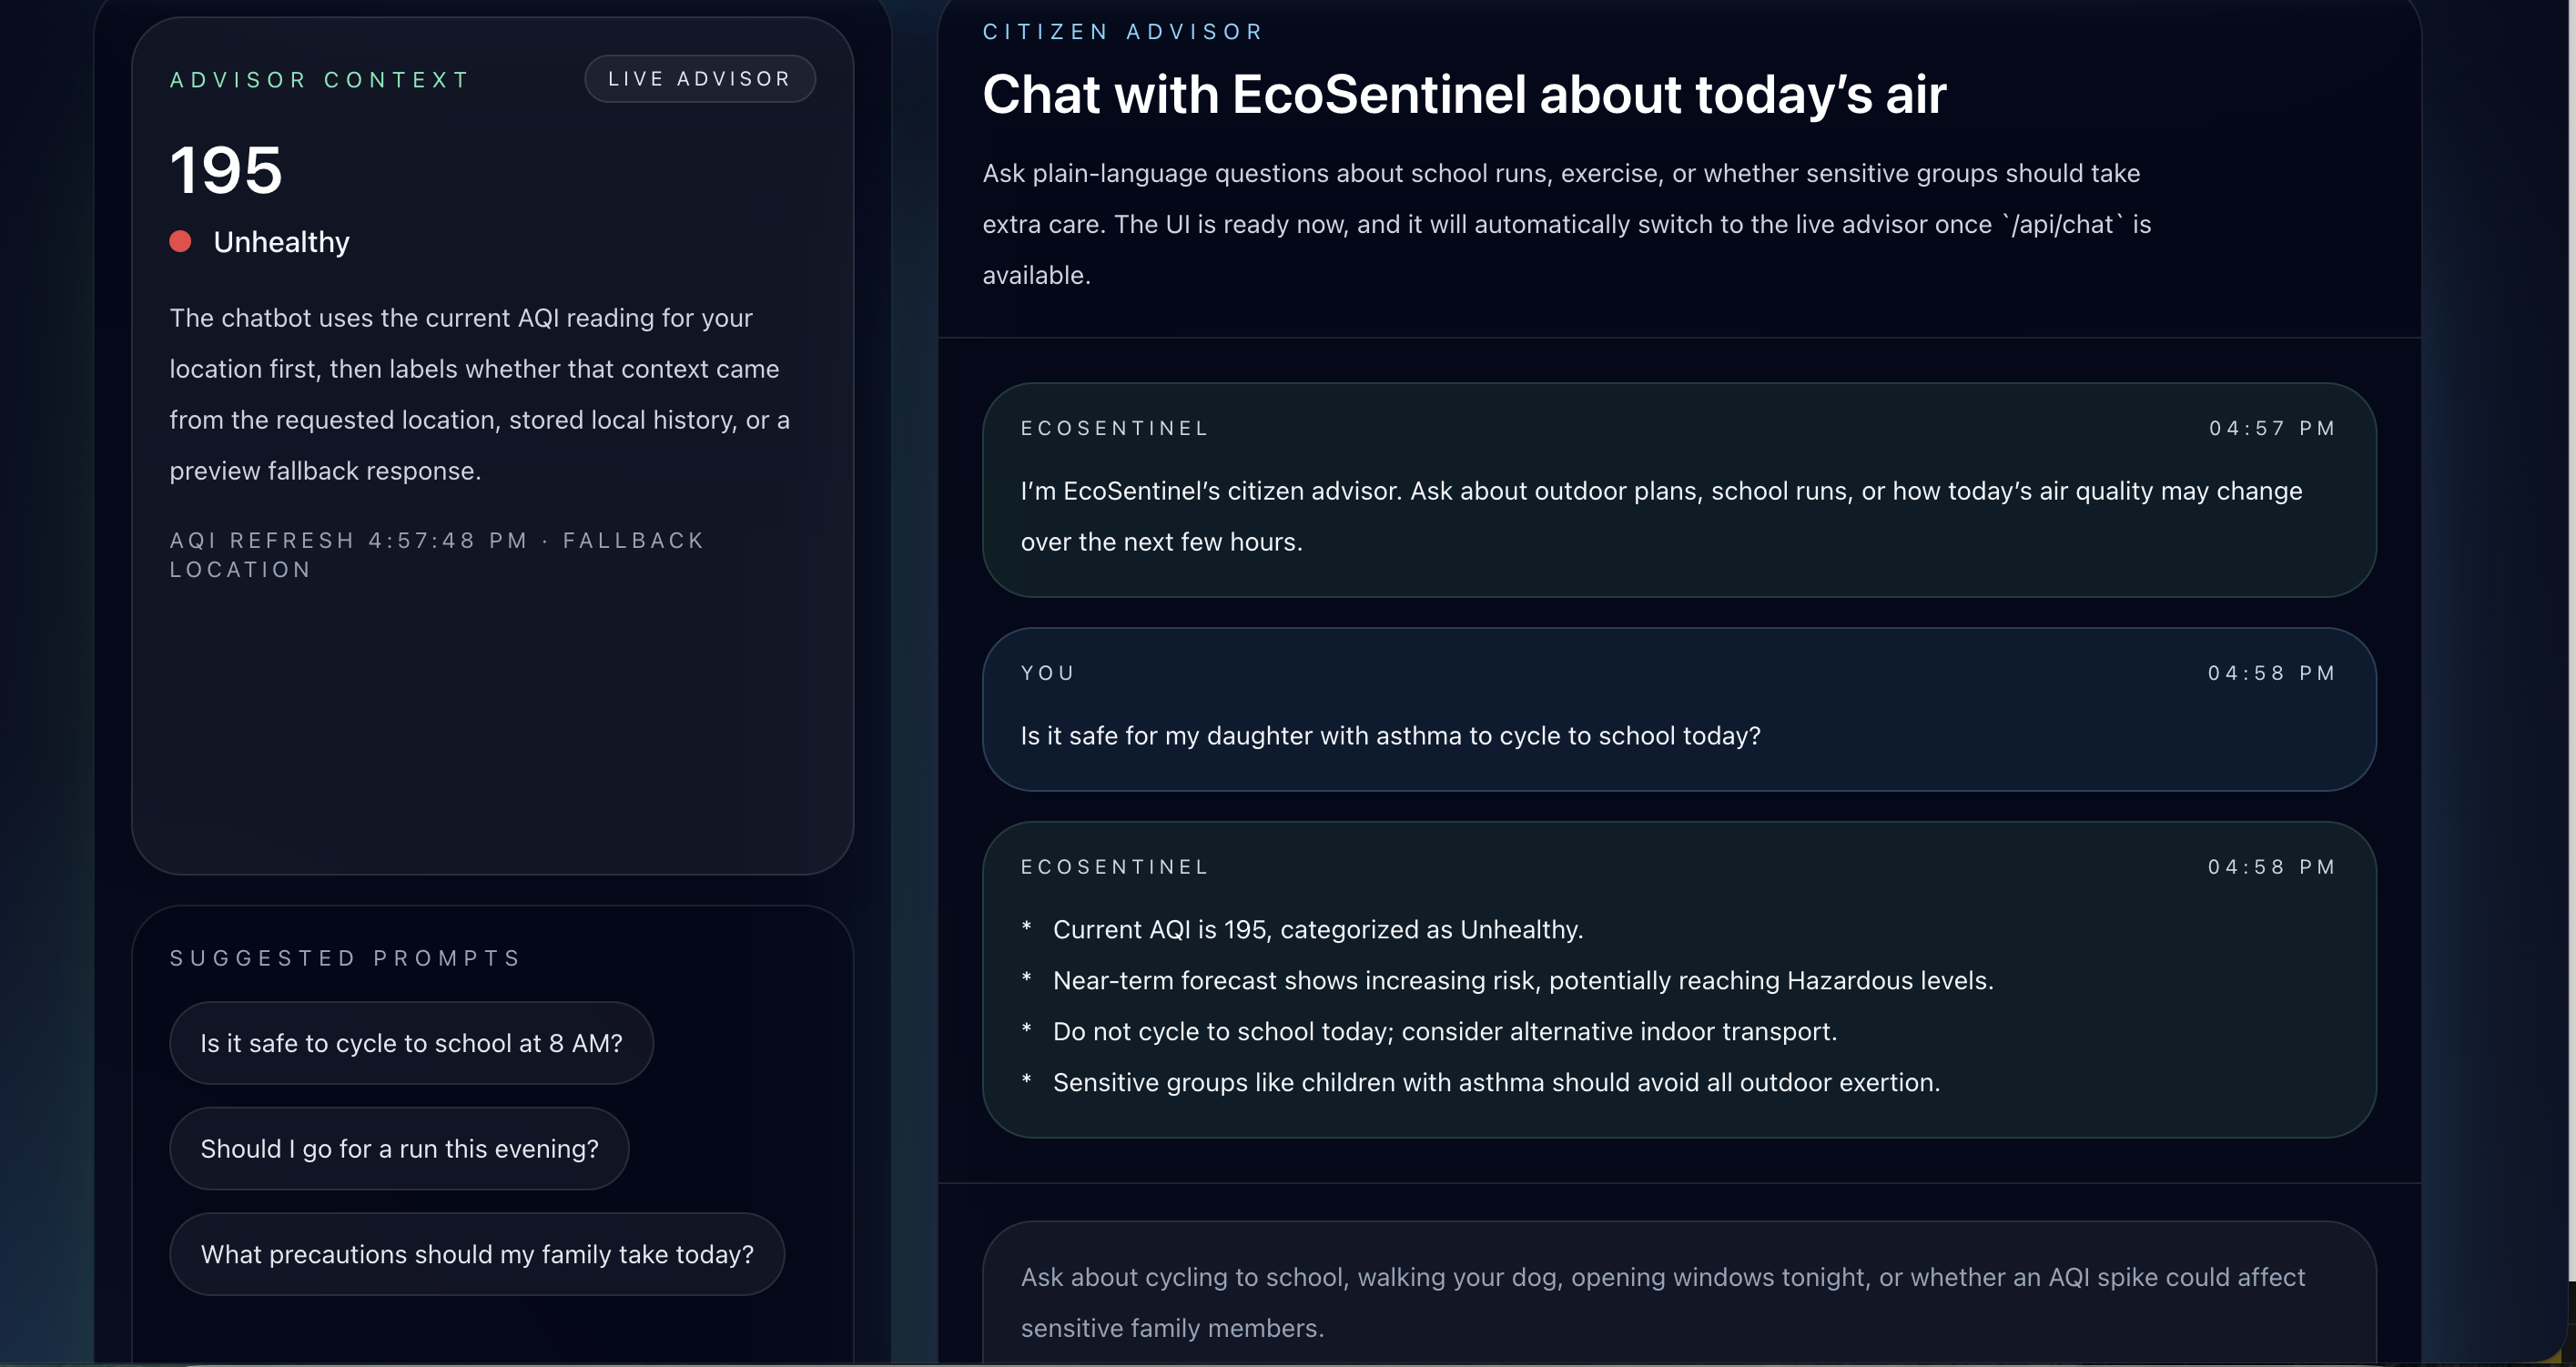
Chat advisor
-
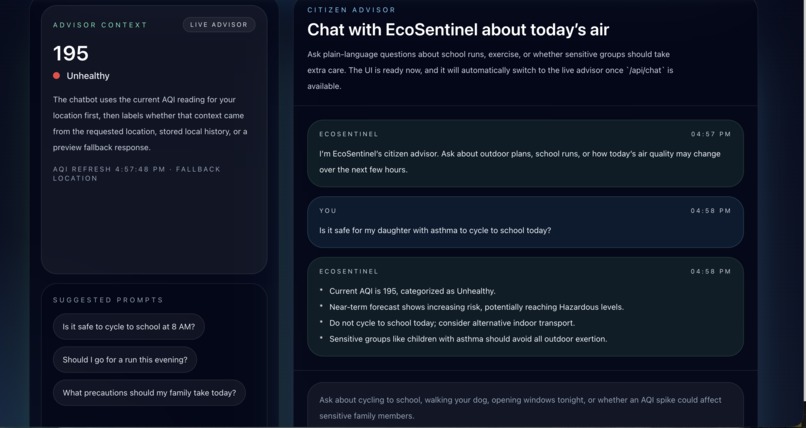
Chat advisor
-
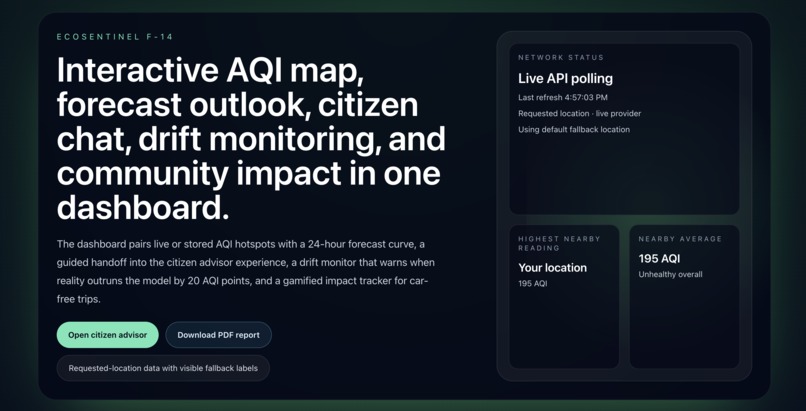
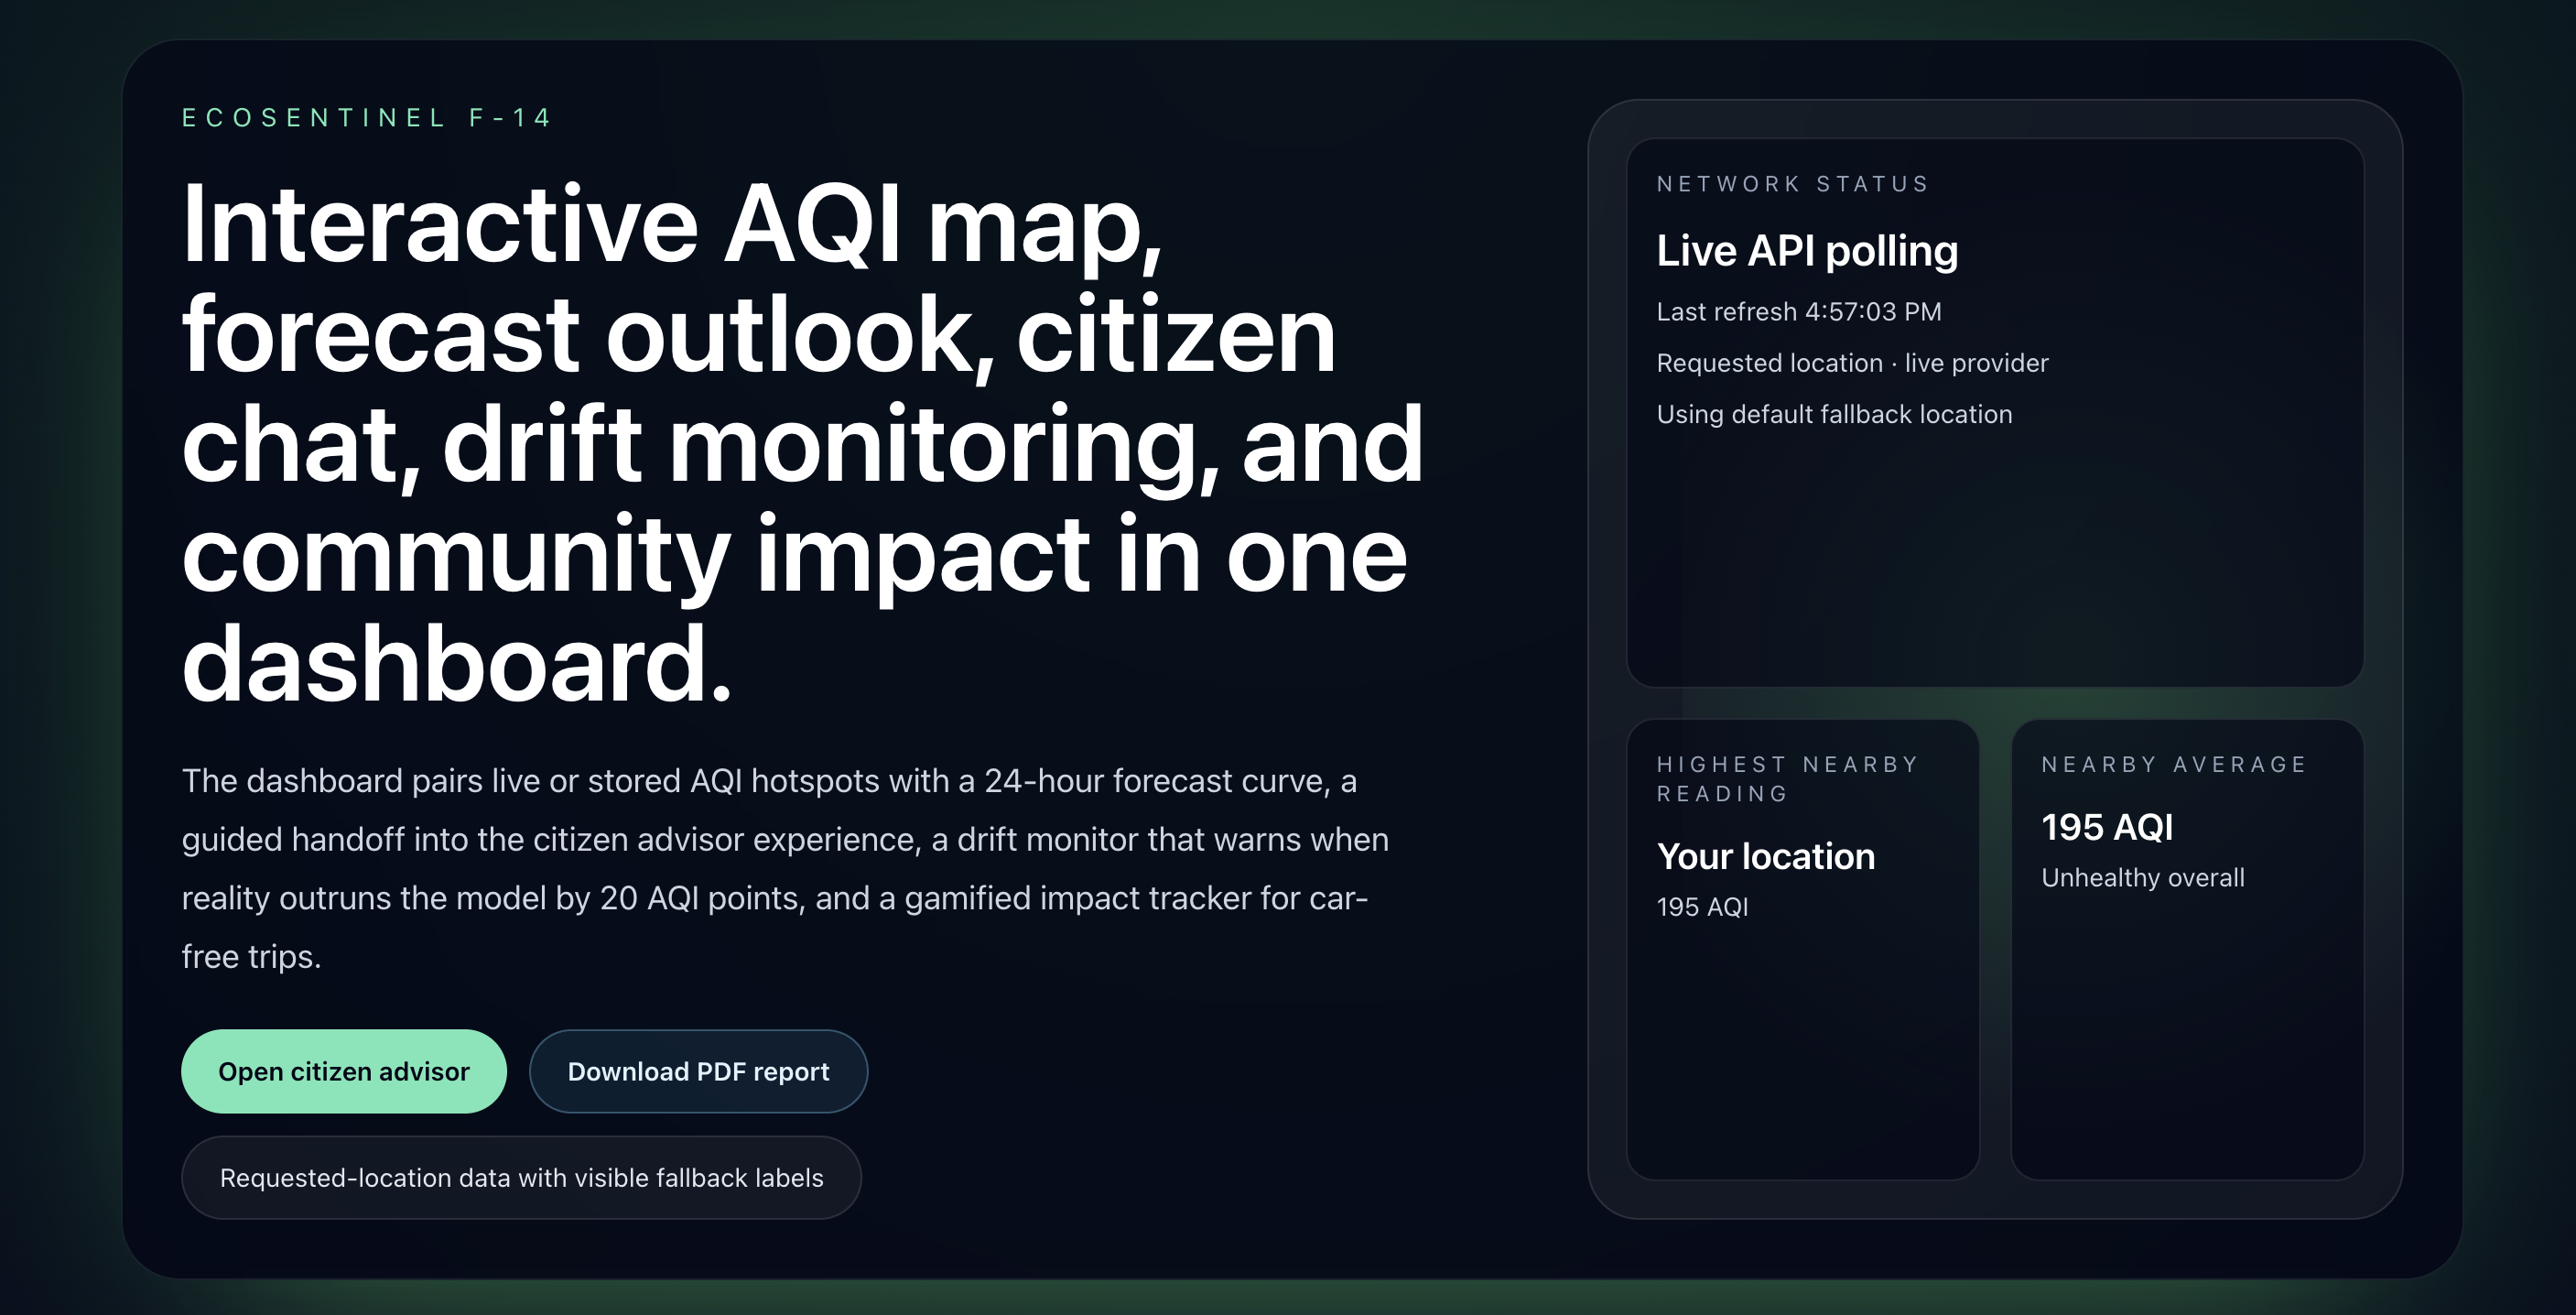
dashboard
-
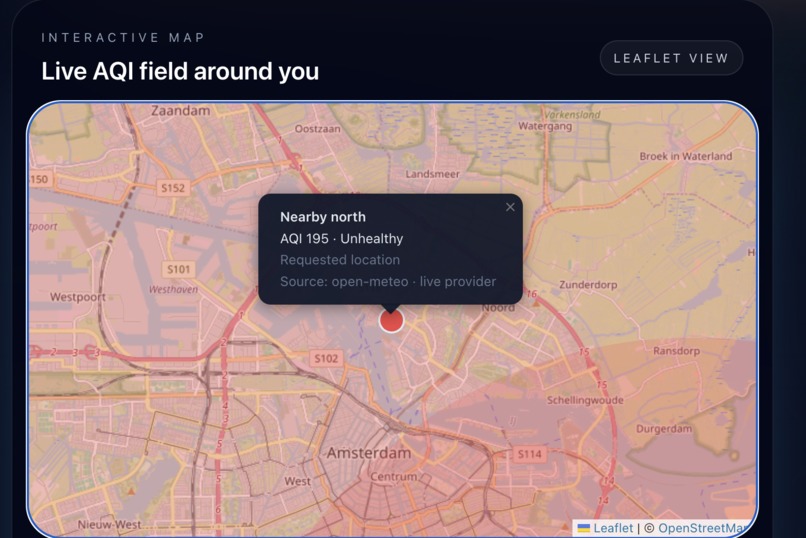
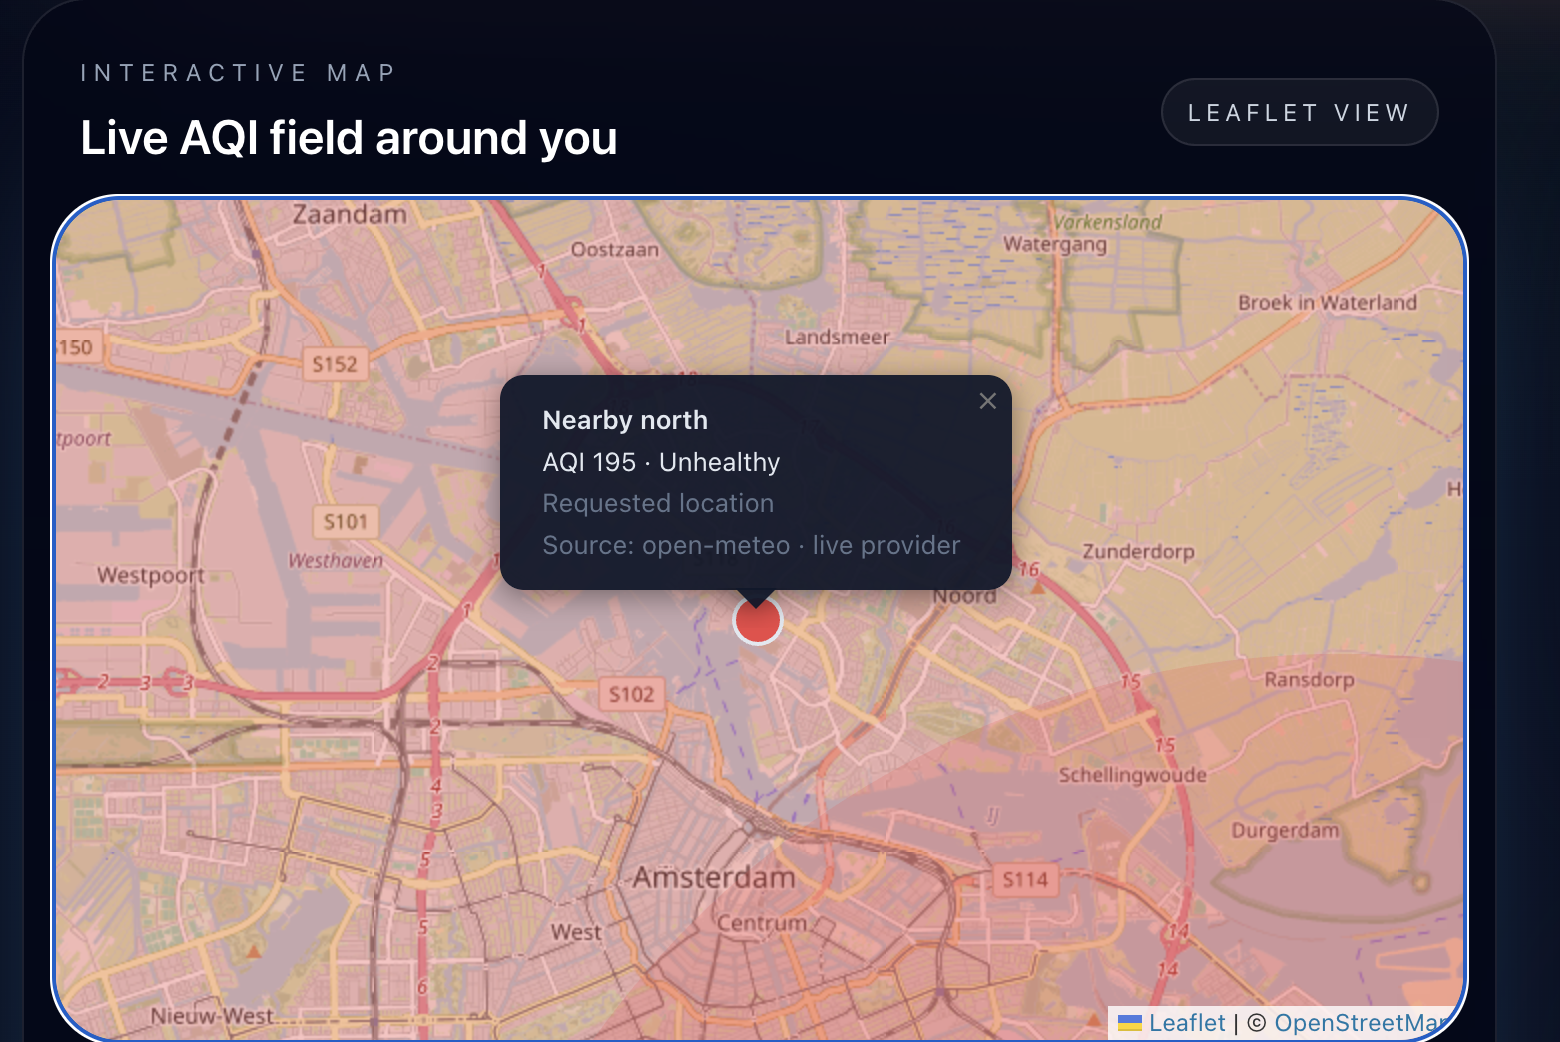
Interactive map
-
Interactive map + aqi
-
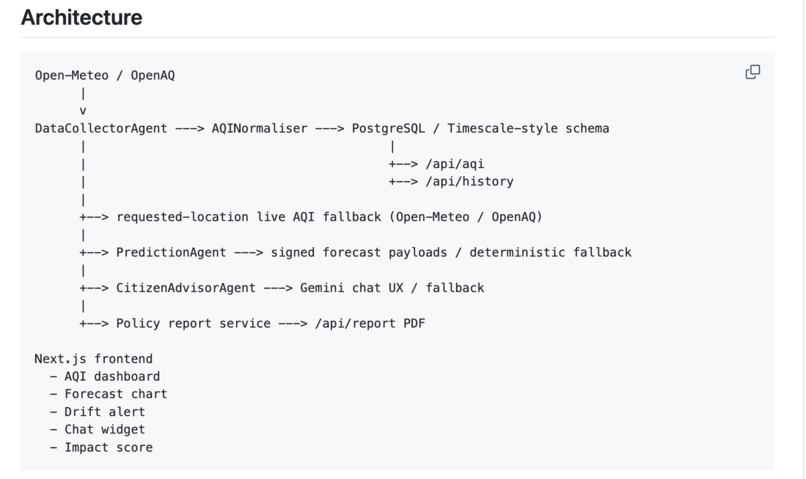
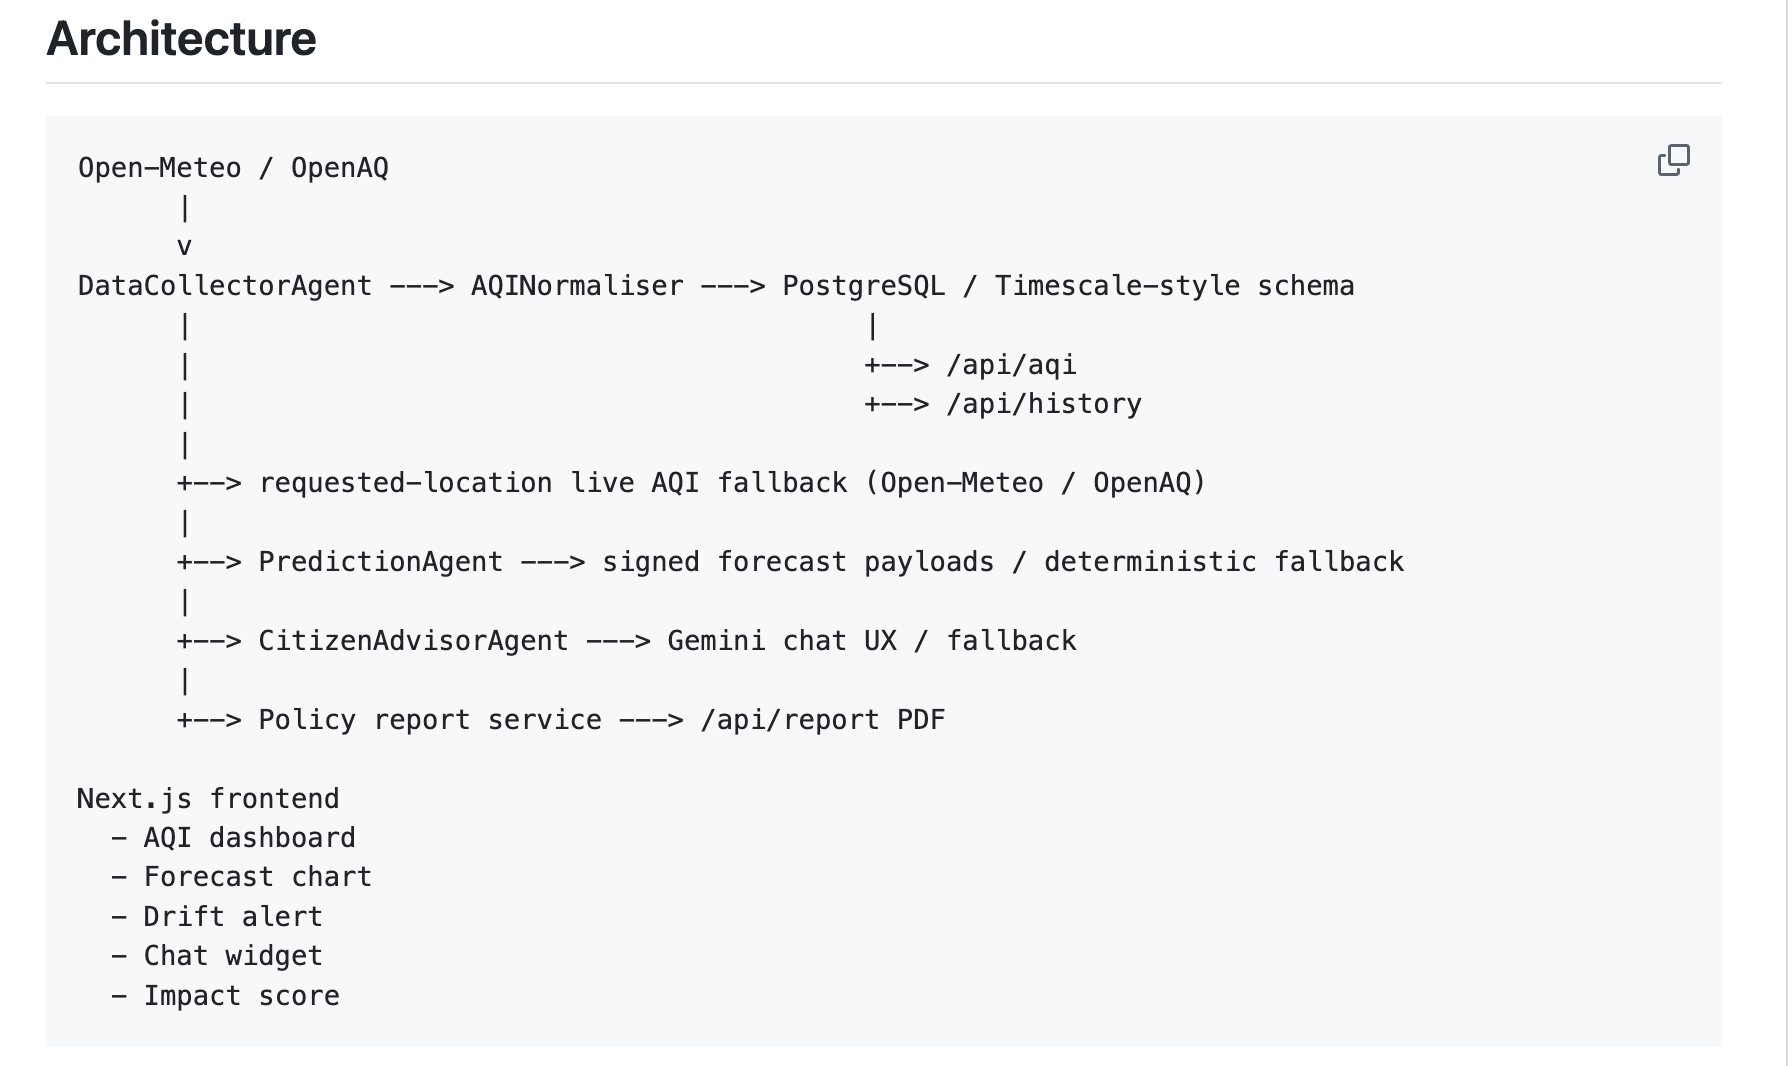
architecture
-
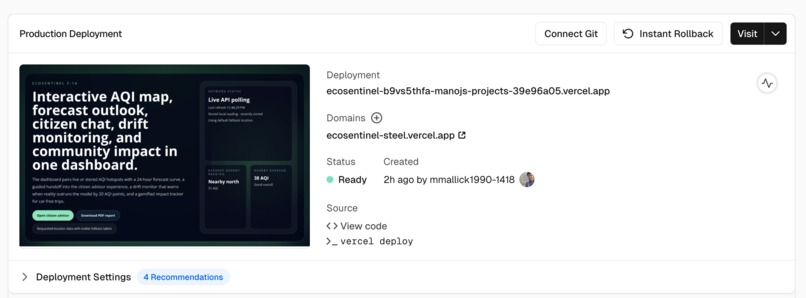
vercel frontend
-
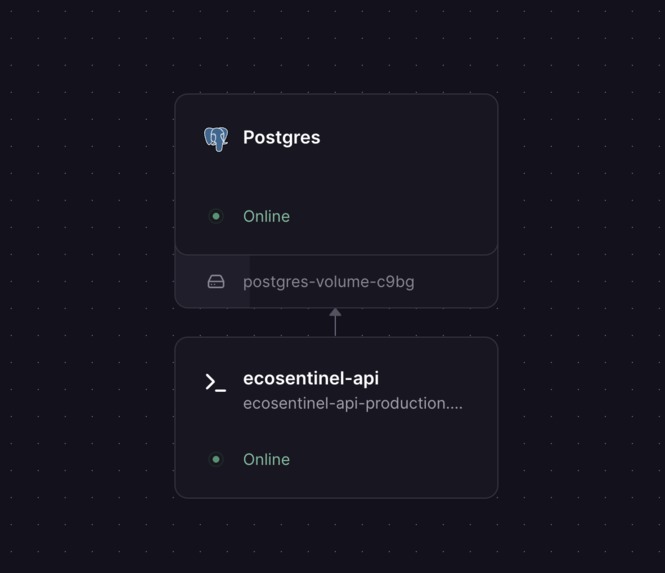
railway backend
-
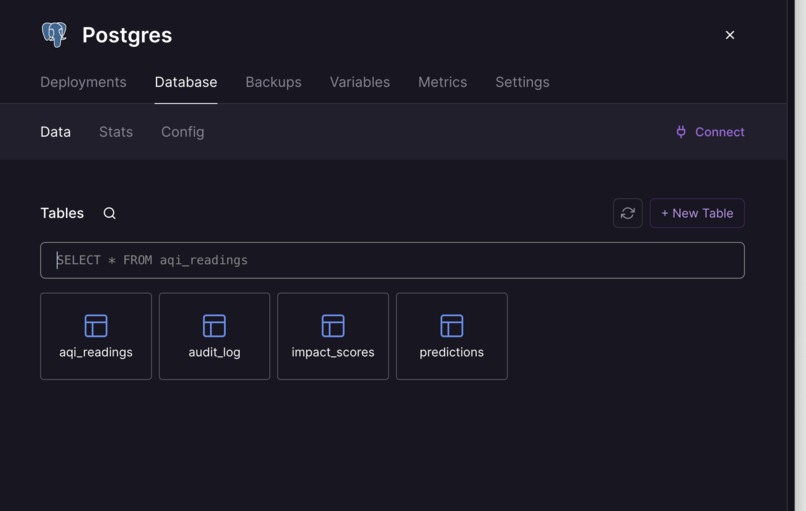
table

Inspiration
Air quality data exists, but it is often fragmented, delayed, and difficult for normal people to act on. I wanted to build something that turns raw pollution data into practical guidance for residents, schools, and city stakeholders. EcoSentinel was inspired by a simple question: “Is it actually safe to go outside right now where I am?”
What it does
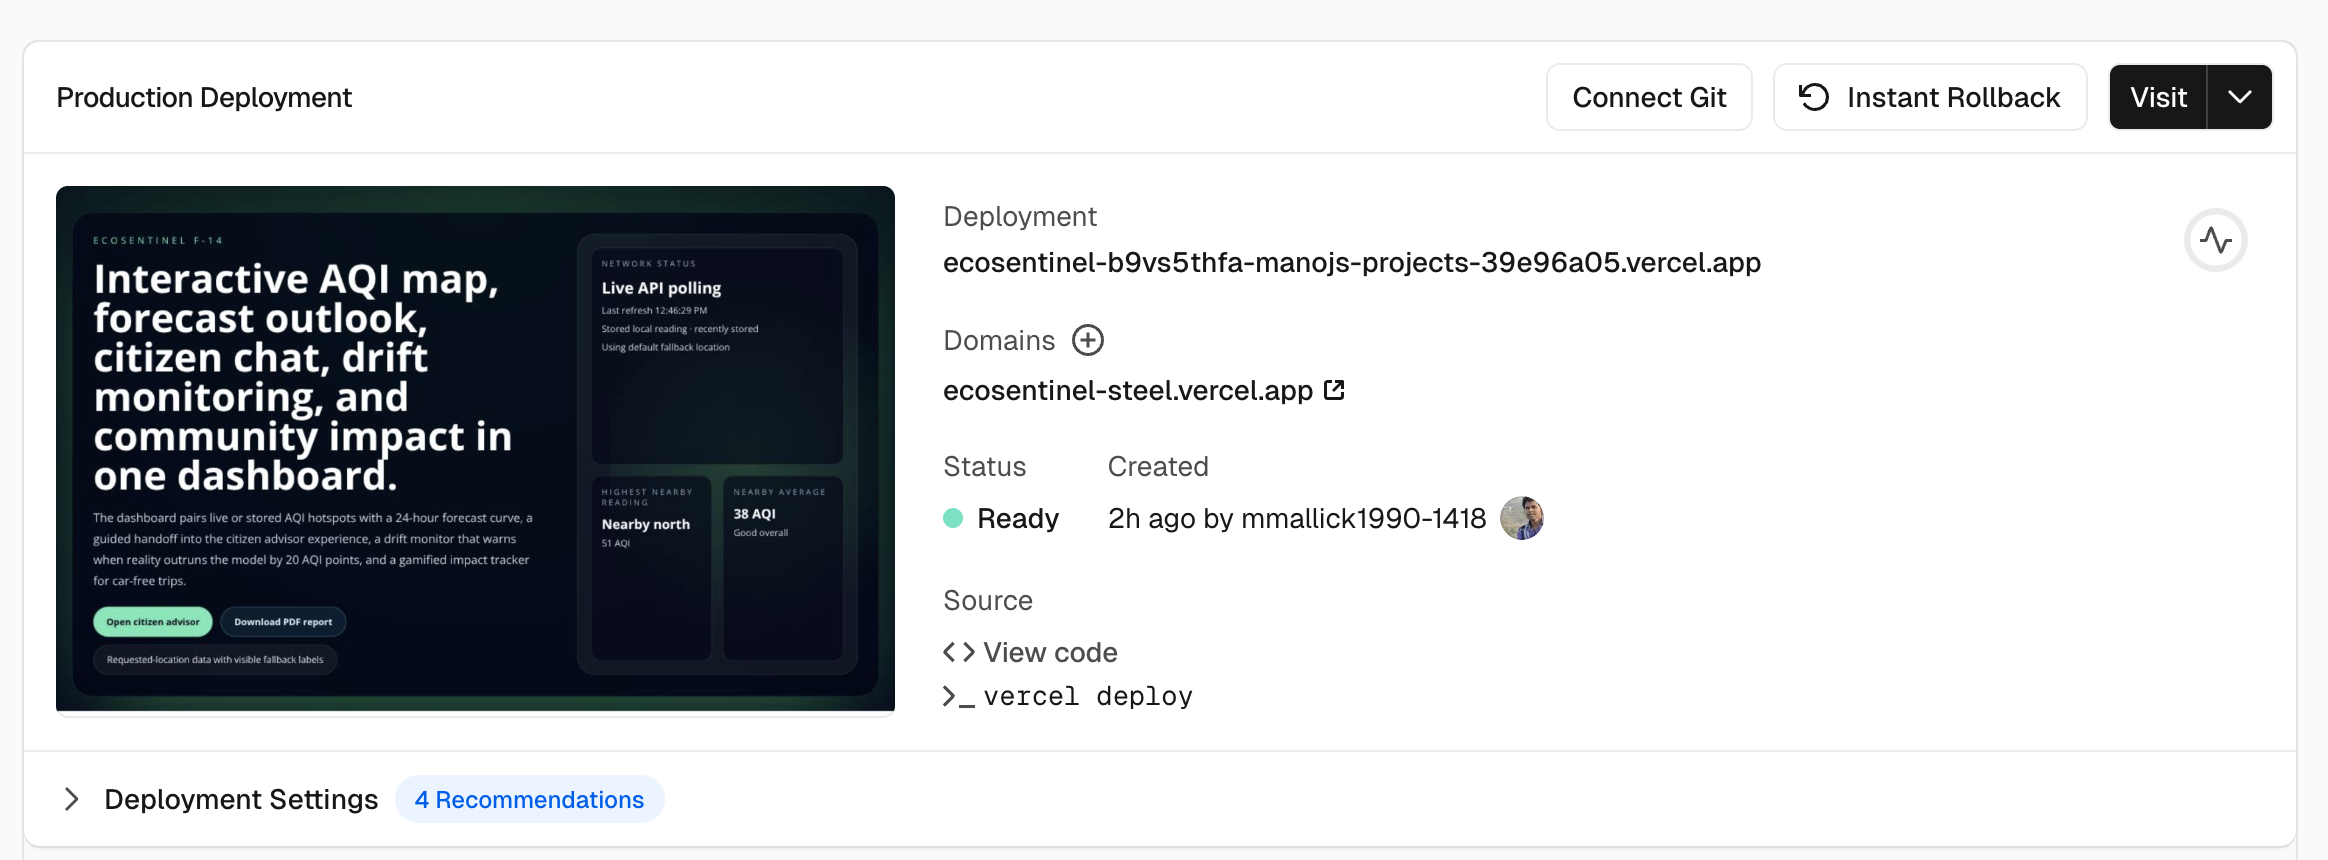
EcoSentinel is a hyper-local air quality intelligence platform. It detects the user’s location, shows the current AQI, visualizes nearby conditions on a map, generates a 24-hour forecast, answers plain-language health and activity questions through an AI advisor, and creates a downloadable PDF report for policy or NGO use.
How we built it
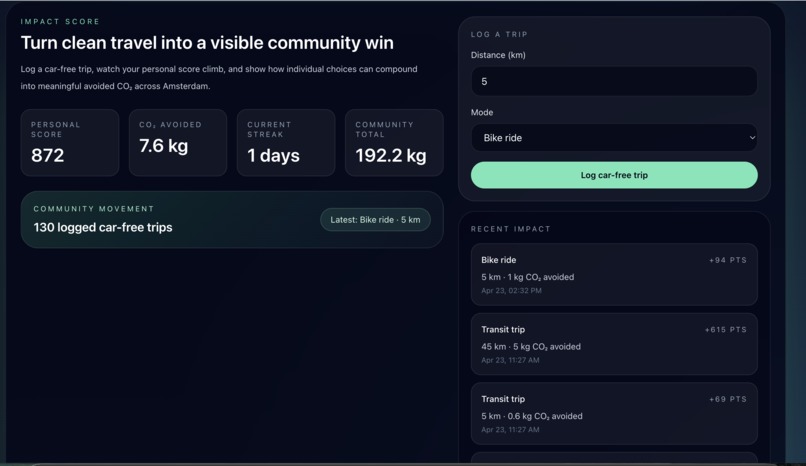
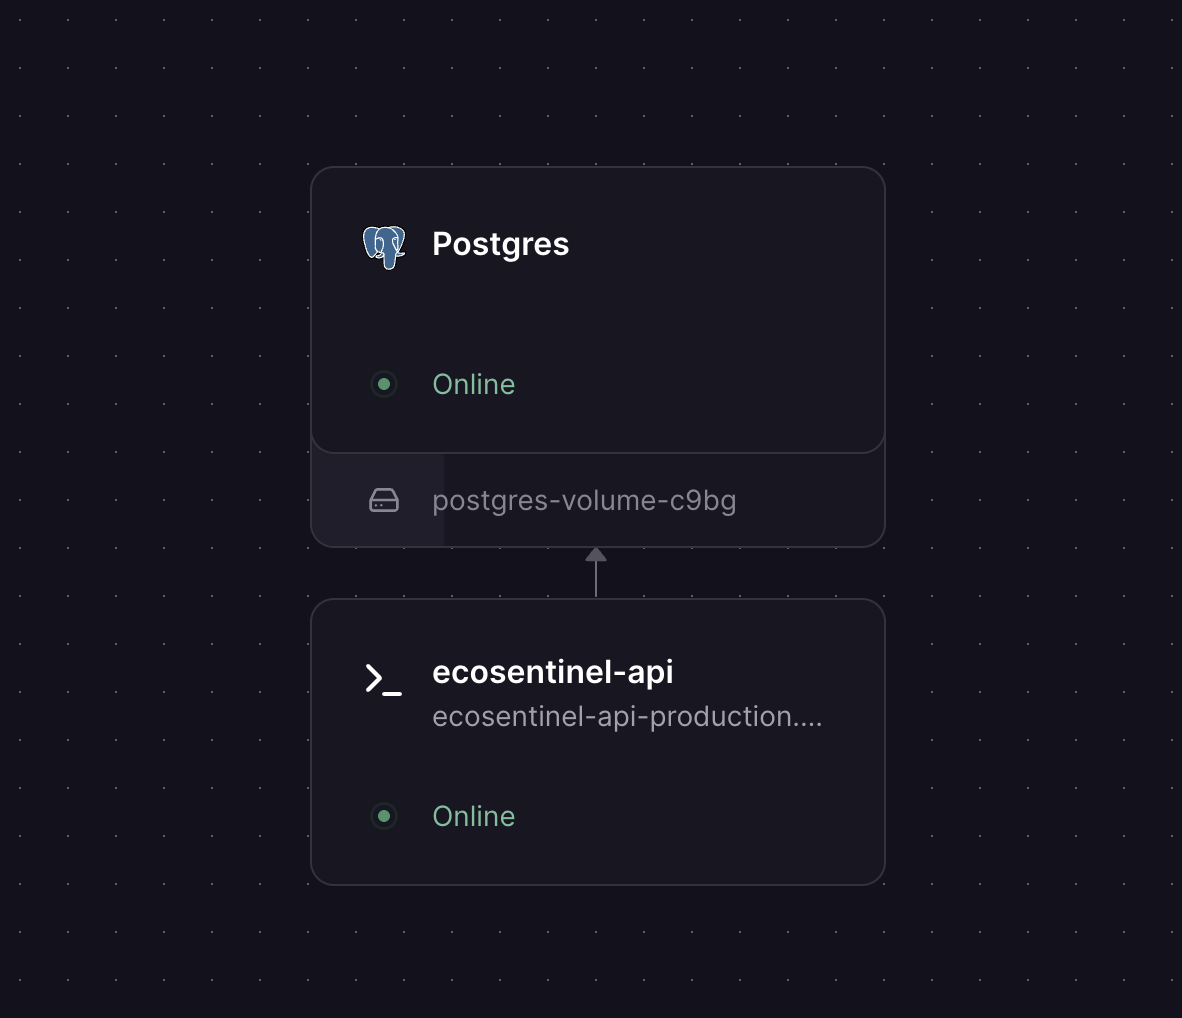
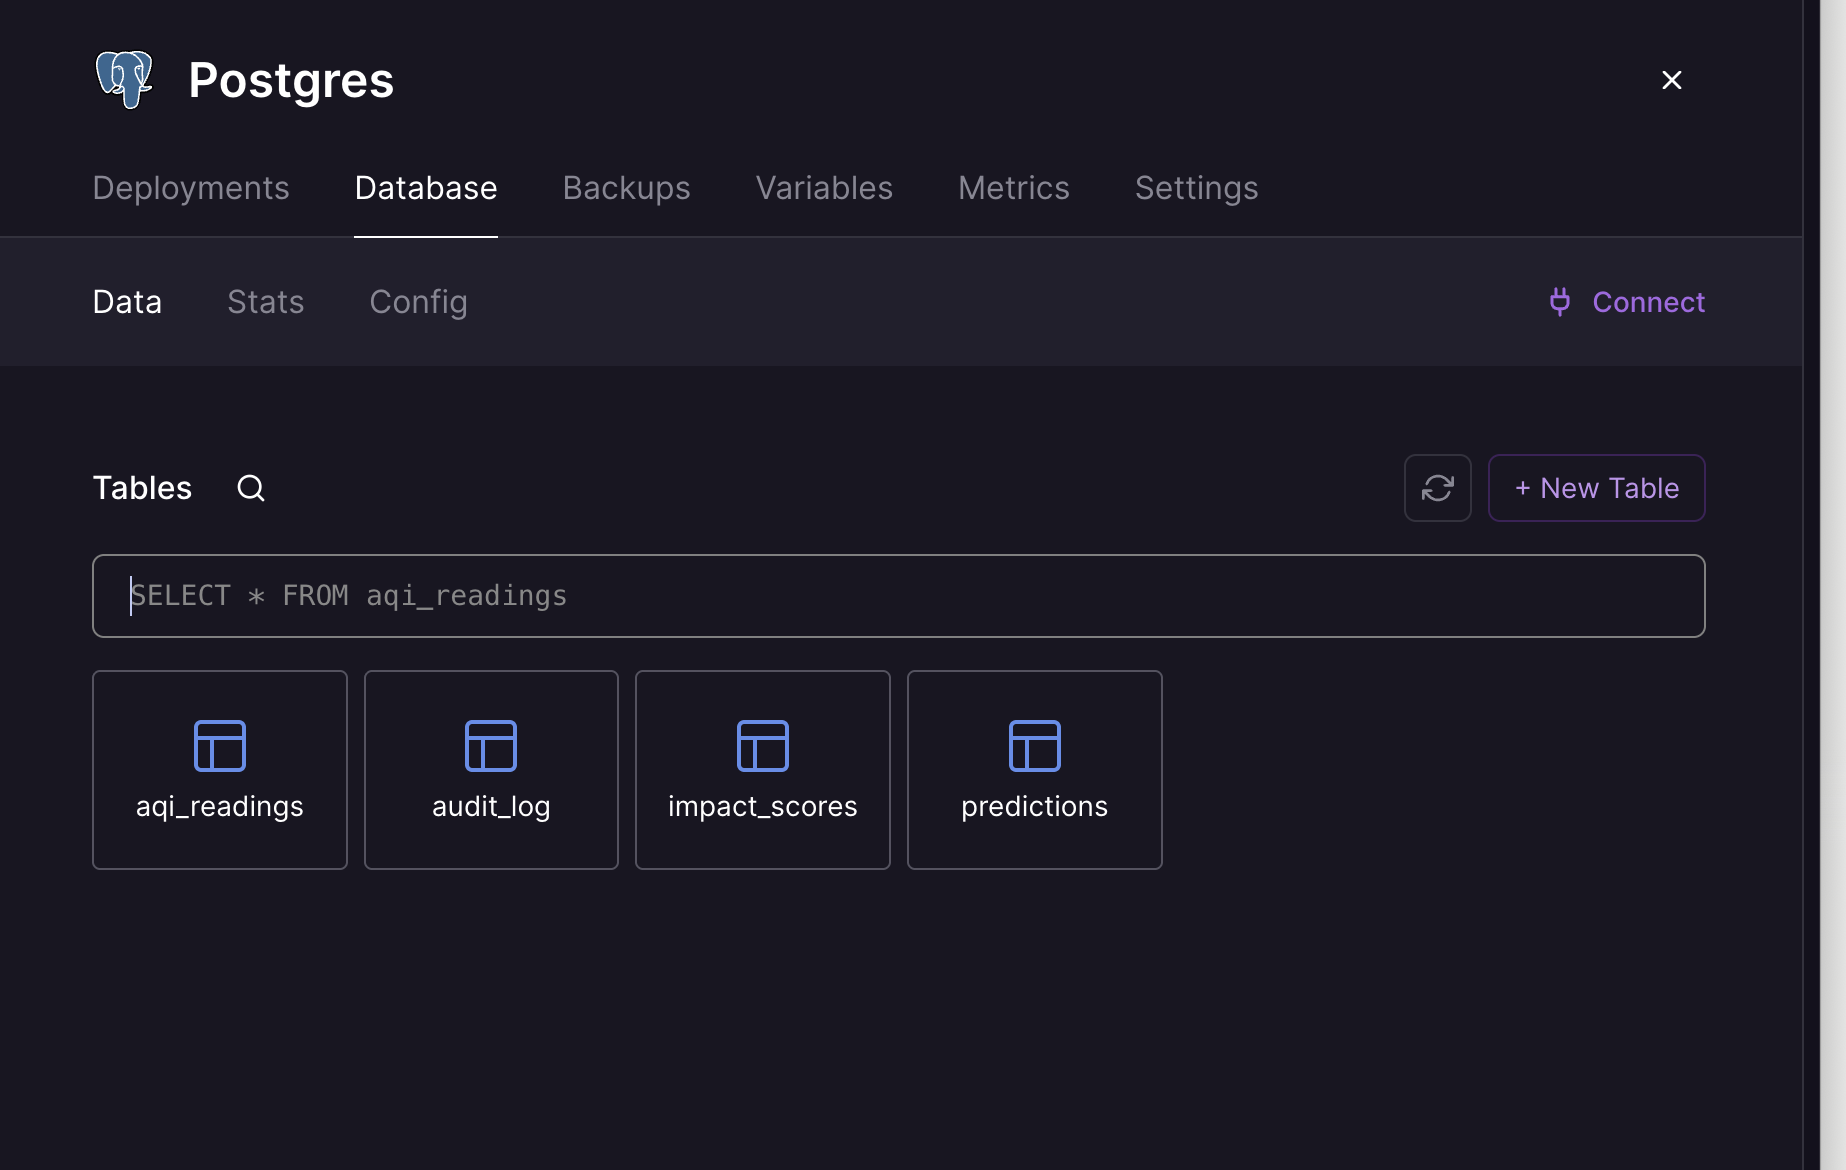
I built EcoSentinel as a monorepo with a Next.js frontend and an Express API. The frontend provides the dashboard, map, forecast chart, chatbot UI, drift alert banner, and impact score tracker. The backend handles AQI ingestion, normalization, forecasting, report generation, and the AI advisor.
For live environmental data, EcoSentinel now uses Open-Meteo as the default AQI and pollutant source, with OpenAQ as a secondary validation source. AQI values are normalized using EPA breakpoint logic. Forecasts are generated through a prediction service with a safe fallback path, and the citizen advisor uses Gemini to turn AQI context into practical recommendations. The app is deployed with Vercel for the web frontend and Railway for the API.
Challenges we ran into
The biggest challenge was making the live demo trustworthy. External APIs can fail, rate-limit, or return incomplete data, so I had to design the system to be honest about data provenance and resilience. I added visible labels for resolution and freshness so users can see whether a reading came from the requested location, local stored history, or a fallback path.
Deployment was another challenge. I had to solve cold starts, health checks, CORS issues, route mismatches, and provider limits while keeping the experience smooth enough for judges to try live.
Accomplishments that we're proud of
I’m proud that EcoSentinel is not just a mock UI — it is a deployed, working product with a live dashboard, interactive map, forecast visualization, AI advisor, and one-click PDF report generation. I’m also proud of the transparency built into the product: instead of hiding fallback behavior, the app exposes freshness and resolution so users can trust what they are seeing.
Another accomplishment is that the system gracefully degrades. Even when providers are slow or unavailable, the app remains usable and communicates clearly what data path is being used.
What we learned
I learned a lot about designing reliable data products, not just visually appealing demos. Building this project showed me that environmental software needs both technical depth and user trust. I also learned how important it is to design around imperfect APIs, deployment realities, and judge-facing storytelling at the same time.
On the engineering side, I gained more experience with API integration, AQI normalization, forecast pipelines, deployment workflows, and shaping AI responses so they are actually useful in a real-world context.
What's next for EcoSentinel
Next, I want to improve the forecasting model with richer historical inputs and broader geographic coverage. I also want to expand the reporting workflow for schools, NGOs, and local governments, and make the citizen advisor even more personalized based on sensitive groups, activity type, and time of day.
Long term, EcoSentinel could become a city-scale environmental decision layer: useful not only for residents checking today’s air, but also for planners and organizations making healthier urban decisions.
Built With
- express.js
- gemini
- leaflet.js
- next.js
- node.js
- open-meteo
- openaq
- postgresql
- railway
- react
- recharts
- tailwind-css
- typescript
- vercel

Log in or sign up for Devpost to join the conversation.