-
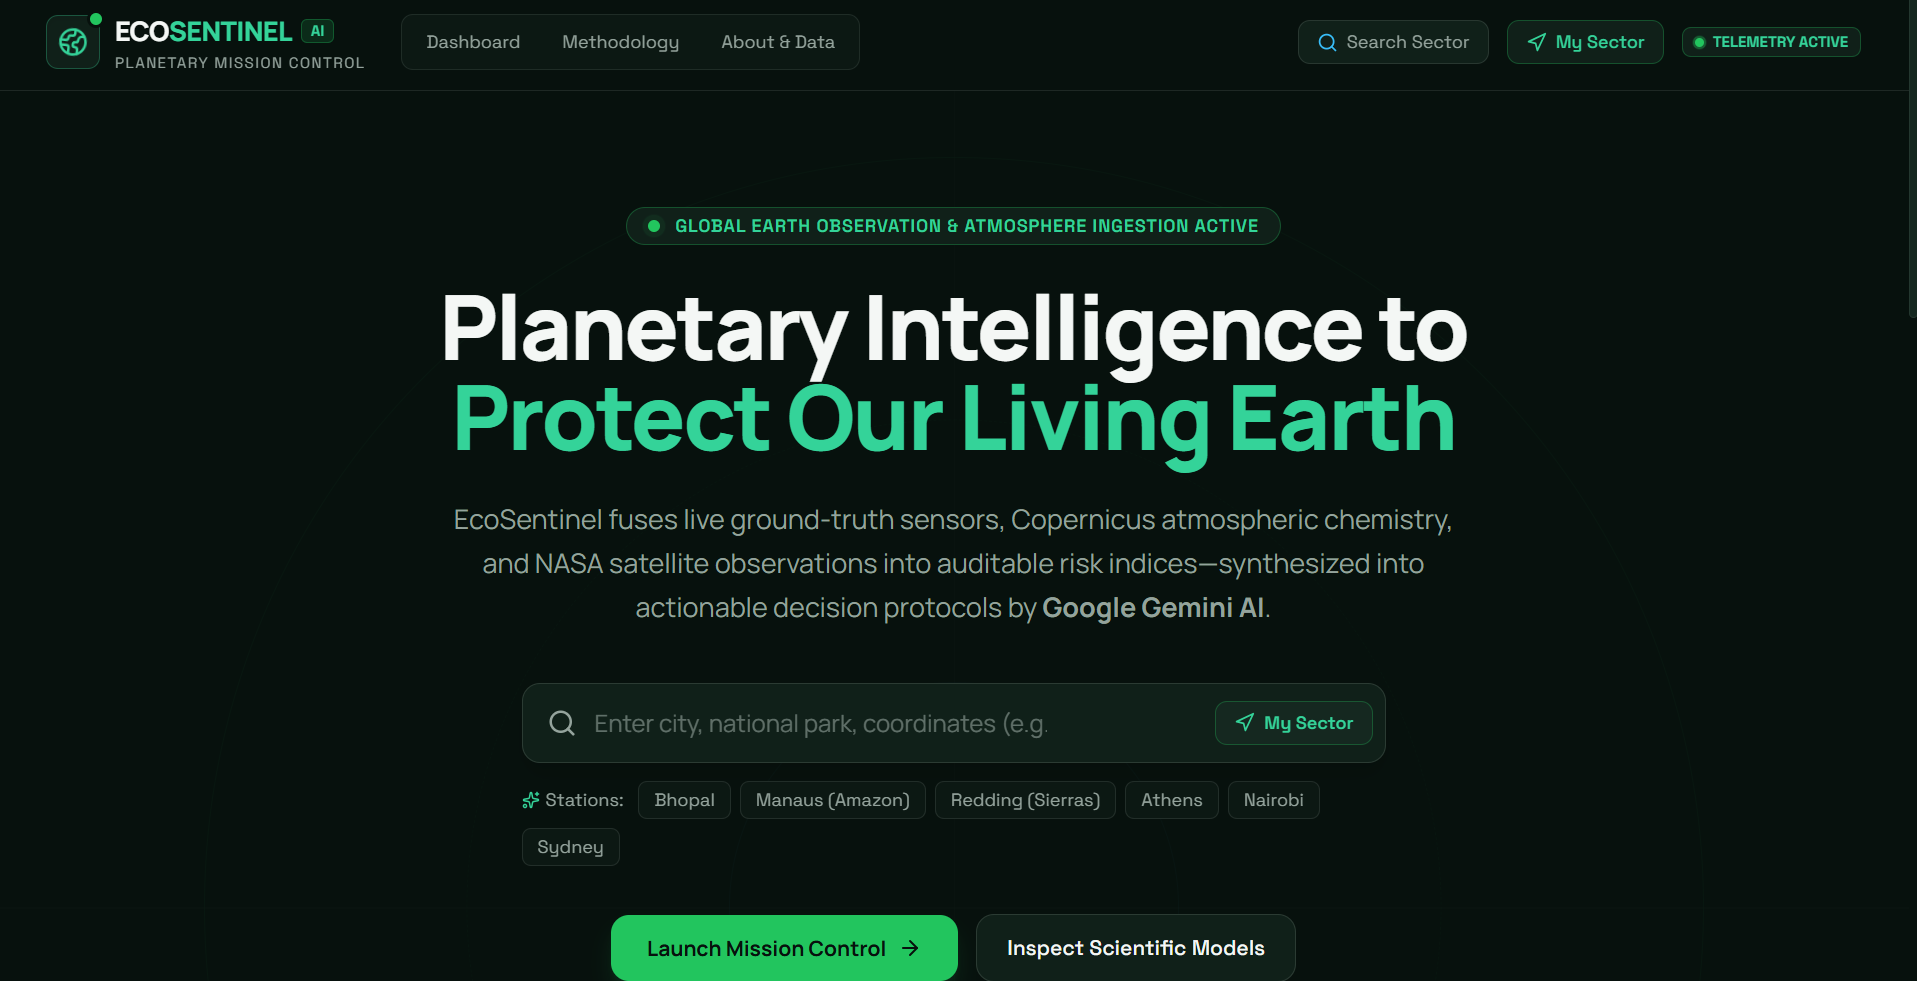
EcoSentinel AI — Planetary Environmental Intelligence dashboard that transforms real environmental data into actionable insights.
-
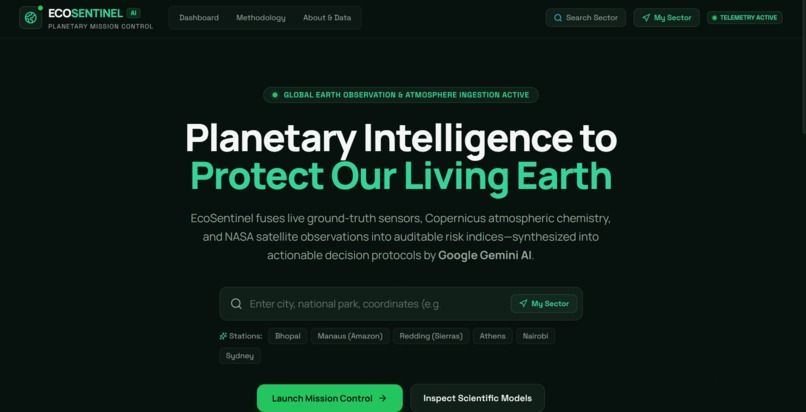
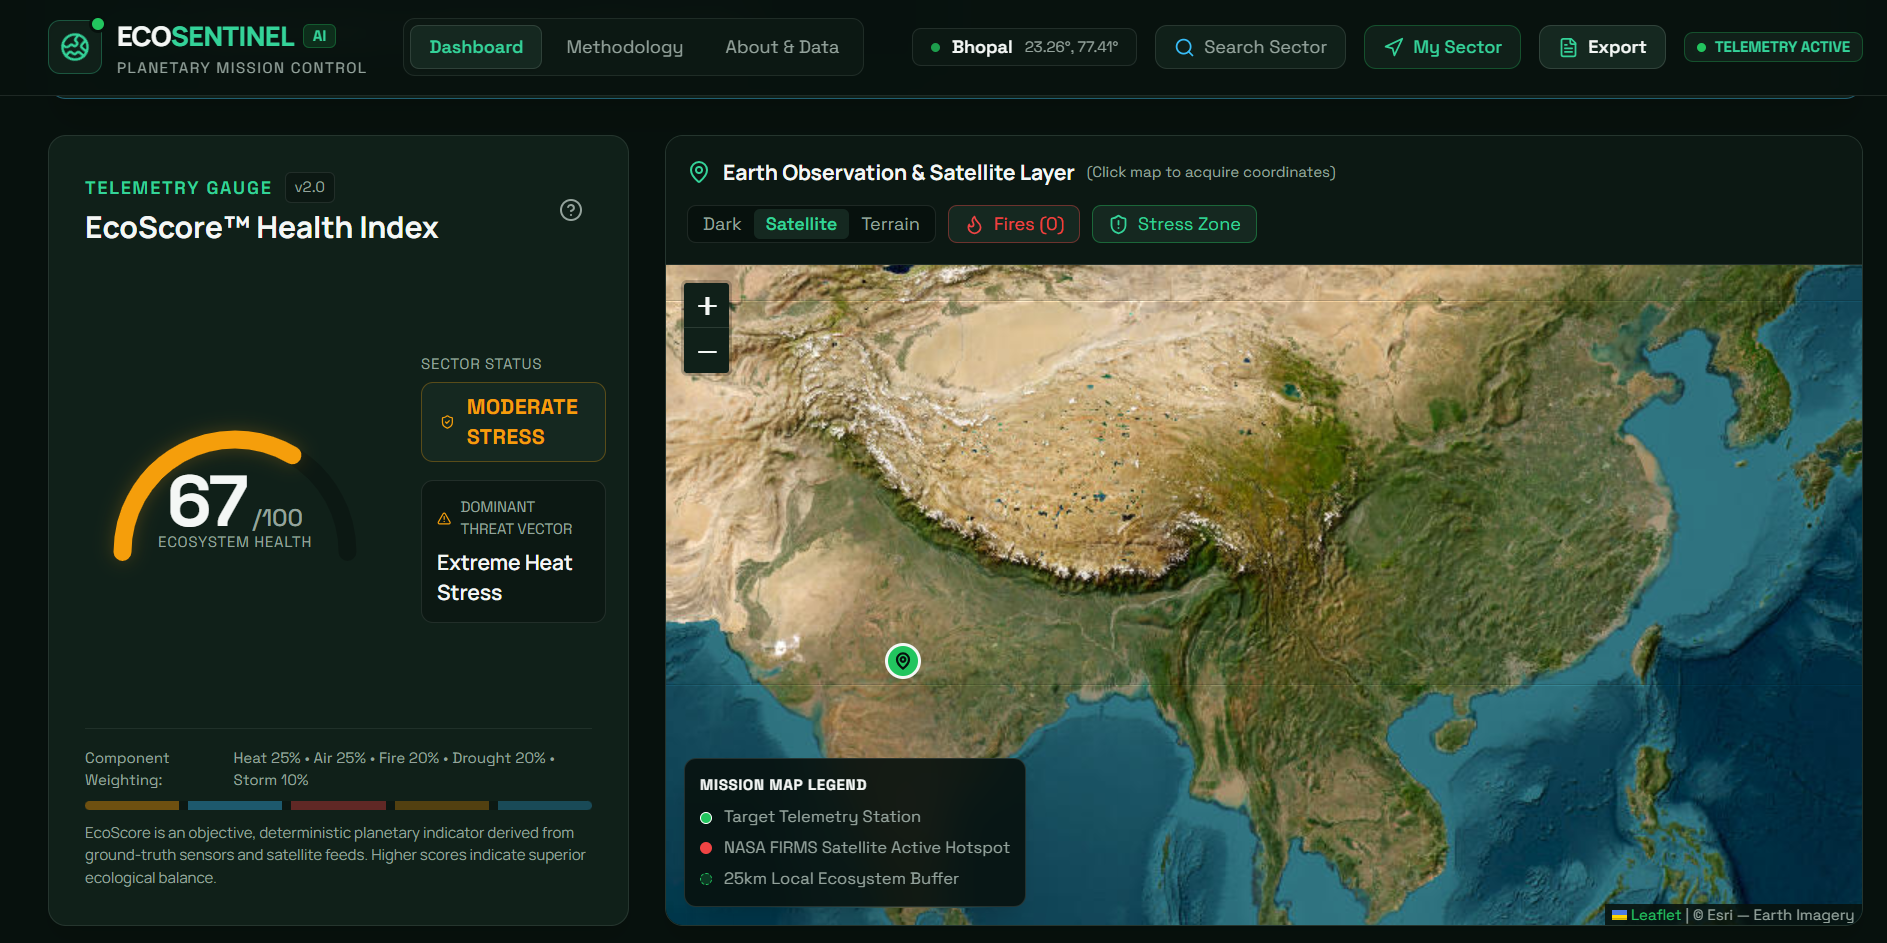
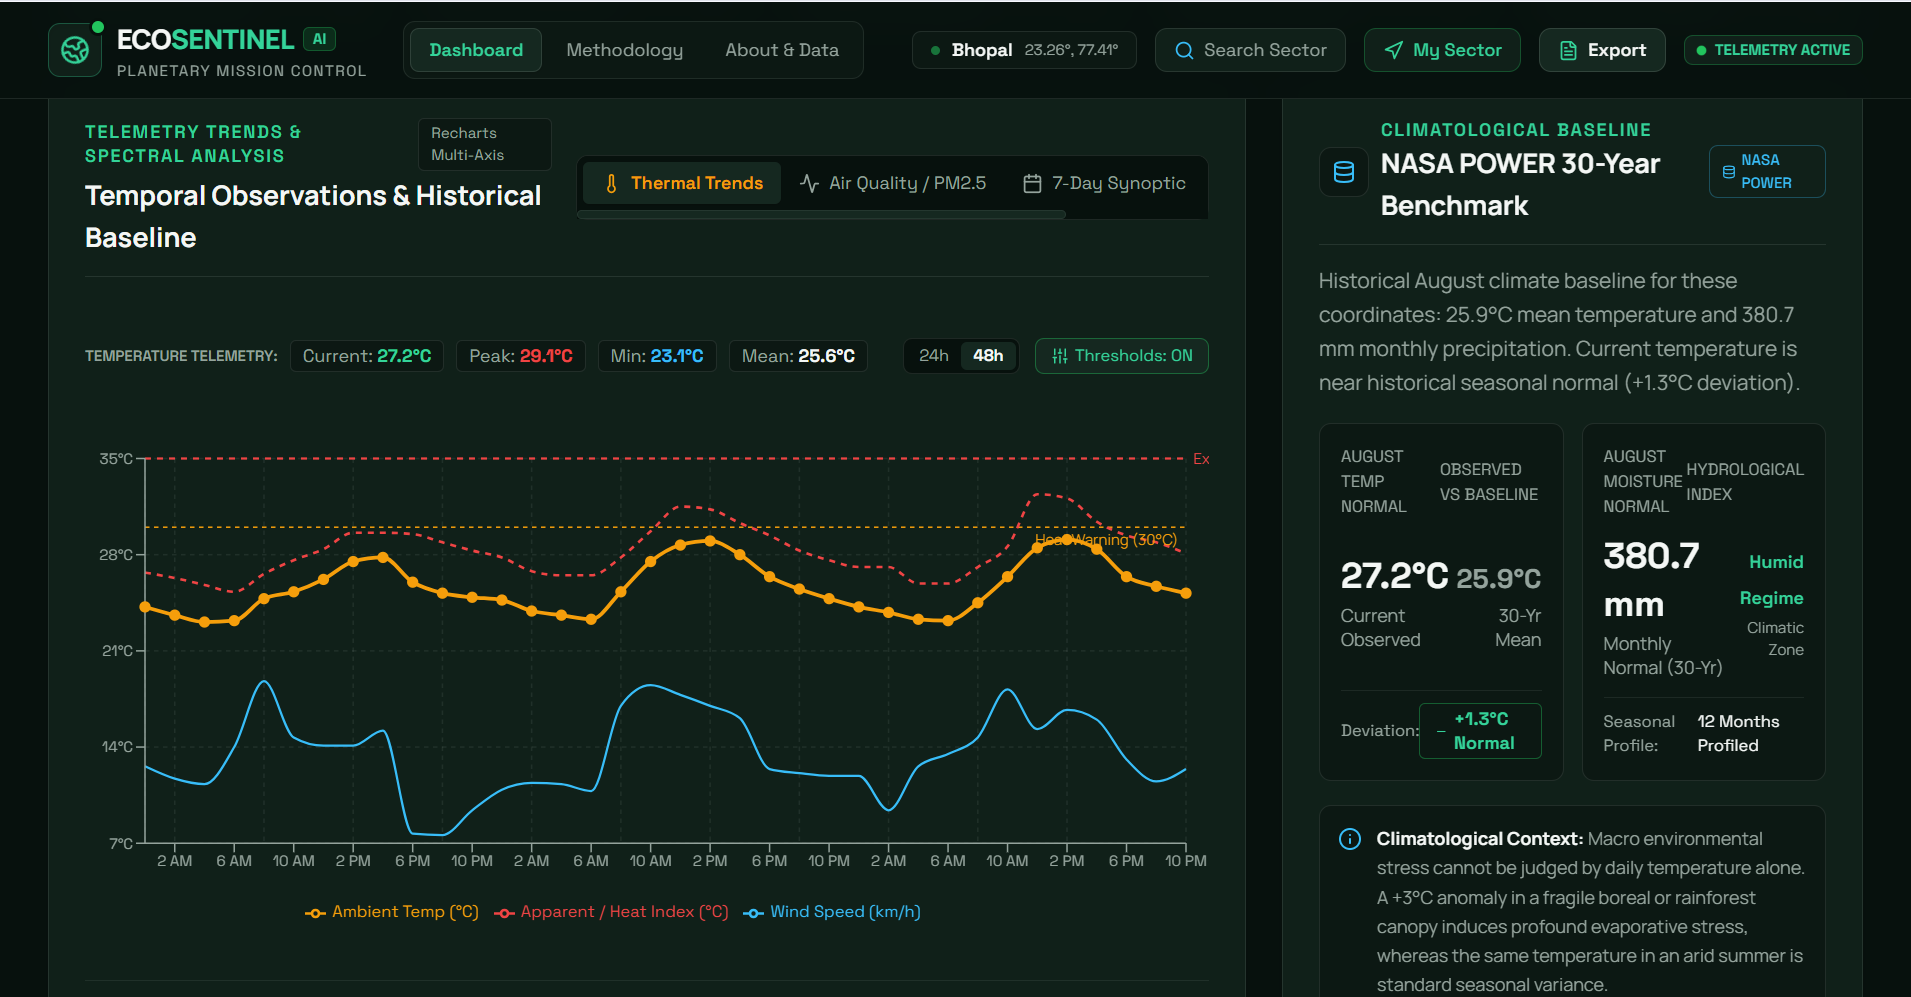
Real-time environmental conditions and EcoScore, combining weather, air quality, climate context, and environmental risk indicators
-
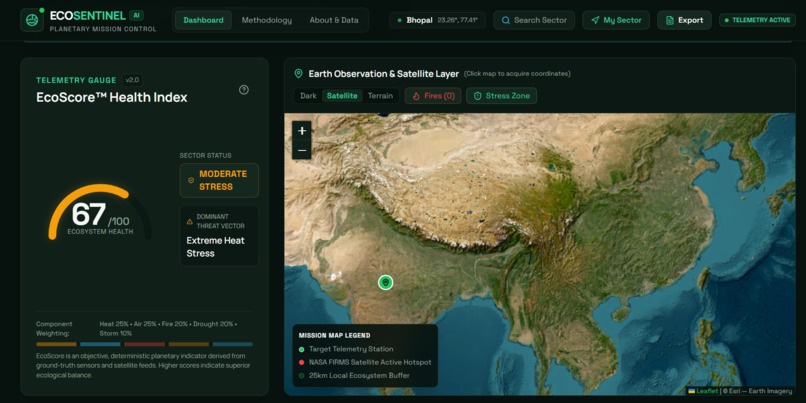
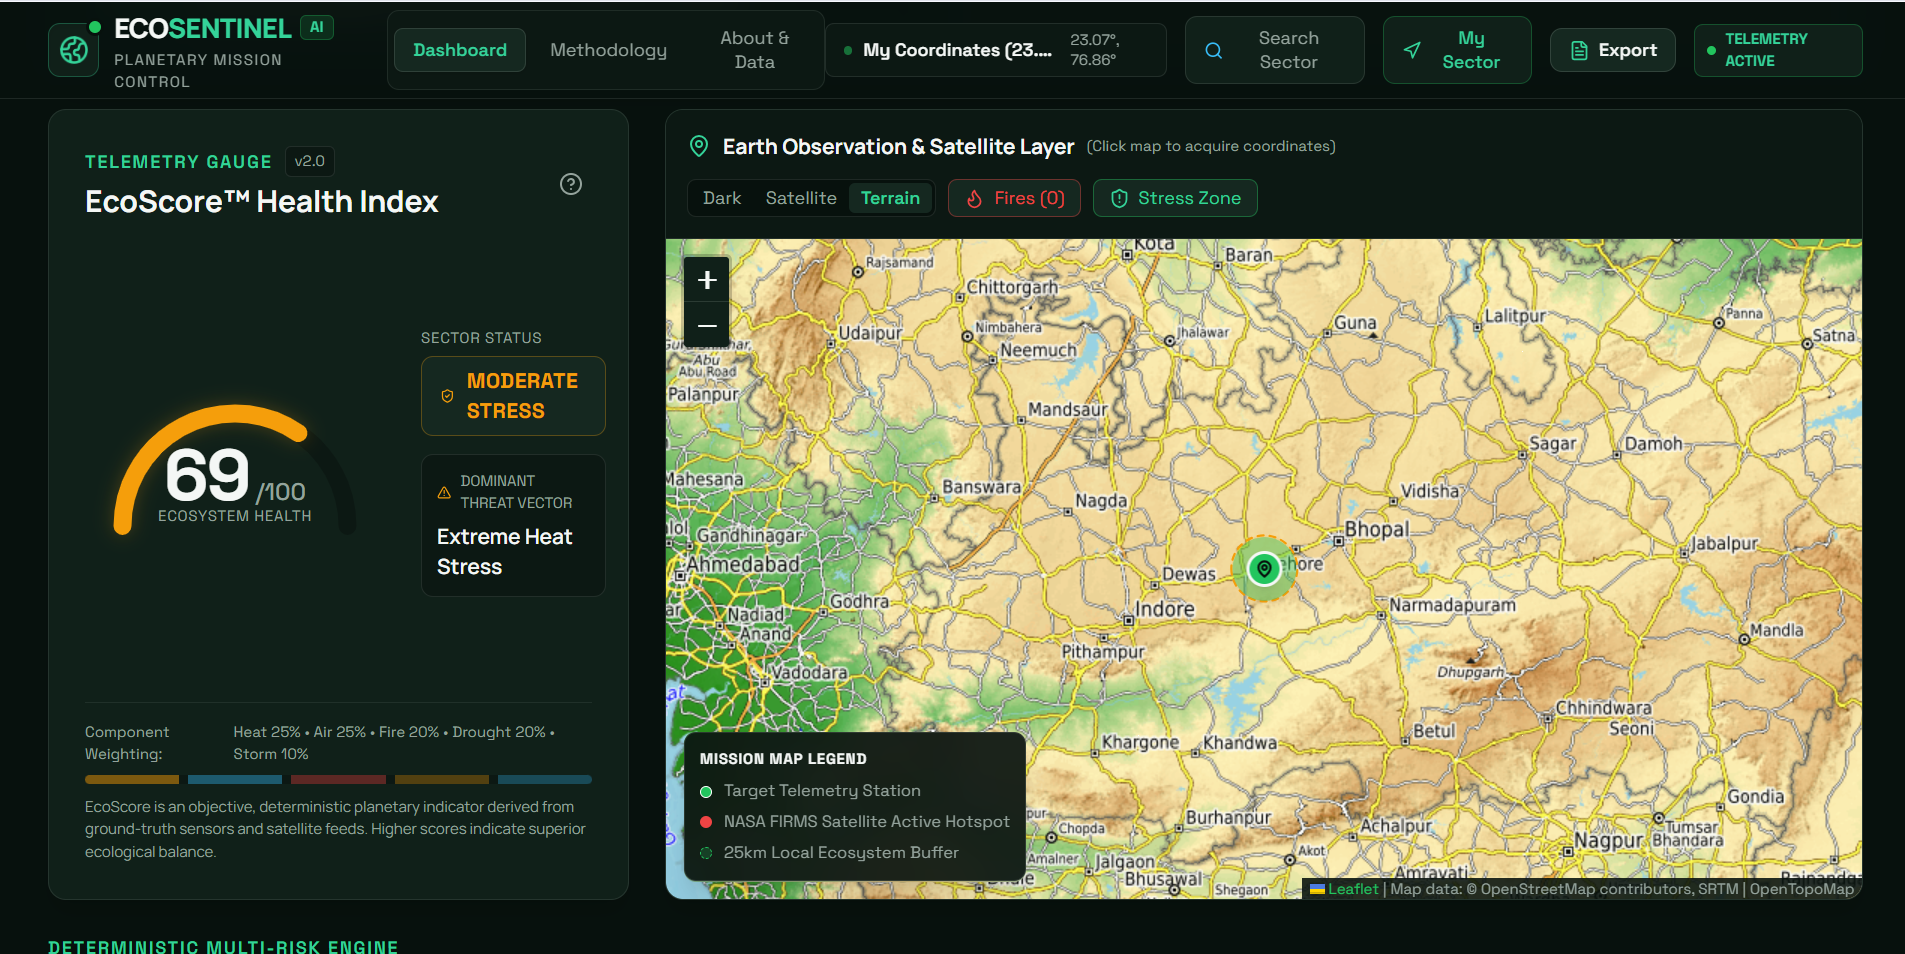
Explore environmental conditions geographically and identify areas experiencing elevated environmental stress.
-
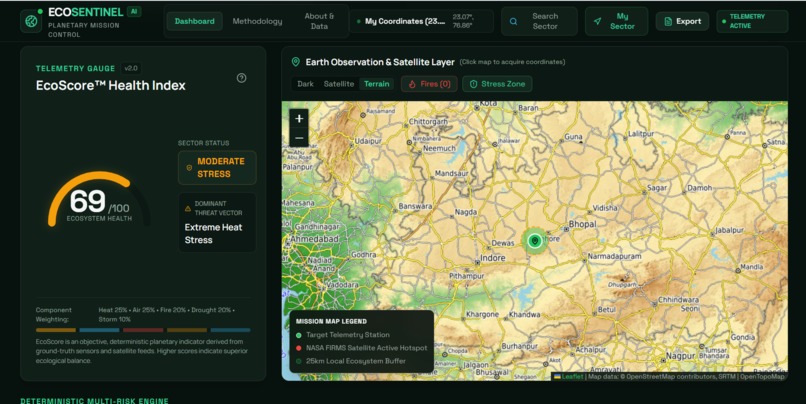
Satellite-based active-fire observations provide additional geographic context for environmental fire-risk analysis.
-
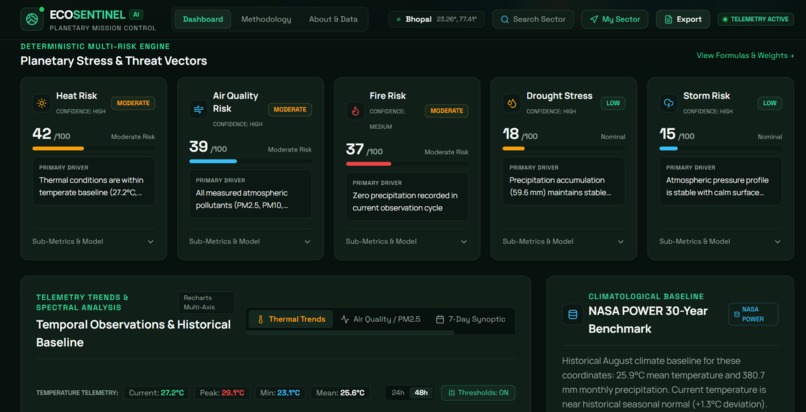
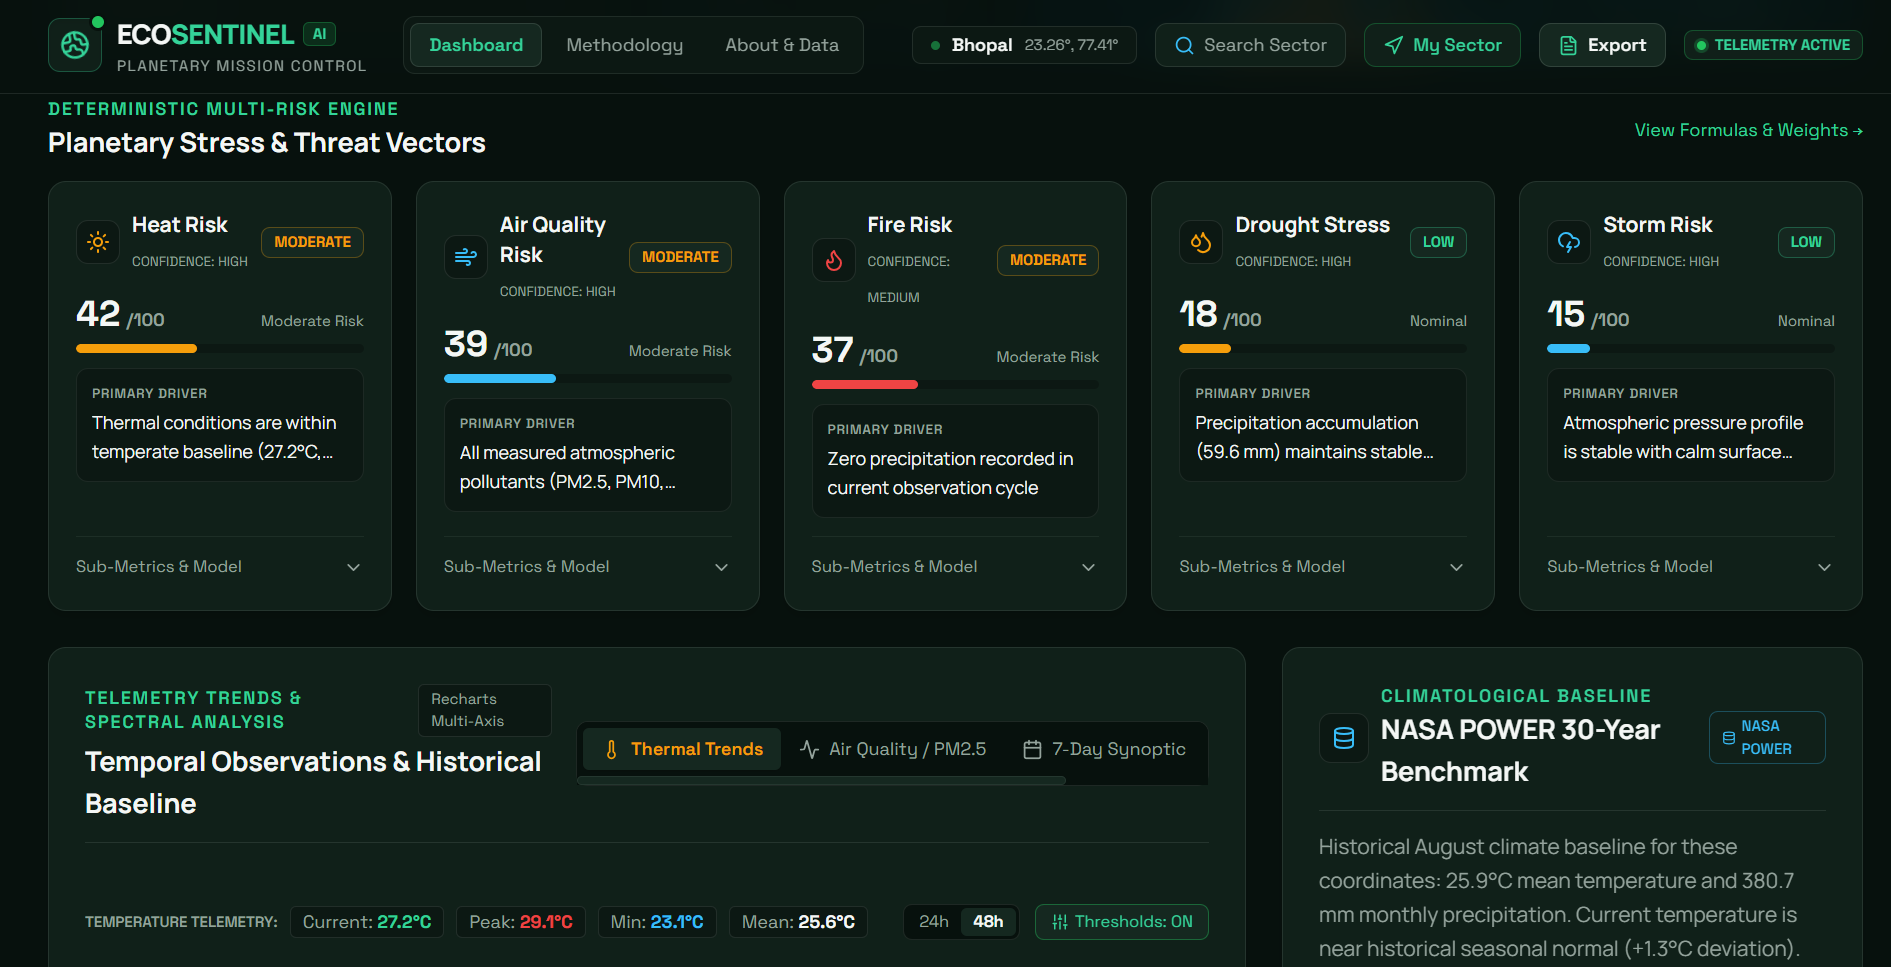
ransparent environmental risk indicators for heat, air quality, fire, drought, and storm conditions, calculated from measurable environment
-
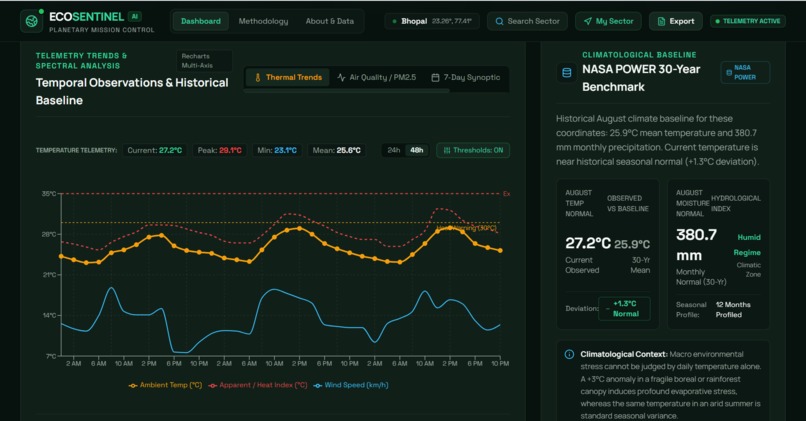
Gemini analyzes retrieved environmental signals and explains the primary threats, key drivers, potential impacts, and recommended actions
-
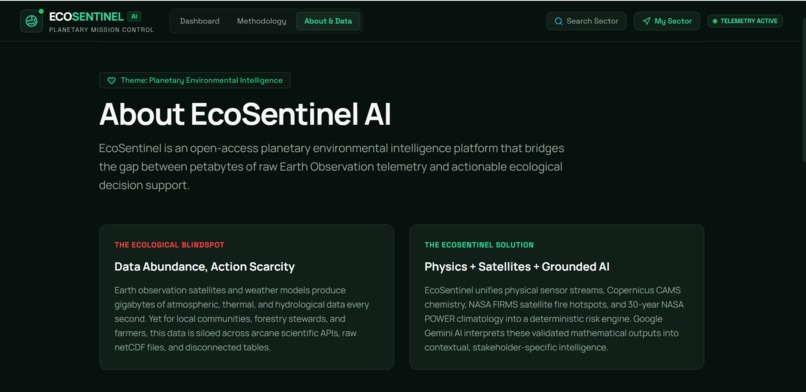
EcoSentinel AI turns real environmental data, satellite observations, and Gemini insights into clear, actionable planetary risk intelligence
Inspiration
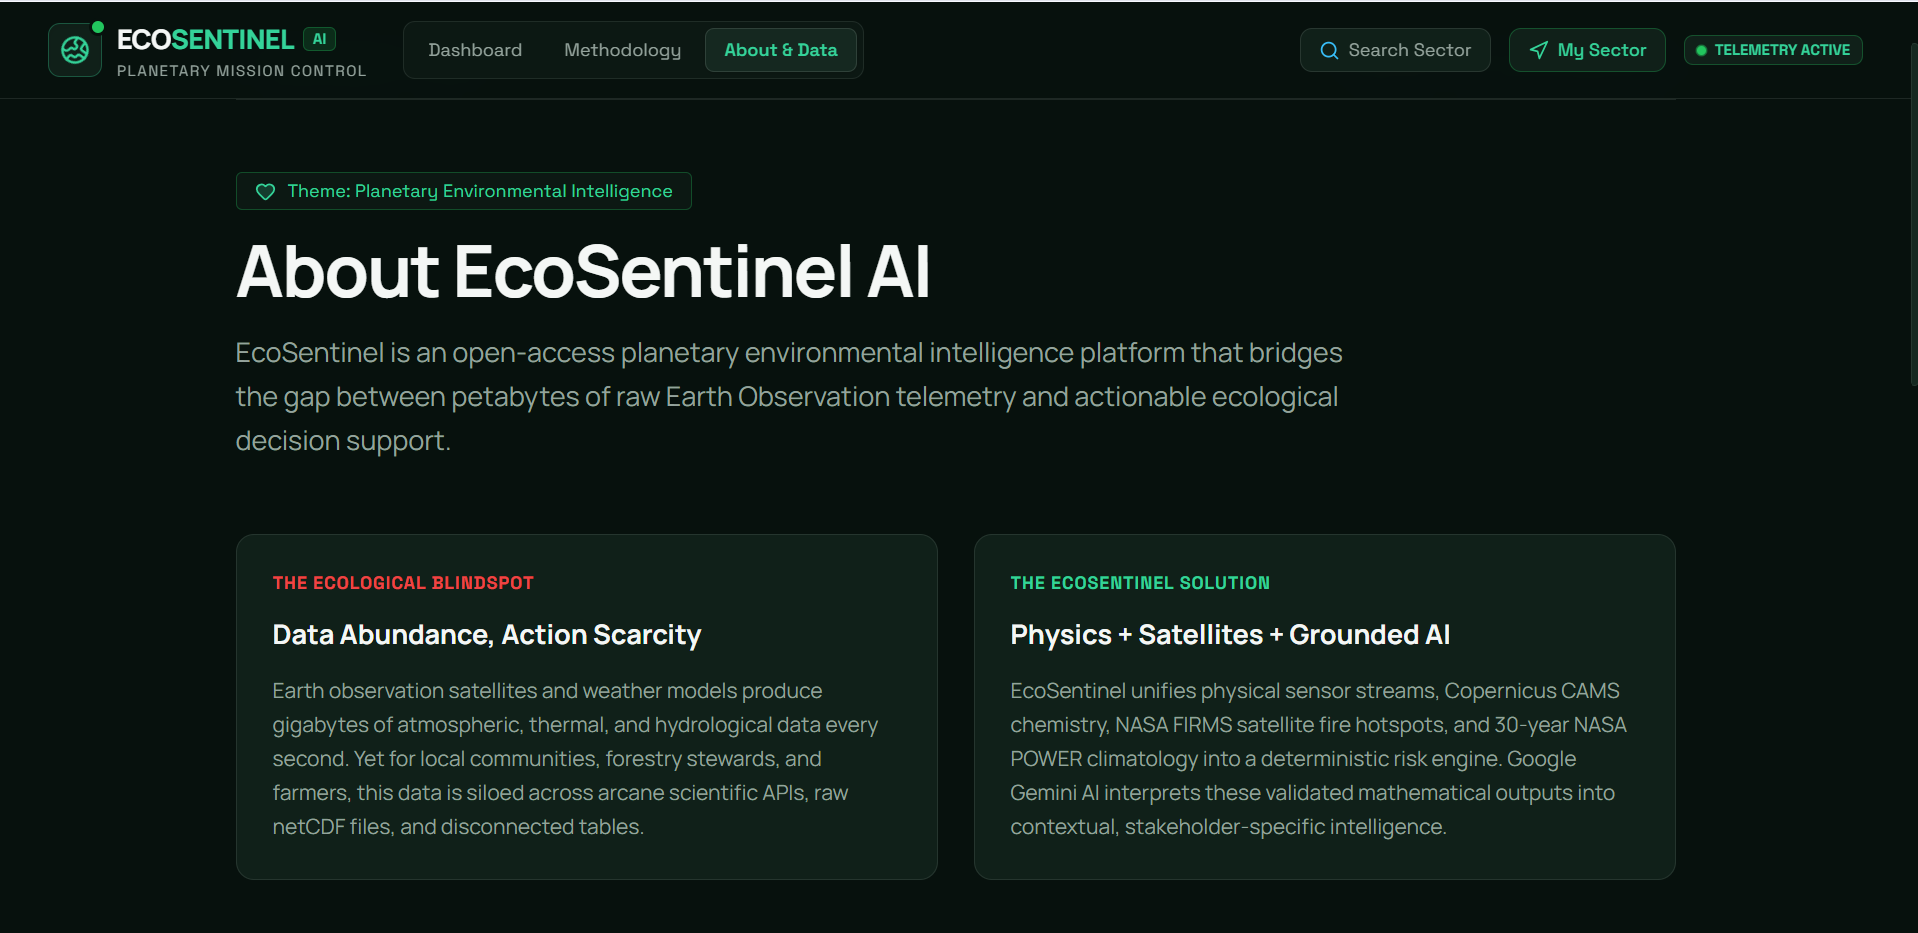
Environmental information is everywhere, but it is often fragmented across different platforms, APIs, maps, and scientific datasets. A person can find today's temperature in one place, air quality somewhere else, climate information on another platform, and satellite observations somewhere completely different. The challenge is not simply getting data — it is understanding what all those signals mean together.
We built EcoSentinel AI around a simple question:
What if anyone could look at a location on Earth and immediately understand its environmental conditions, emerging risks, and what they should pay attention to?
The idea was inspired by the growing need for accessible environmental intelligence. Environmental monitoring systems already generate enormous amounts of data, but much of it is difficult for non-specialists to interpret.
We wanted to bridge that gap by combining real environmental data with an understandable visual interface and AI-powered analysis.
What it does
EcoSentinel AI is a planetary environmental intelligence platform that transforms environmental data into understandable risk insights.
A user can search for a location, use their current location, or select a point directly on the interactive map.
EcoSentinel then combines available environmental information such as:
- Temperature and weather conditions
- Air-quality indicators such as PM2.5 and PM10
- Precipitation and drought-related conditions
- Satellite-based active-fire observations when available
- Historical climate context
- Environmental and satellite data sources
The platform processes these signals through a transparent environmental risk engine and produces indicators for:
- Heat Risk
- Air Quality Risk
- Fire Risk
- Drought Stress
- Storm Risk
- EcoScore
Instead of simply displaying numbers, EcoSentinel explains the important environmental signals.
Its Gemini-powered Environmental Intelligence layer can answer questions such as:
- What is the primary environmental threat?
- Which measurements are driving the risk?
- What could these conditions mean for the surrounding environment?
- What should people monitor next?
- What practical actions could be considered?
Importantly, Gemini does not invent the environmental measurements or determine arbitrary live conditions. Real environmental data is retrieved first, deterministic risk calculations are performed, and Gemini is then given those results to produce an understandable analysis.
How we built it
We built EcoSentinel AI as a full-stack web application.
Frontend
The interface was developed using:
- React
- TypeScript
- Vite
- Tailwind CSS
- Recharts
- React Leaflet
- Lucide React
- Motion for React
We designed the interface around a Planetary Mission Control concept, combining environmental monitoring with a clean scientific dashboard.
The main dashboard contains:
- Global interactive map
- EcoScore
- Environmental risk cards
- Current conditions
- Environmental trend charts
- AI Environmental Briefing
- Satellite fire layer
- Climate context
- Environmental Action Center
- Data-source and methodology information
Backend
A Node.js and Express backend handles communication with external services.
The backend normalizes different provider responses into a common environmental data structure so that the frontend does not need to understand the format of every external API.
The architecture is approximately:
$$ Location \rightarrow Data \rightarrow Normalization \rightarrow Risk Engine \rightarrow AI Analysis \rightarrow Visualization $$
Environmental data
EcoSentinel uses real environmental sources, including:
Open-Meteo for weather and atmospheric information.
CAMS data through Open-Meteo's air-quality service for atmospheric composition and air-quality indicators.
NASA POWER for historical climate and environmental context.
NASA FIRMS for satellite active-fire observations when the optional integration is configured.
OpenStreetMap for the interactive map.
AI
Google Gemini powers the Environmental Intelligence layer.
Rather than using AI as a generic chatbot, we designed Gemini as an environmental analyst.
The application sends structured environmental measurements and calculated risk indicators to Gemini. Gemini then produces a structured assessment containing:
- Primary environmental threat
- Key drivers
- Environmental implications
- Recommended actions
- What to monitor next
- Uncertainty and limitations
This approach helps separate measurement from interpretation.
Challenges we ran into
One of our biggest challenges was figuring out how to combine environmental datasets that were created for very different purposes.
Weather, air quality, historical climate information, and satellite fire observations have different:
- Data structures
- Units
- Update frequencies
- Spatial resolutions
- Availability
- Limitations
We therefore had to create a normalization layer before calculating environmental indicators.
Another challenge was avoiding the temptation to let AI generate everything.
An AI model can produce convincing environmental explanations even when the underlying information is incomplete. We wanted EcoSentinel to be more trustworthy, so we deliberately separated:
real measurements → deterministic calculations → AI interpretation
We also had to handle real-world API failures. Environmental APIs can timeout, return incomplete data, or be temporarily unavailable. Instead of allowing one failed provider to break the entire application, we designed the system so individual providers can fail gracefully while the remaining environmental information continues to work.
Another challenge was designing a dashboard that could display a large amount of scientific information without overwhelming the user.
This led us to focus heavily on visual hierarchy, progressive disclosure, animated data loading, clear risk indicators, and a methodology page explaining how our indicators are calculated.
Accomplishments that we're proud of
We are especially proud that EcoSentinel goes beyond being a static environmental dashboard.
Real environmental data
The platform is designed around actual environmental data sources rather than manually created numbers.
AI with a defined role
Instead of making Gemini the entire product, we use AI where it provides the most value: translating complex environmental signals into understandable intelligence.
Transparent risk methodology
EcoSentinel's environmental risk indicators are calculated using explicit inputs and weighting rather than asking an AI model to randomly assign a risk score.
Geographic environmental intelligence
The interactive map allows environmental information to be explored geographically, while satellite fire observations can provide additional context.
Data made understandable
The platform converts raw environmental measurements into visual indicators, trends, comparisons, and explanations that are easier for non-specialists to understand.
Resilient architecture
The application is designed so that one unavailable environmental provider does not bring down the entire experience.
Impact-oriented design
Every major feature is connected to a real environmental question:
What is happening?
Why might it matter?
What should we monitor?
What action could be considered?
What we learned
Building EcoSentinel taught us that environmental technology is not simply about collecting more data.
The harder problem is turning complex information into something people can actually understand and act upon.
We learned how important data provenance is when building AI systems. Knowing where a measurement came from, when it was retrieved, and what its limitations are is just as important as displaying the measurement itself.
We also learned that AI is most useful when it works alongside deterministic systems rather than replacing them.
For EcoSentinel, the environmental APIs provide the observations, our risk engine provides reproducible calculations, and Gemini provides the human-readable interpretation.
We also learned more about:
- Full-stack application architecture
- Environmental APIs
- Geographic data visualization
- Satellite observations
- Data normalization
- Risk modeling
- AI structured outputs
- API failure handling
- Responsive dashboard design
- Communicating scientific uncertainty
Most importantly, we learned that a strong environmental application should not just answer:
“What is the environmental data?”
It should help answer:
“What does this data mean, and why should we care?”
What's next for EcoSentinel AI
EcoSentinel is designed as a foundation that can grow into a much broader environmental monitoring platform.
Our next steps would include:
Expanded satellite intelligence
Add vegetation-health and land-cover information using satellite observations, enabling monitoring of ecosystem changes over time.
Habitat monitoring
Overlay protected areas, forests, wetlands, biodiversity hotspots, and other ecologically important regions.
Flood and water intelligence
Add rainfall accumulation, river information, flood-risk indicators, and water-resource monitoring.
Sustainable agriculture
Create location-specific agricultural insights using soil, rainfall, temperature, drought, and vegetation information.
Wildlife and biodiversity
Integrate wildlife observations and biodiversity datasets to help monitor species and habitat conditions.
Environmental alerts
Allow users or organizations to monitor selected locations and receive alerts when environmental indicators cross predefined thresholds.
Long-term environmental intelligence
Instead of only analyzing the current moment, EcoSentinel could maintain environmental histories and identify persistent trends and anomalies.
Community observations
Allow communities, conservation groups, researchers, and citizens to contribute verified local environmental observations.
Our long-term vision is for EcoSentinel to evolve from a visualization tool into a planetary environmental early-awareness platform — connecting real environmental observations, scientific data, AI interpretation, and human action in one place.
The planet is constantly sending signals. EcoSentinel's goal is to help us understand them before they become crises.
Built With
- artificial-intelligence
- environmental
- express.js
- gemini-api
- google-gemini
- leaflet.js
- nasa-firms
- nasa-power
- node.js
- open-meteo
- react
- recharts
- tailwind-css
- typescript
- vite


Log in or sign up for Devpost to join the conversation.