-
-
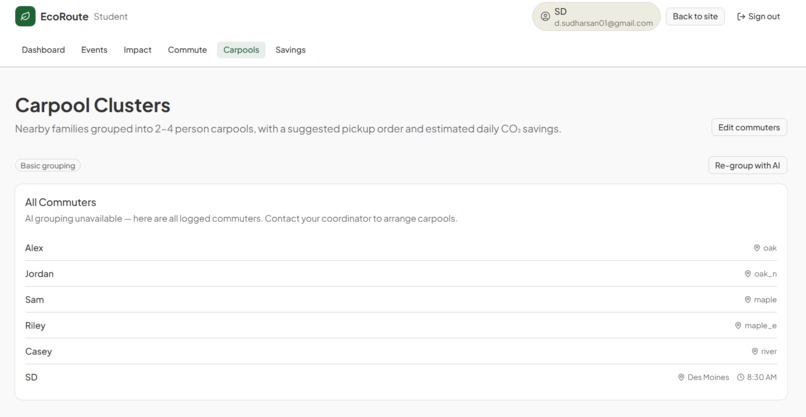
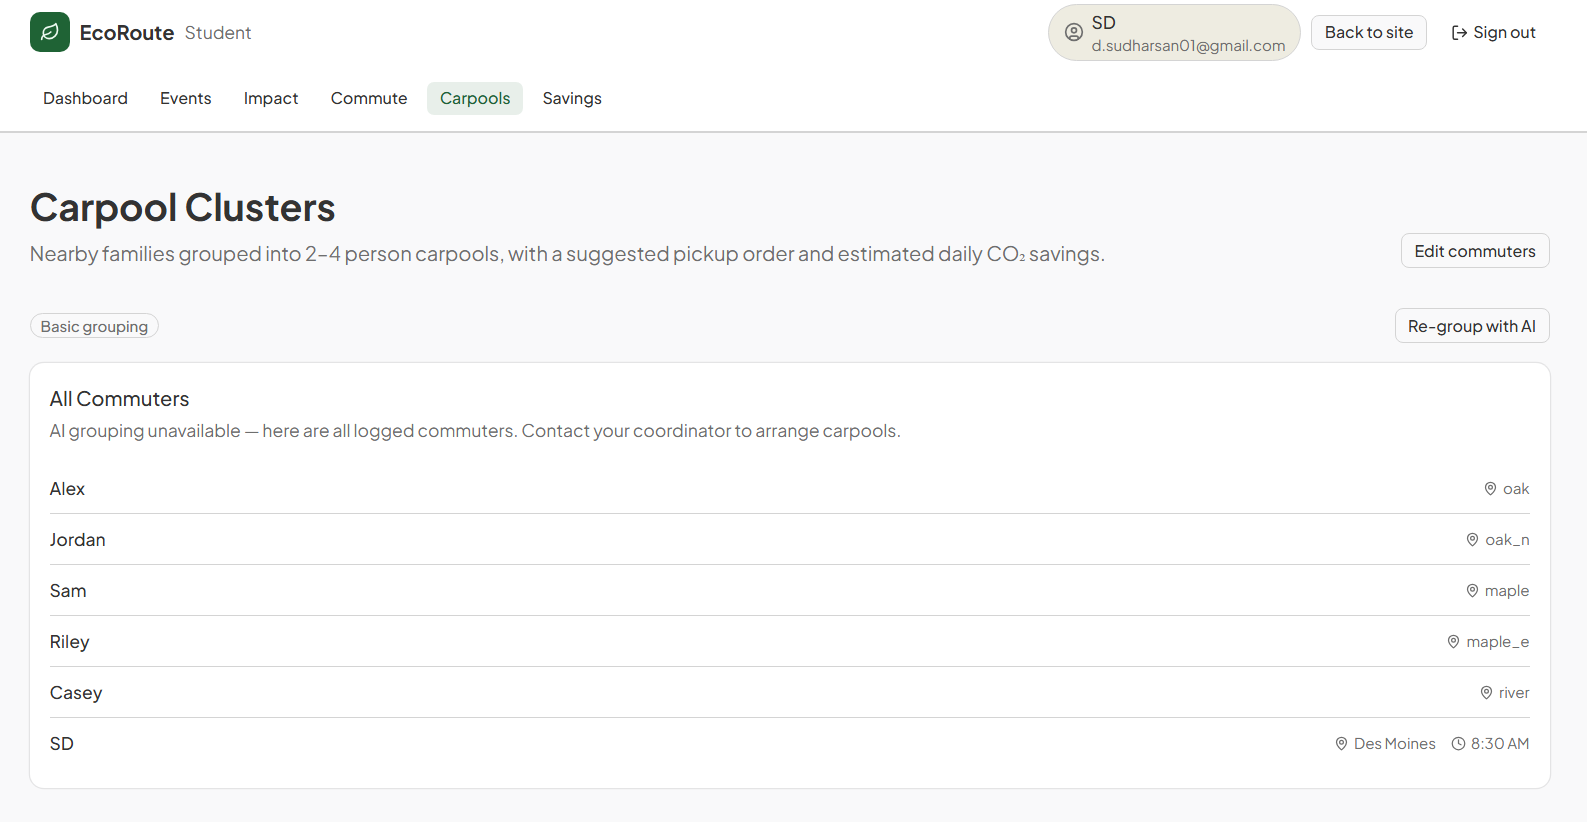
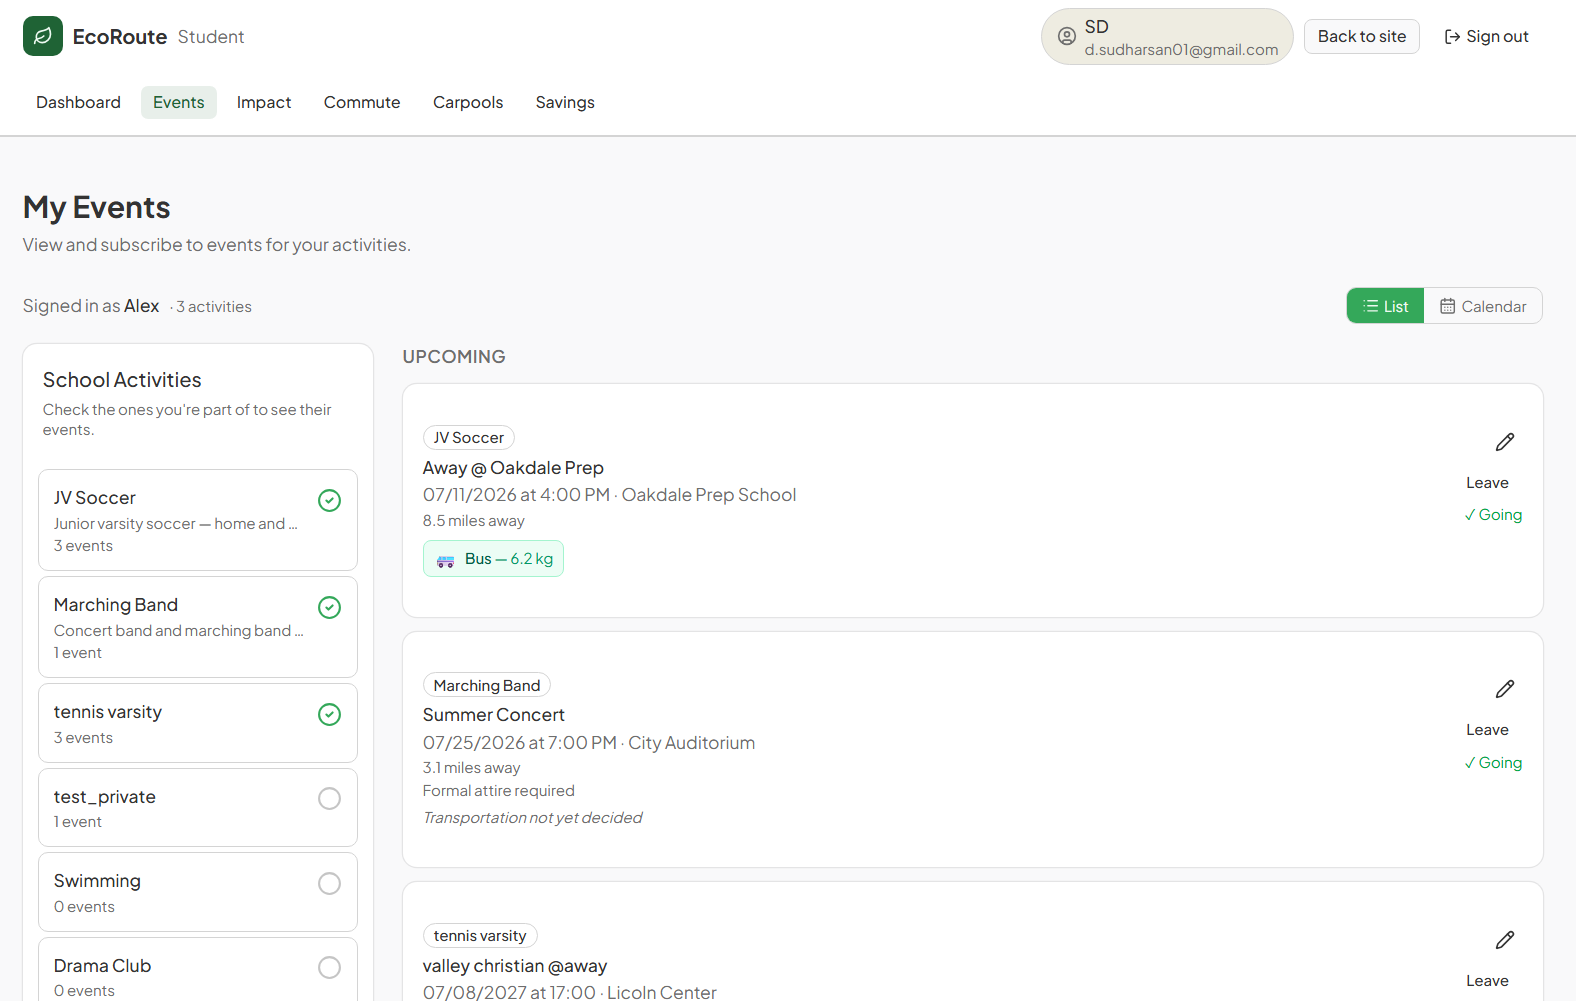
EcoRoute Student Carpools
-
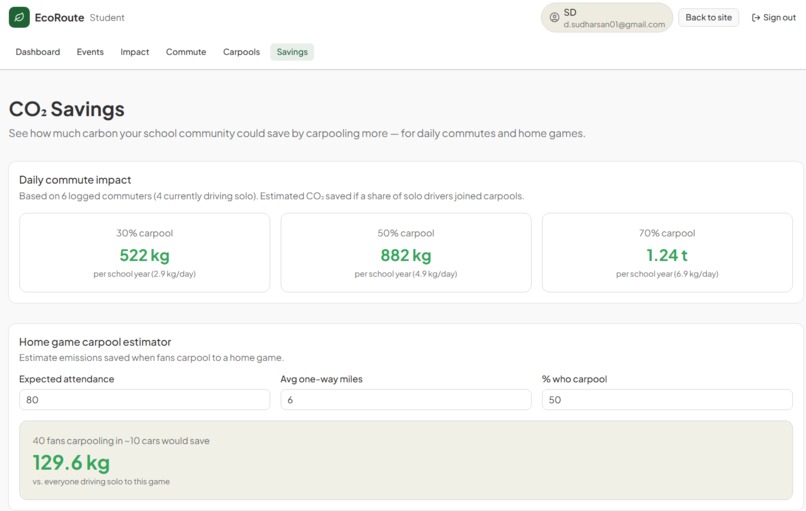
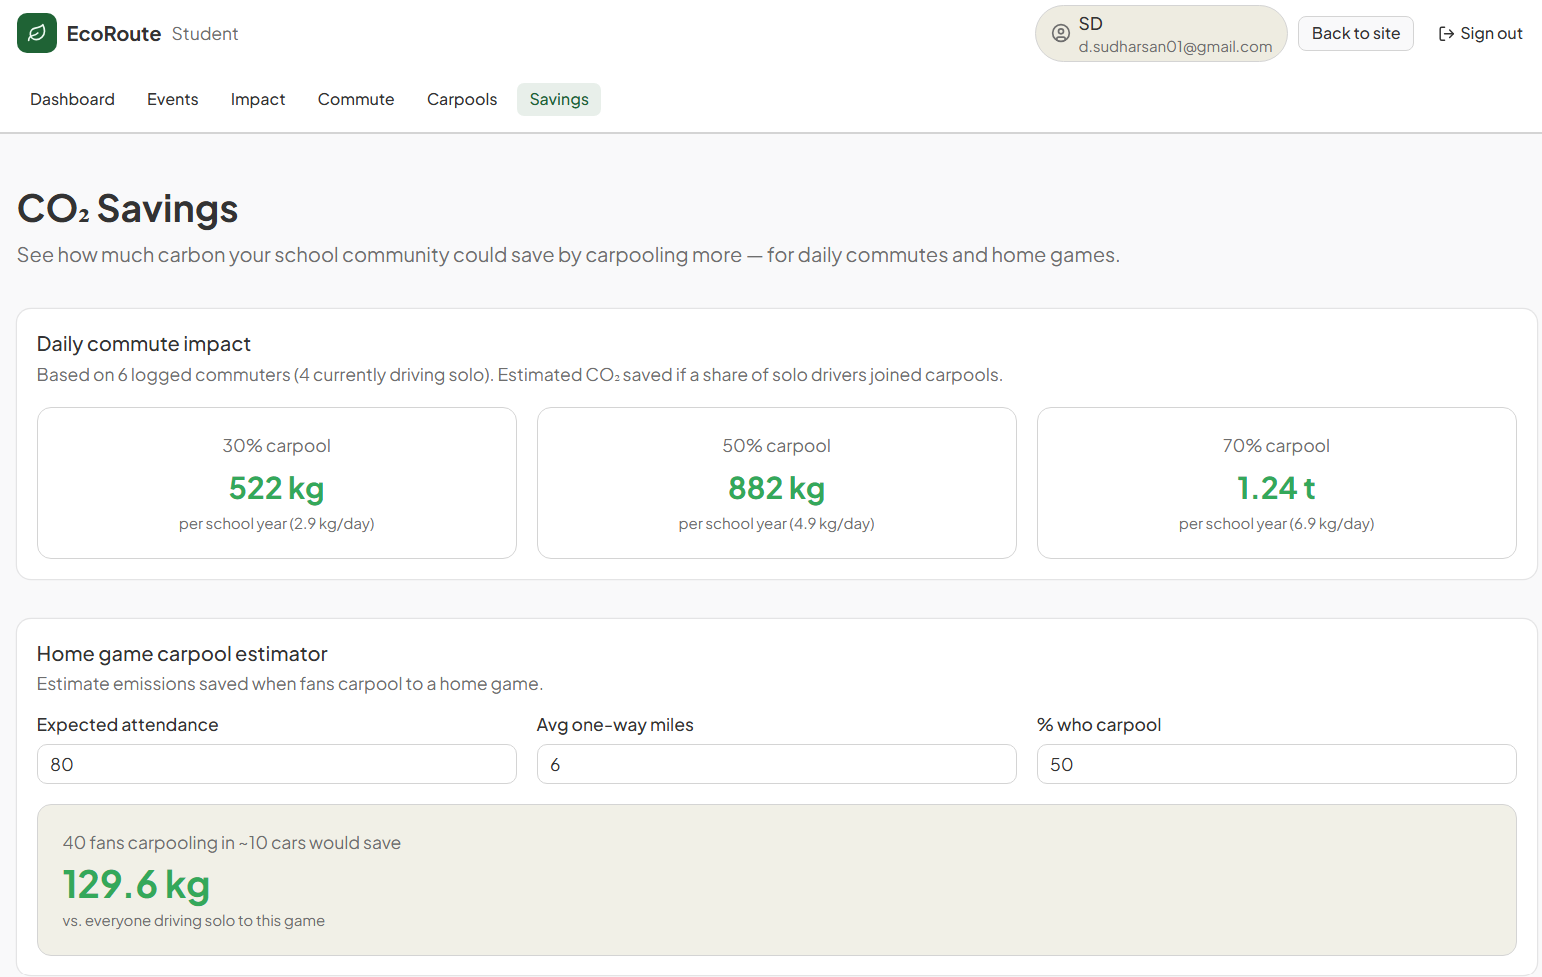
EcoRoute Student Savings
-
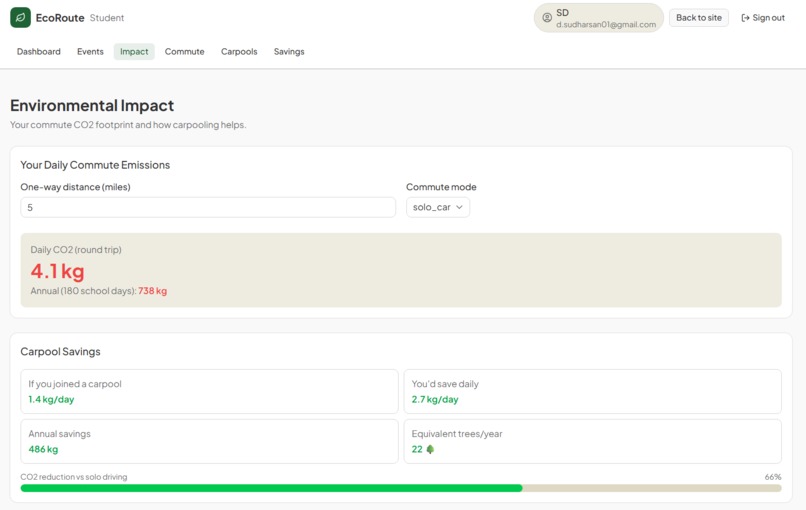
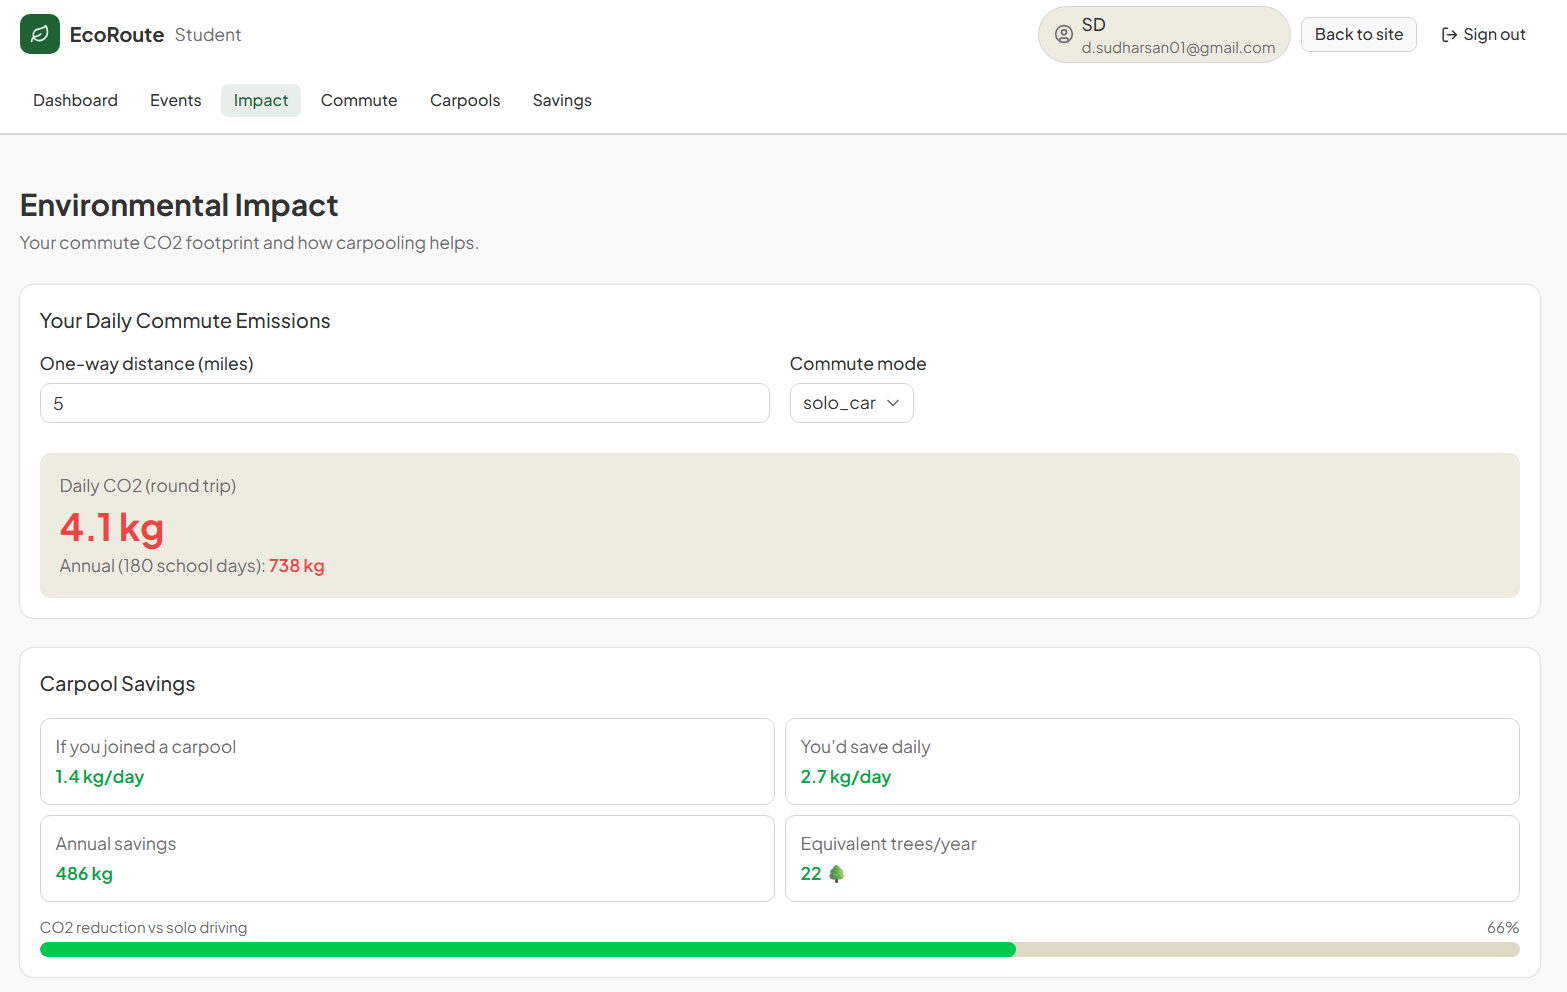
EcoRoute Student Impact
-
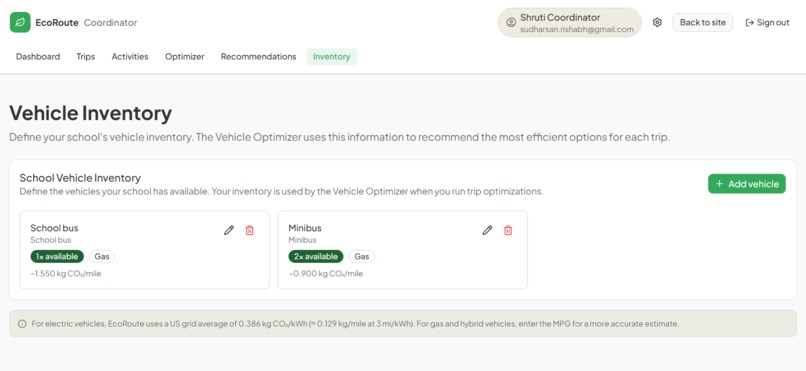
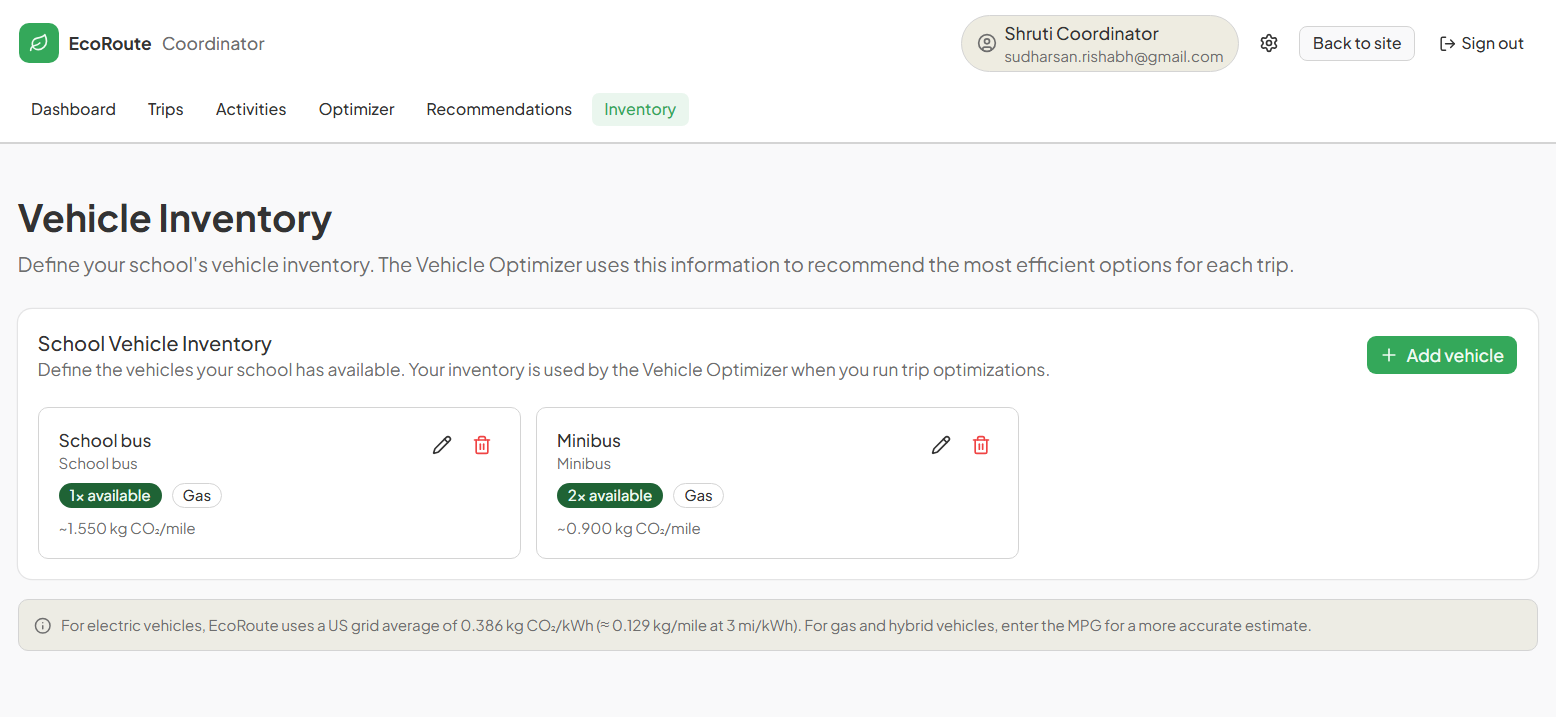
EcoRoute Coordinator Inventory
-
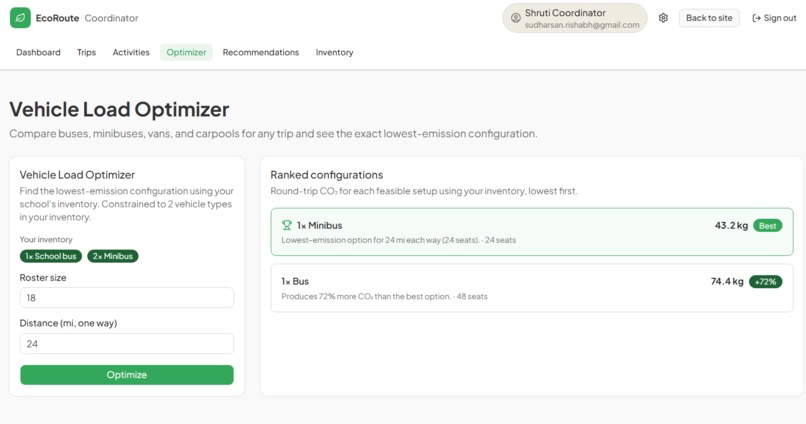
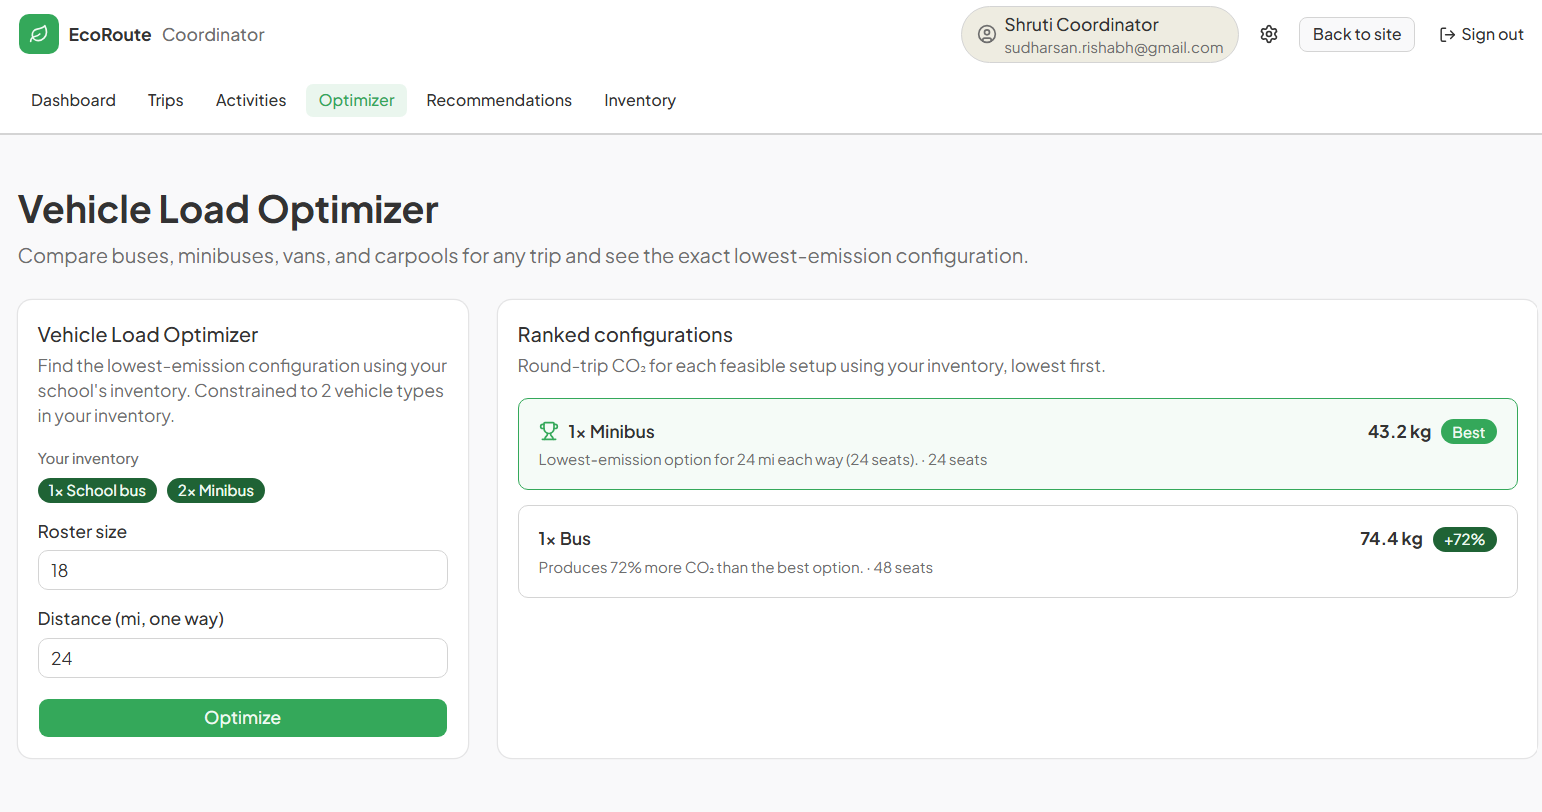
EcoRoute Coordinator Optimizer
-
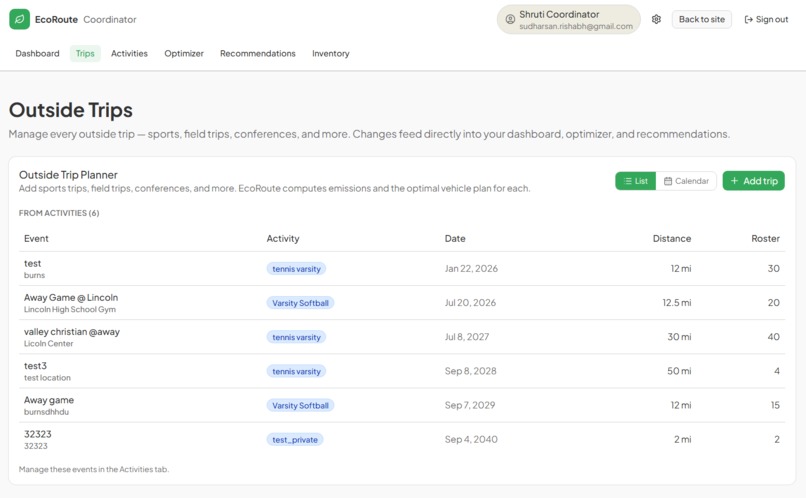
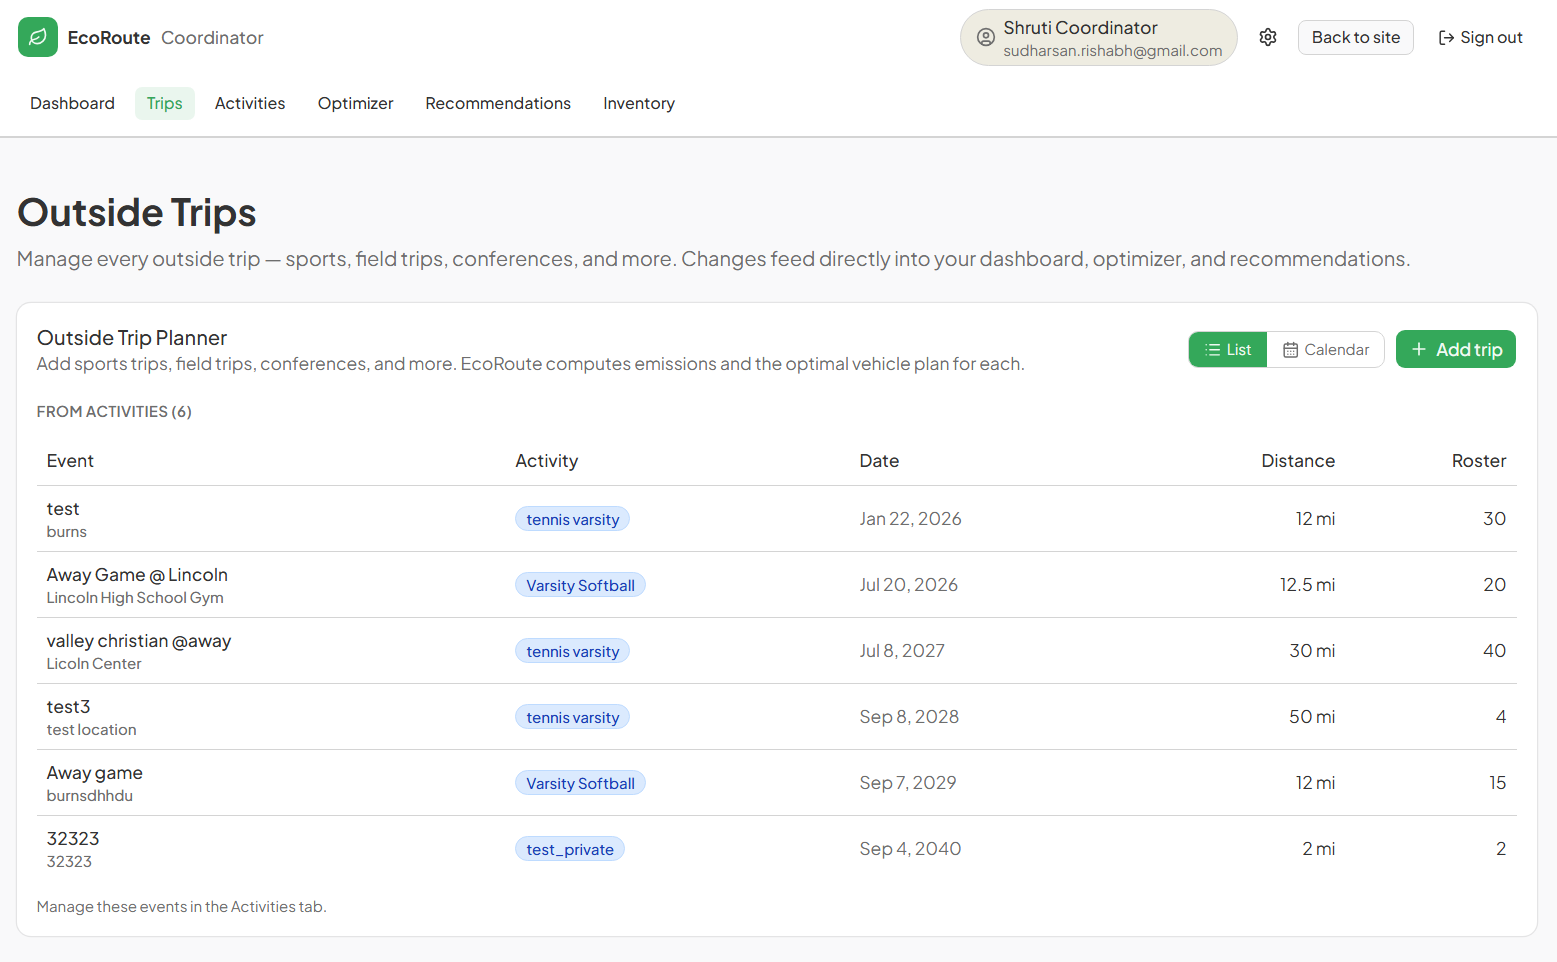
EcoRoute Coordinator Trips
-
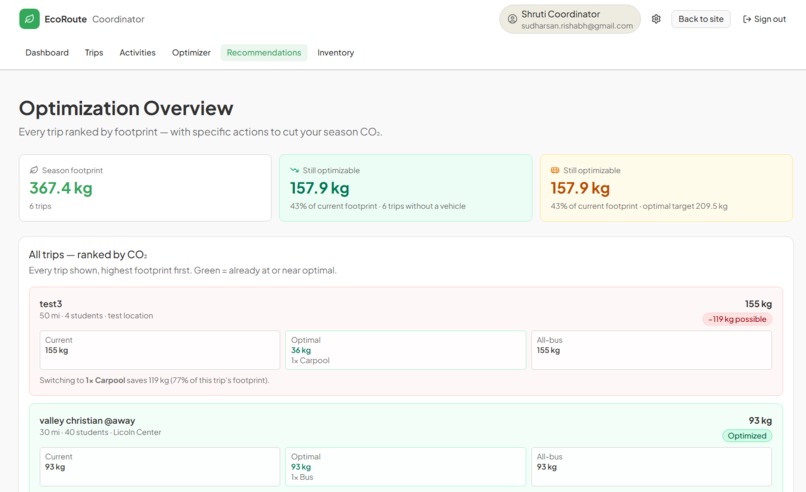
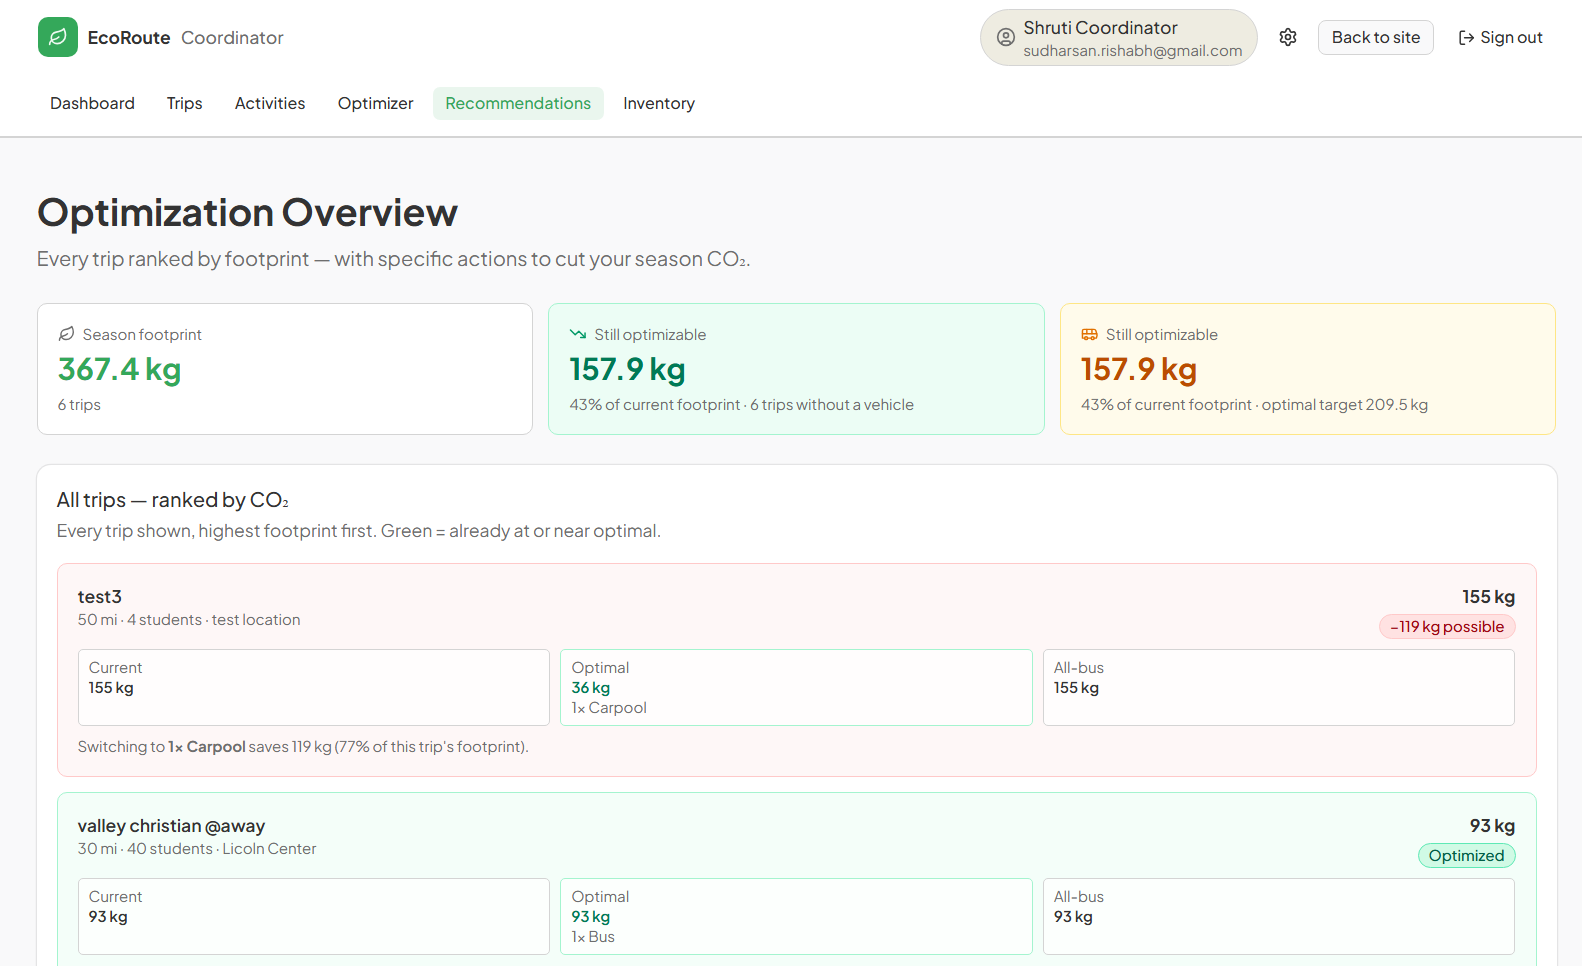
EcoRoute Coordinator Recommendations
-
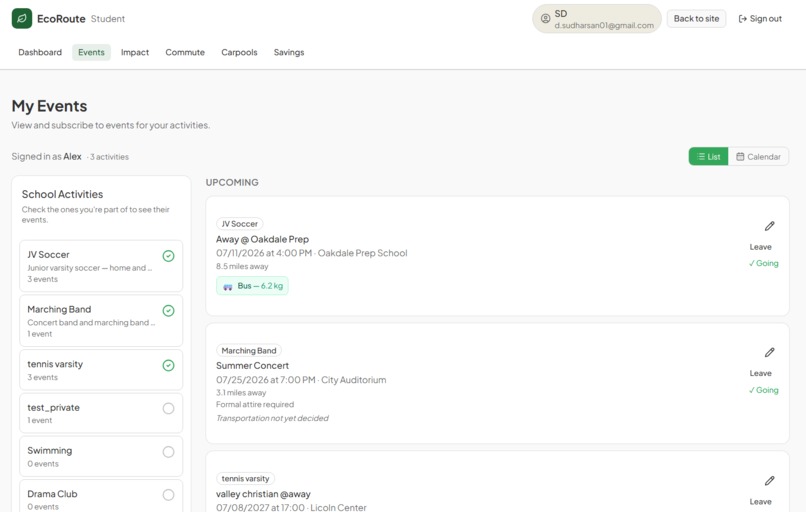
EcoRoute Student Events
-
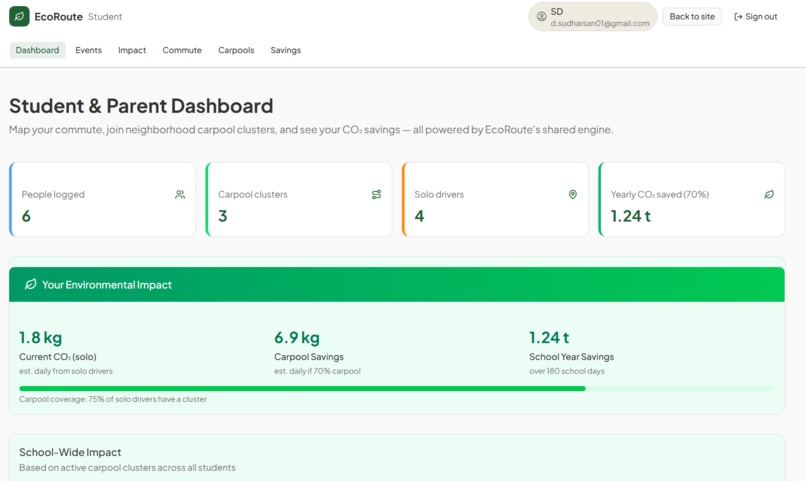
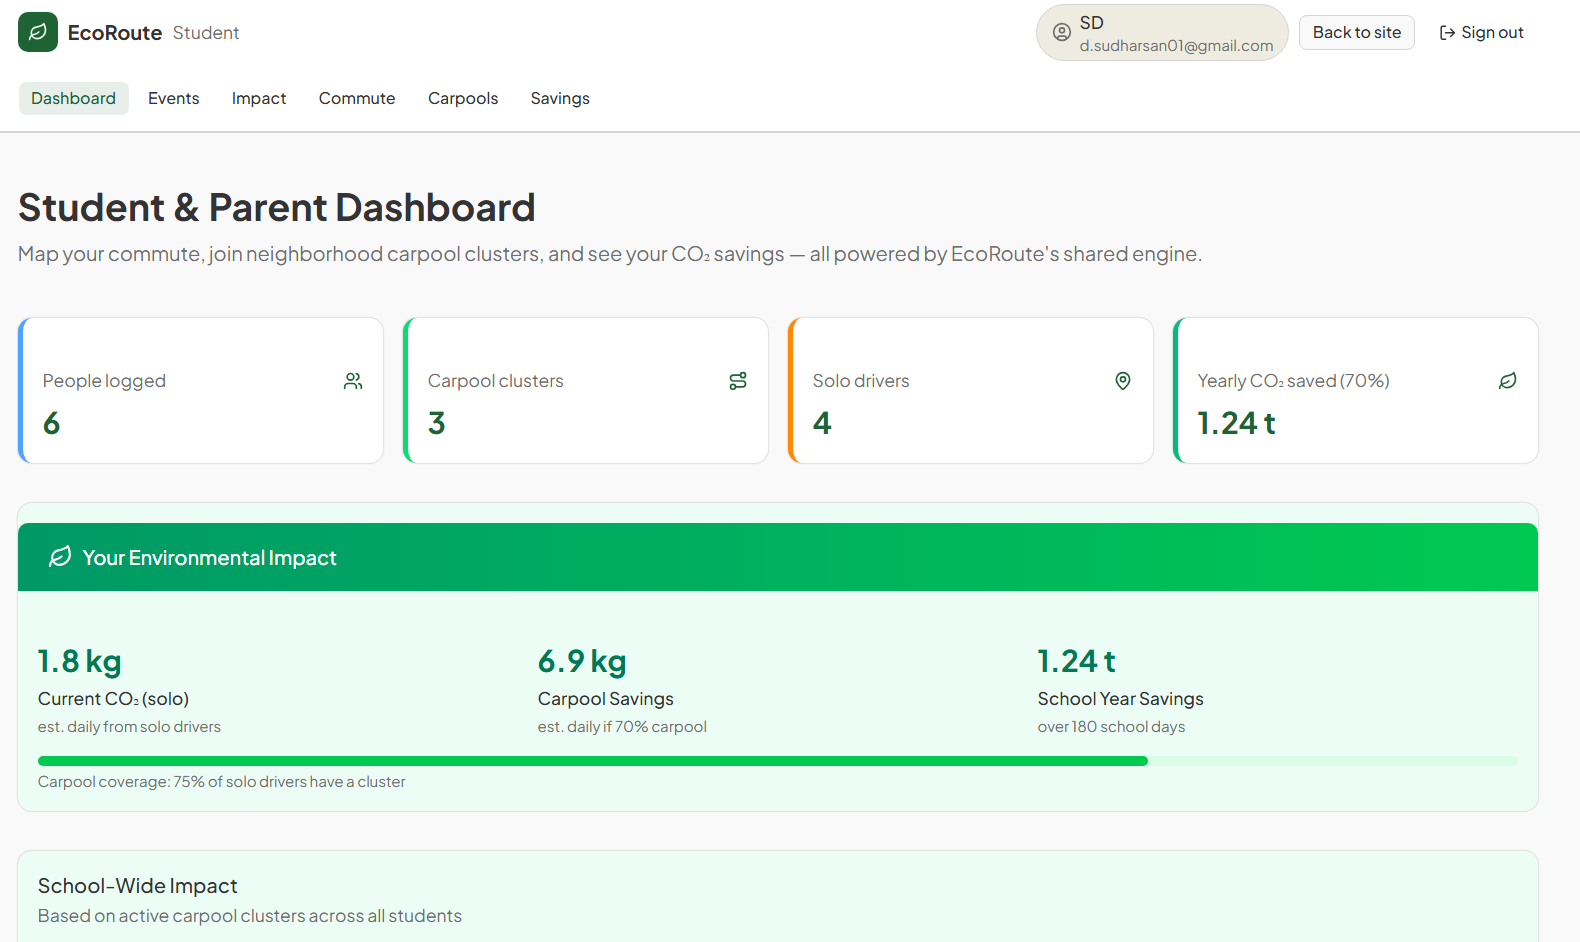
EcoRoute Student Dashboard
-
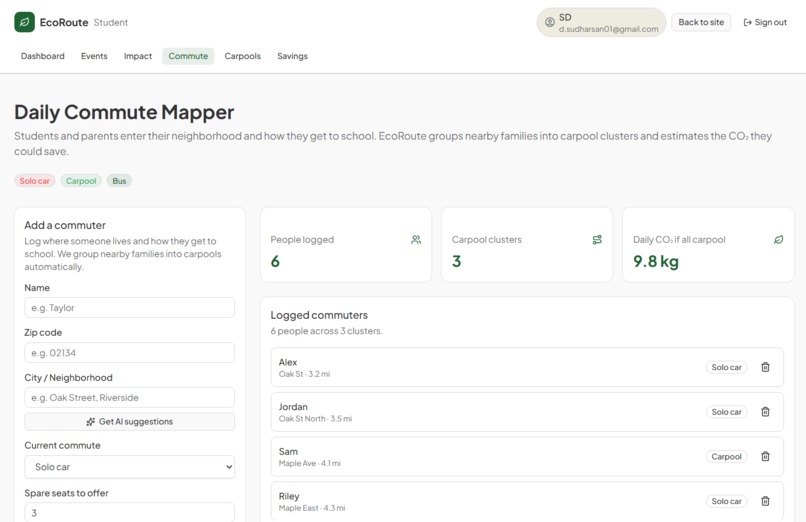
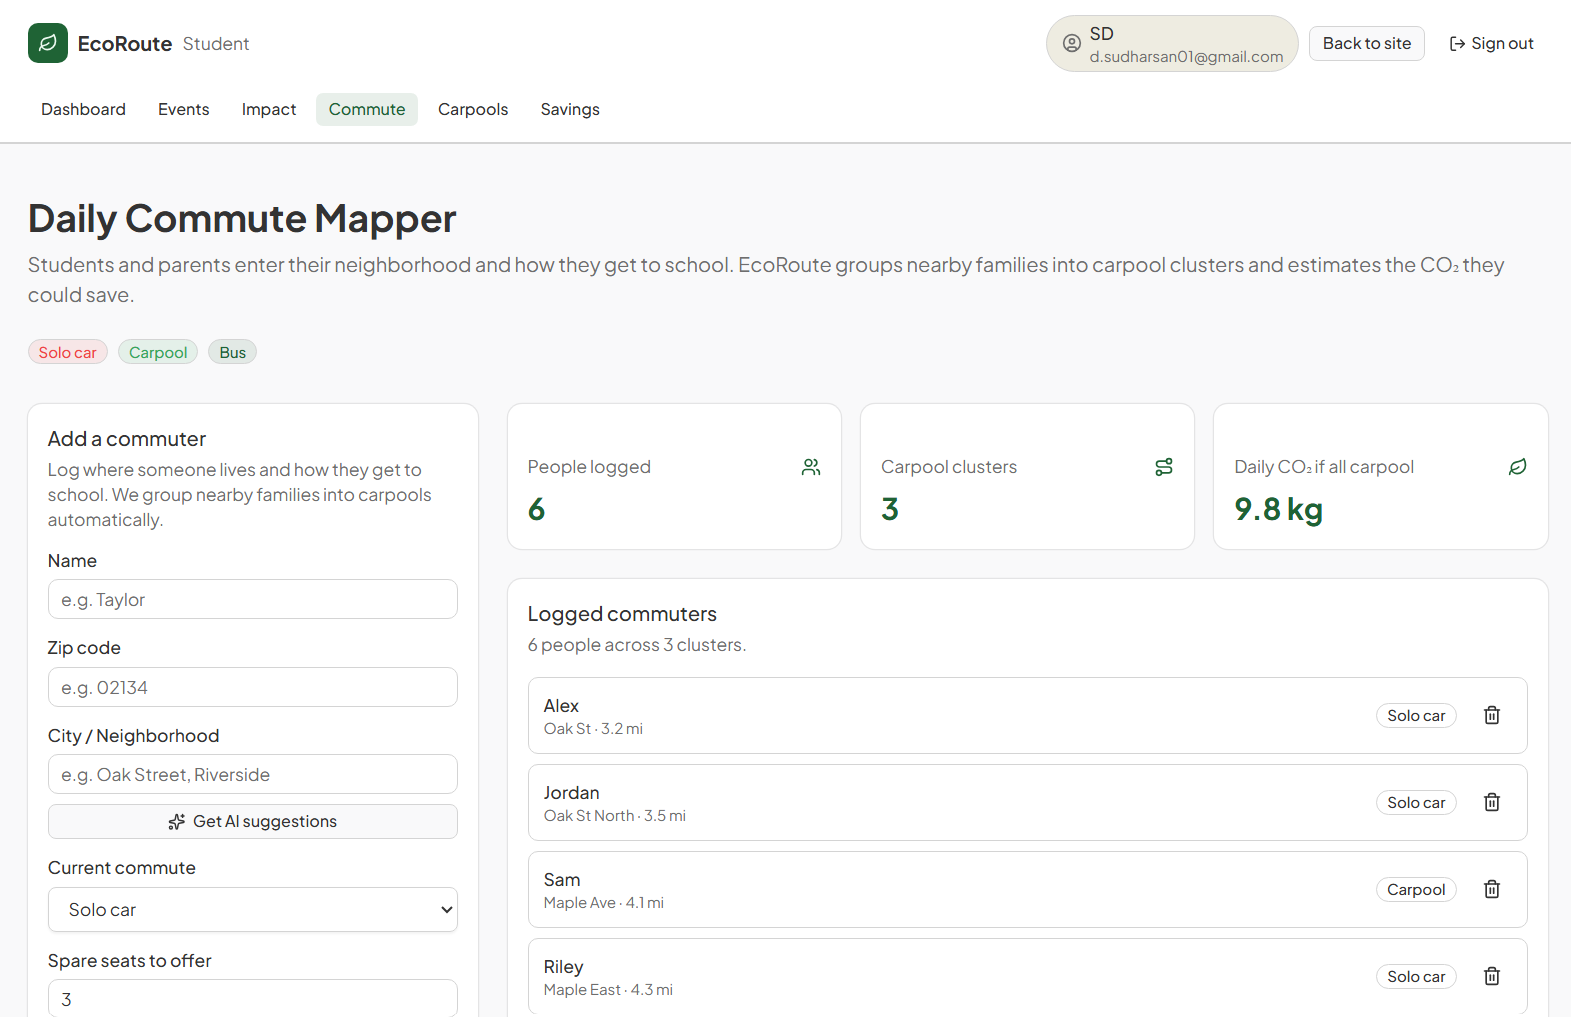
EcoRoute Student Commute
-
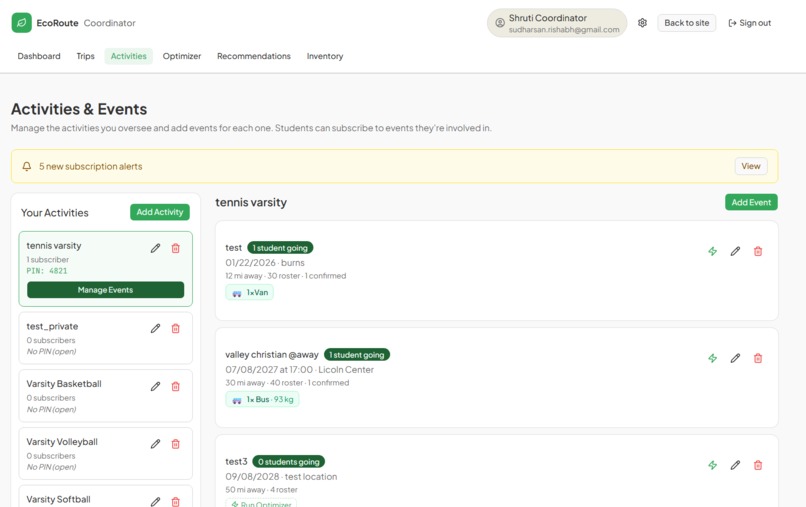
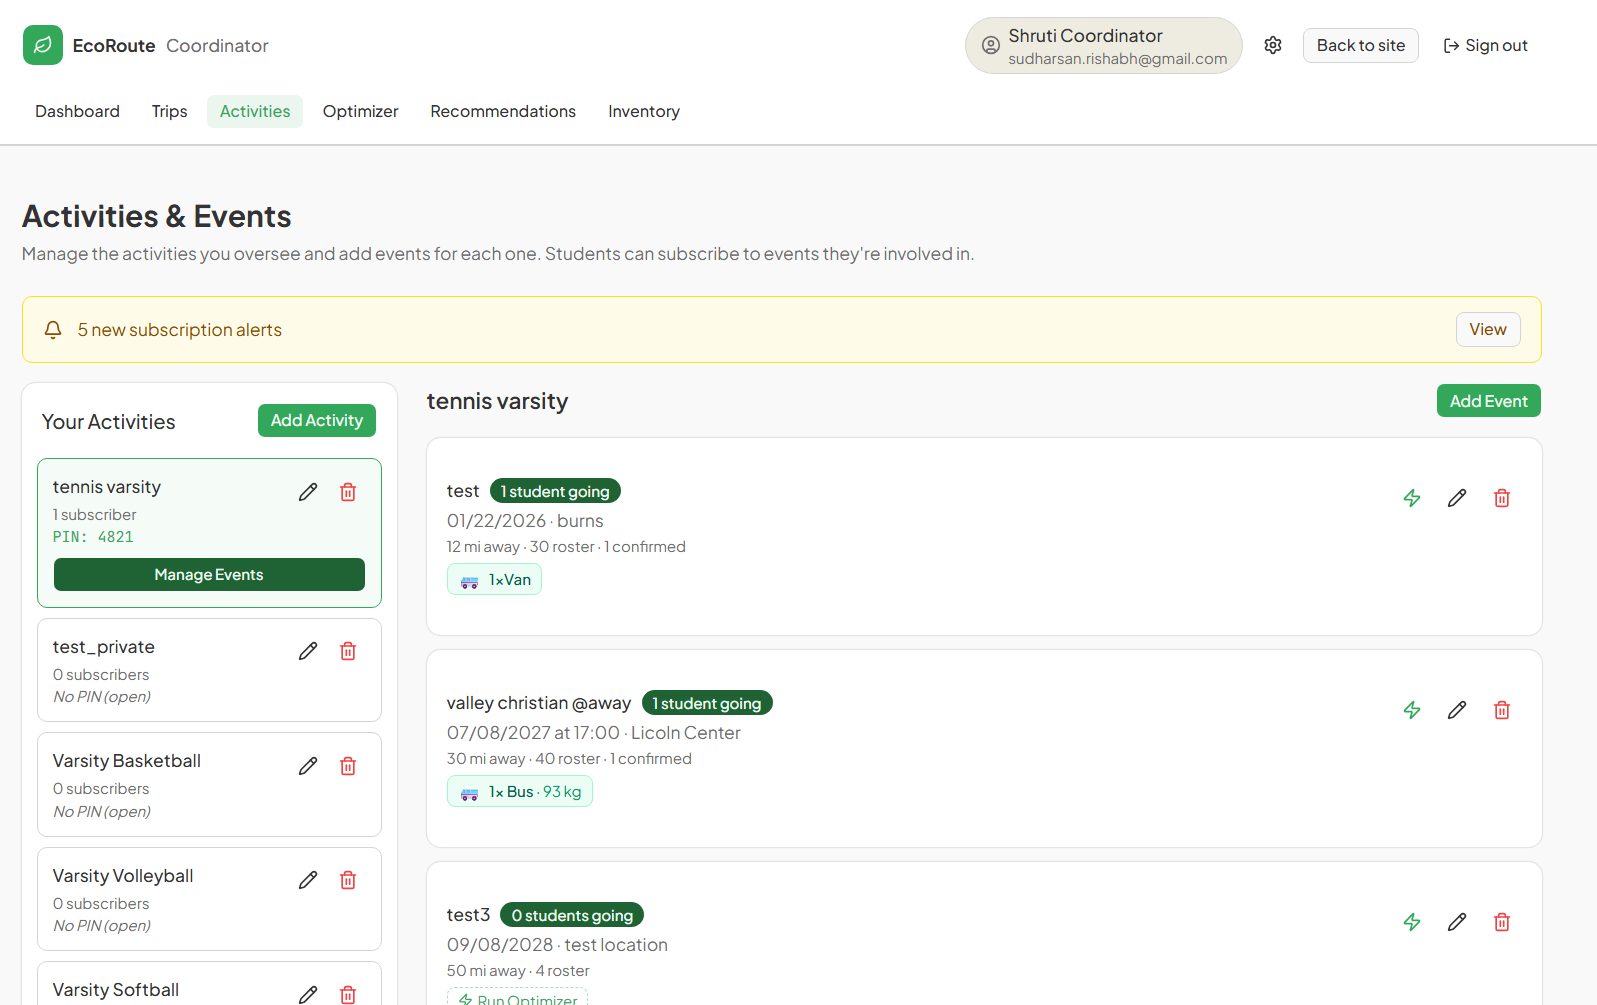
EcoRoute Coordinator Activities
-
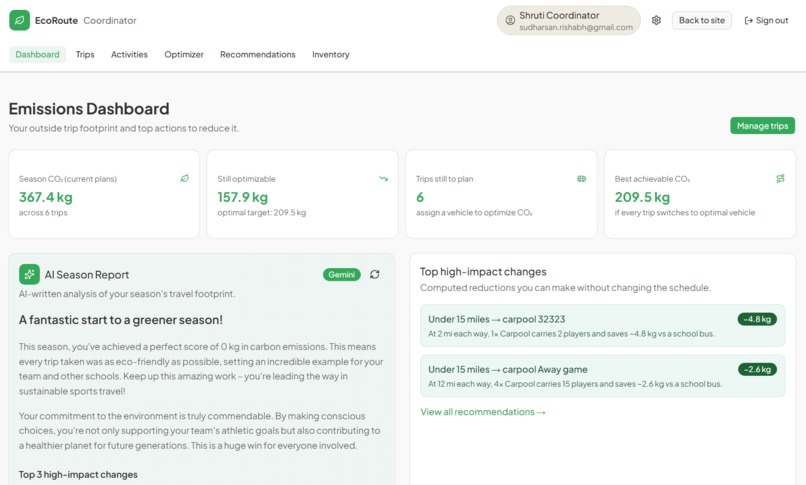
EcoRoute Coordinator Dashboard
-
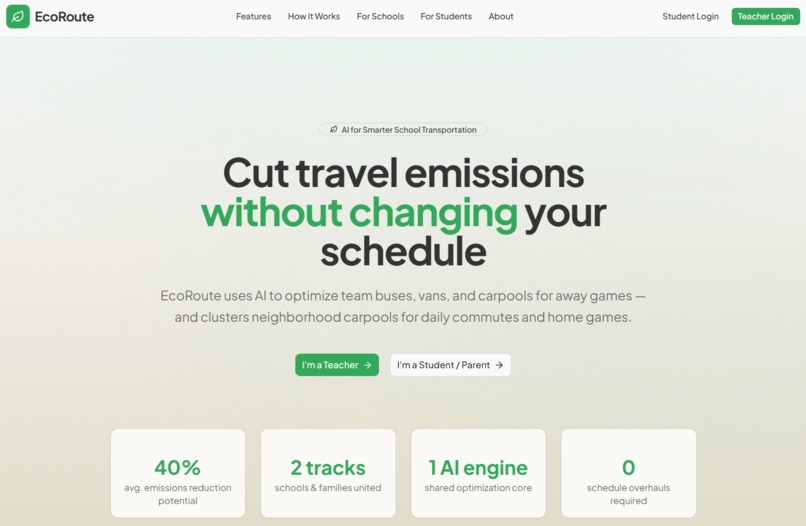
EcoRoute Landing Page
Inspiration
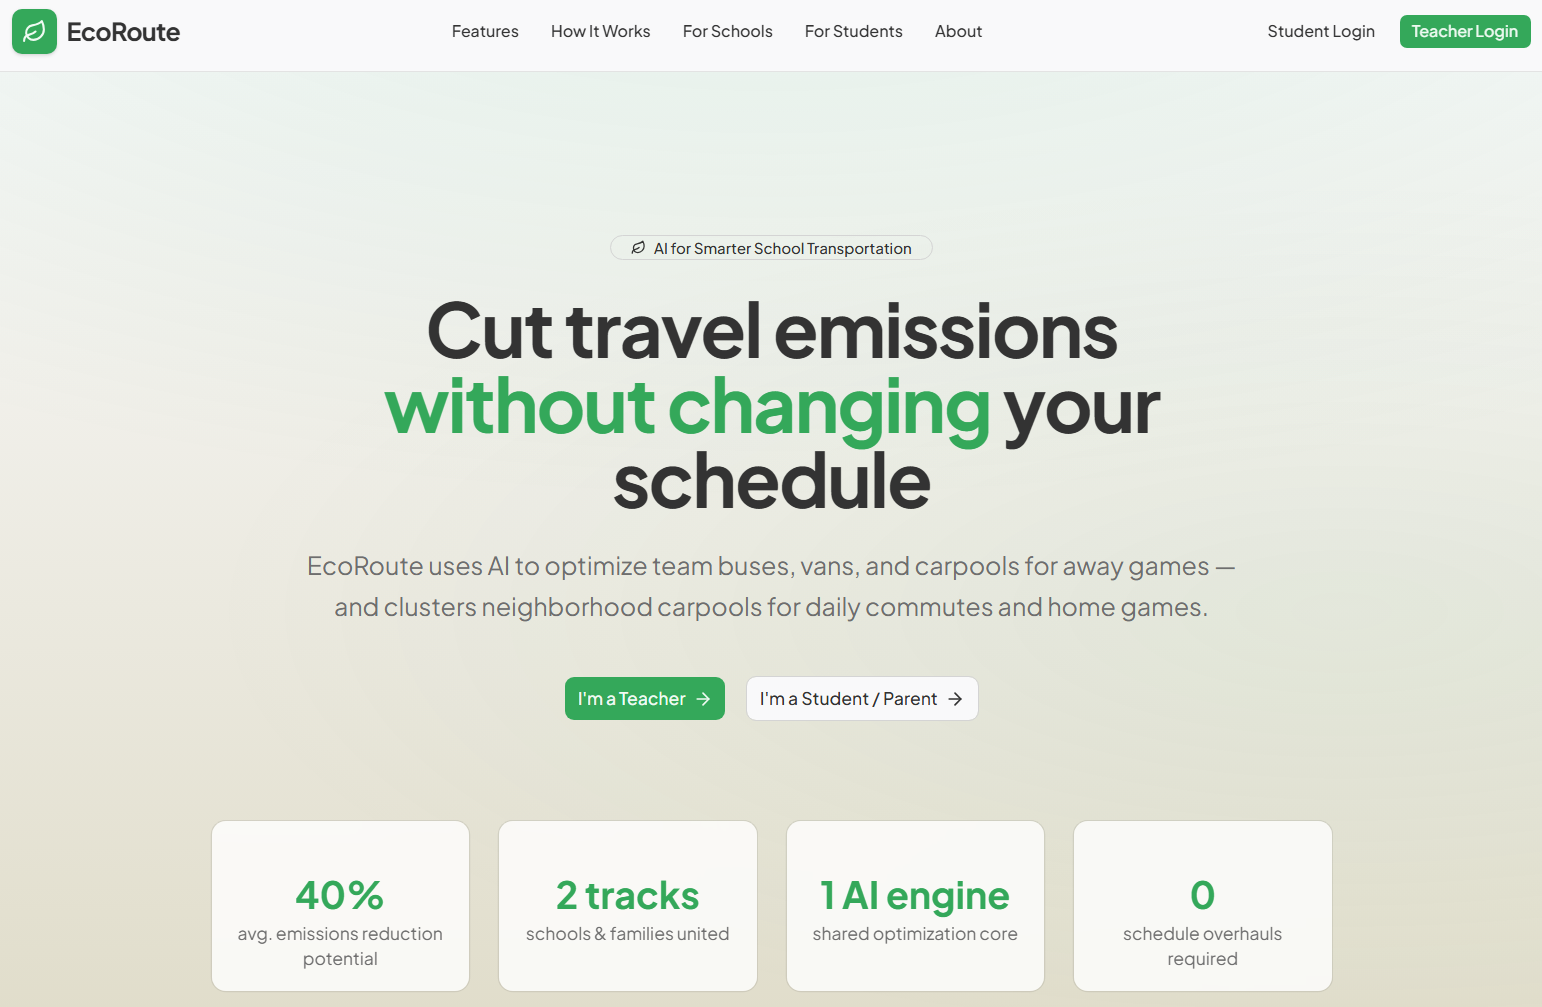
Inspiration for EcoRoute came directly from our personal experiences at school. Every morning, hundreds of students arrive using a variety of transportation methods, including cars, buses, public transit, bicycles, and walking. While transportation is a routine part of daily life, its environmental impact often goes unnoticed. We observed that most students still travel independently to school despite living near other classmates. Many more are unaware of the environmental consequences depending on their transportation choices. As a result, students and families who want to make sustainable choices often lack the information needed to do so. This led us to ask: What if students could see the environmental impact of their transportation choices and receive personalized recommendations to reduce it? We created EcoRoute to make each school’s transportation footprint visible, measurable, and actionable. By identifying carpool opportunities, estimating emissions, and recommending lower-emission transportation options, EcoRoute helps students turn everyday transportation decisions into meaningful climate action.
What it does
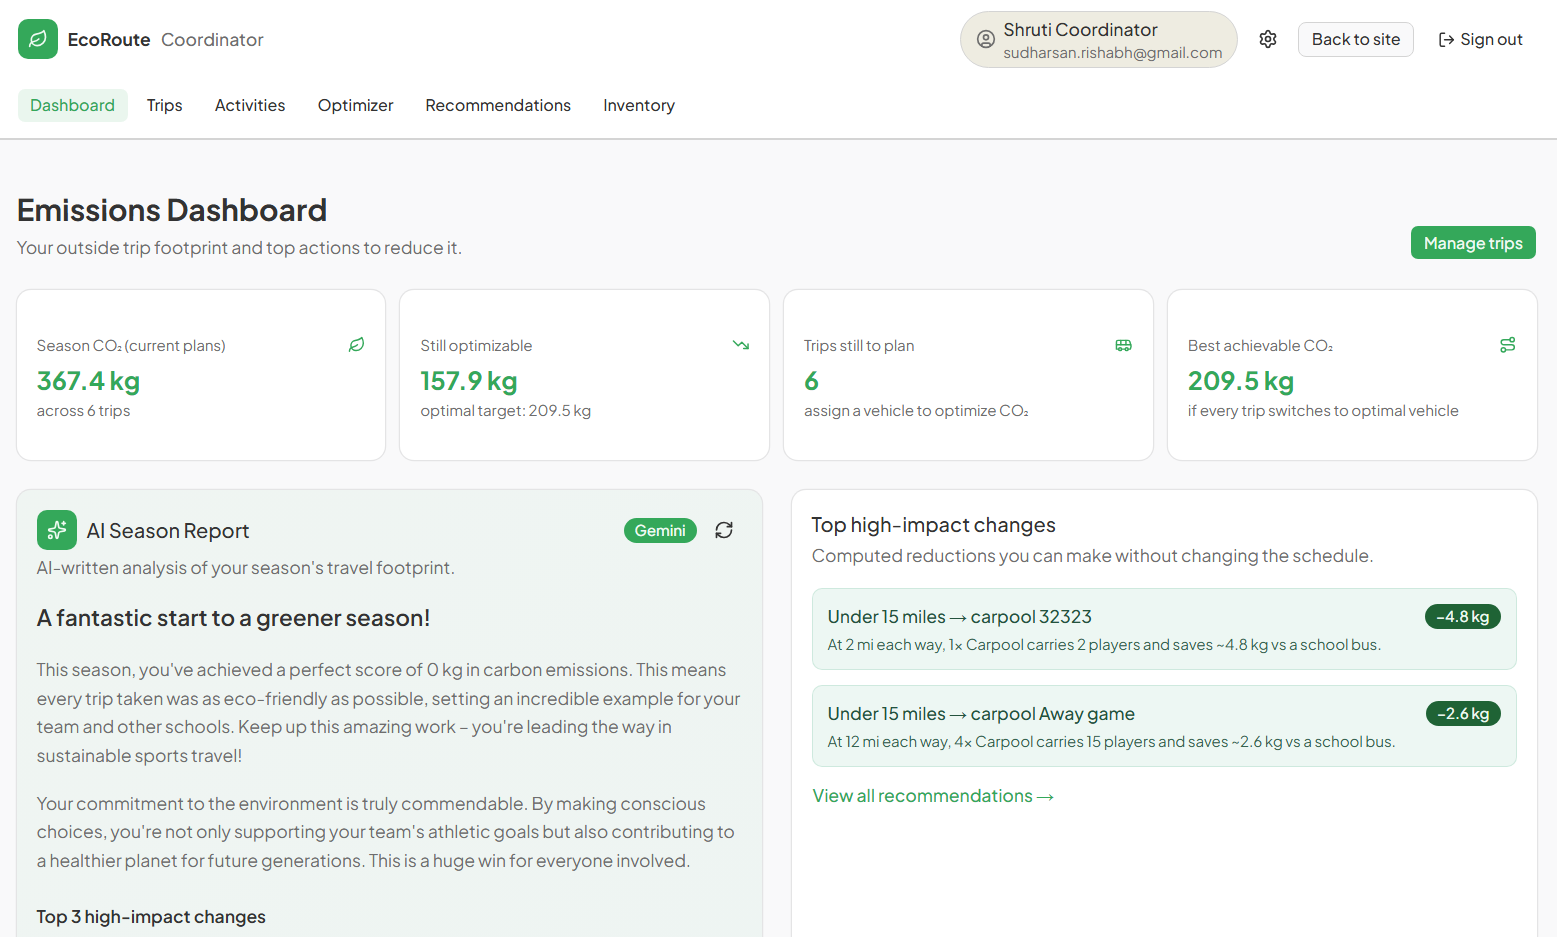
EcoRoute makes a school's transportation footprint visible, measurable, and actionable. The platform runs on two purpose built dashboards backed by one shared engine, each showing only the information relevant to its user while staying interconnected through the same underlying emissions data. The Coordinator Dashboard is the AI core, built for coaches and activity staff. Coordinators enter an away event schedule (location, distance, roster size, available vehicles, departure time), and for each trip the Trip Vehicle Optimizer evaluates every possible vehicle configuration, computes the CO2 of each using EPA emissions factors and fleet MPG estimates, and recommends the lowest-emission option. The Vehicle Load Optimizer decides whether one full bus, two half-buses, vans, carpools, or a mixed setup is greenest for that specific roster and distance, and Smart Recommendations layer in distance-based guidance (carpools for short hops, vans for medium trips, a consolidated bus for long hauls). Gemini 2.5 Flash explains why each recommendation is the most eco-friendly choice, and the Season Emissions Dashboard rolls every trip into the school's total season CO2, its highest-impact changes, per-game footprint, and a year-over-year comparison. The Student and Parent Dashboard supports daily commuting and home-game travel. Families enter their neighborhood or nearest intersection, commute method, and available seats, then browse a privacy-safe directory of nearby families (matched on ZIP and neighborhood only, never exact addresses) to self-organize carpools and find the best partners for their route and schedule. Keeping families in control of who rides with whom preserves safety and privacy while still surfacing carpool opportunities they would otherwise miss. Although the two dashboards present different views, they draw on the same emissions logic, so a coordinator's season planning and a family's daily commute are measured on one consistent scale. The platform cuts total vehicle-miles and shifts trips to lower-emission vehicles in three ways. First, it consolidates travel by recommending the single greenest vehicle configuration per trip instead of defaulting to whatever is convenient, which can be the difference between one efficient bus and several cars covering the same route. Second, the carpool directory reduces the number of separate vehicles making the same daily and home-game trips by helping nearby families ride together. Third, by making the school's footprint visible at the trip and season level, it turns abstract sustainability goals into concrete, trackable reductions coordinators and families can act on. The result is fewer miles driven, fewer high-emission vehicles on the road, and a measurable drop in the school's transportation carbon footprint.
How we built it
Next.js 16 App Router — Server components fetch trip and emissions data at request time so coordinators always see up to date numbers without client side loading states. Interactive pieces like the trip optimizer, activity calendar, and carpool clusters run as client components.
Supabase (PostgreSQL) — A relational schema ties together coordinators, trips, activities, events, and student subscriptions. Row level data is scoped by coordinator email so each school only sees its own data. We use Supabase's JS client server side for secure reads and writes without exposing credentials.
Google Gemini 2.5 Flash — Powers two features: a per-trip insight that explains in plain language why a specific vehicle is the greenest choice, and a report that summarizes the coordinator's full footprint and top three actions to reduce it.
Custom emissions model — Rather than relying on a third-party API, we built a rule-based optimizer using EPA CO₂ per gallon constants and fleet MPG estimates (school bus ~7 mpg, van ~18 mpg, carpool ~28 mpg). For any trip it computes CO₂ across all vehicle configurations, ranks them, and surfaces the optimal choice alongside the bus baseline for comparison.
Vercel — Deployed via Vercel's serverless functions with API keys stored as encrypted environment variables. Each push to main triggers a production build and the environment specific secrets ensure the Supabase and Gemini keys never touch the client side.
Challenges we ran into
One of our biggest challenges was designing a system that would serve two very different user groups. One of our user groups are students and parents who form neighborhood carpool clusters for daily commute. Our other user group consists of coaches or club moderators who optimize team travel for events that are not held at the school. Since both of these groups have different goals, we needed to ensure that both were being supported through the platform. We addressed this by building dedicated pages for each. The coach dashboard focused on travel planning for the season, vehicle load optimization, and breakdown of emissions, while the student/parent dashboard focused on carpools, neighborhood clustering, and commute mapping. Both of the pages are still deeply interconnected, but each is tailored to present only the information that is most relevant to its audience. Another challenge that we faced was building a carpool database while not requiring precise home addresses. Although we wanted the clusters to be as accurate as possible, we wanted to protect the privacy of users so that they would not immediately have to put their exact home address. As a result, the carpool database feature relies only on zipcode and neighborhood/city instead of an exact address. Our AI can even suggest your neighborhood automatically from your ZIP code alone, making the process even faster while still keeping your personal location data private until the carpool group is finalized. On the technical side, we hit Claude Code's context limit, which forced it to compact its understanding of our app. As a result, Claude began tailoring new features to the wrong parts of the codebase, producing implementations that didn't match what we'd asked for. To fix this, we created a memory.md file that Claude references while making changes, ensuring it retains the key ideas and context it would otherwise lose.
Accomplishments that we're proud of
We are proud to have built a platform that meaningfully advances environmental sustainability in schools while demonstrating responsible AI design. Our system empowers students, parents, and coaches to make cleaner transportation choices through clear environmental analytics, personalized commute insights, and optimized event travel planning. We successfully integrated human‑in‑the‑loop decision making to ensure safety and trust, while still leveraging AI to reduce emissions and improve efficiency. We also created a dual‑dashboard experience, one for students and families, and one for coordinators, that brings the entire school community together around sustainability. Most importantly, we built a solution that is practical, scalable, and capable of making a real environmental impact in schools today.
What we learned
Building EcoRoute taught us that creating a platform means nothing if the people using it do not understand or trust it. We learned that transparency should always be a core feature; when users can see exactly why the AI recommends vans over a bus, or why a particular carpool cluster was formed, they would be far more likely to act on it. We also learned to ask harder questions about who might be left out, because a system that ignores accessibility needs or even assumes that every family has a car is not truly serving its community. Responsible AI design means confronting those gaps before we even start writing a line of code. On a technical level, our team was able to gain hands-on experience in integrating real environmental data from sources like the EPA, as well as building AI-powered carpool database systems. However, our most lasting takeaway from this project was that everyday decisions like how you get to school or an away event is exactly where environmental change starts, and we are capable of building the tools to make that change happen.
What's next for EcoRoute
- Precise carpool mapping— replace neighborhood text labels with actual coordinates (Google Maps API) for more accurate carpool grouping.
- Live commute tracking — students log daily distance traveled to get more accurate CO2 emissions rather than estimates based on typical travel time from city to city. This will allow for better optimization of less carbon emitting vehicles on the road.
- Parent/driver portal — coordinators invite parent drivers
- Mobile app — push notifications for trip changes, carpool pickup reminders
Built With
- claude
- cursor
- gemini-2.5-flash
- next.js
- node.js
- postgresql
- supabase
- typescript
- vercel


Log in or sign up for Devpost to join the conversation.