Inspiration
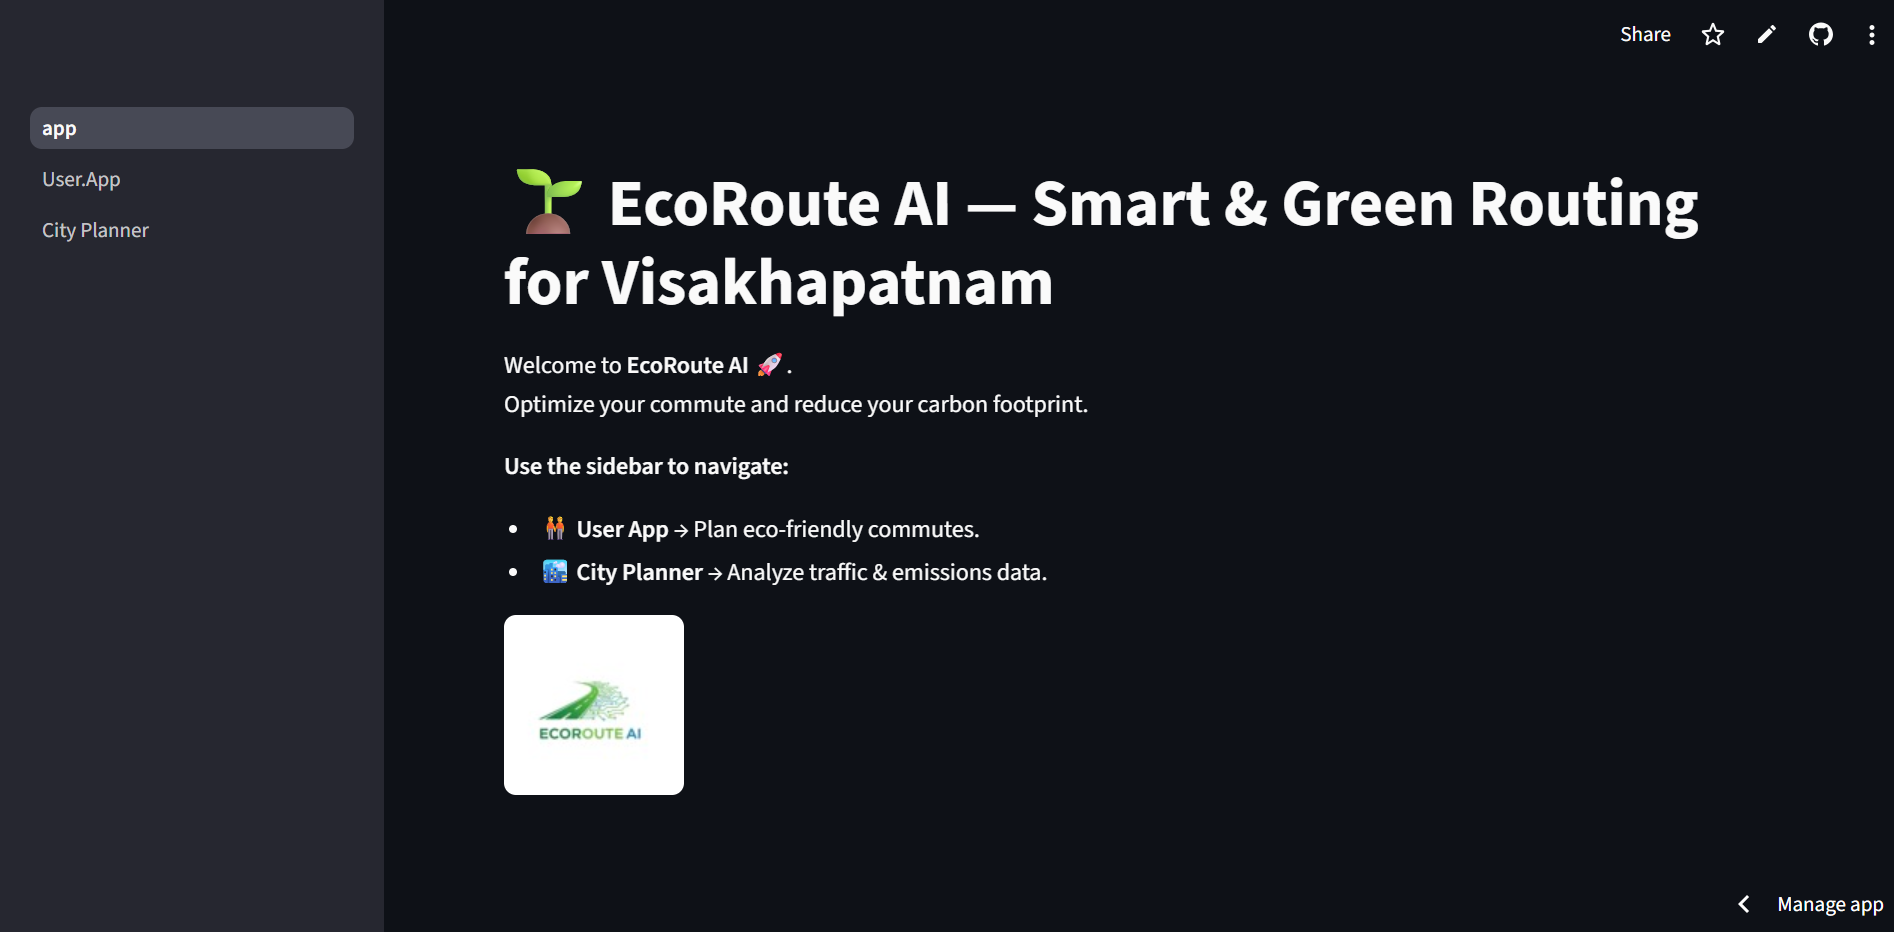
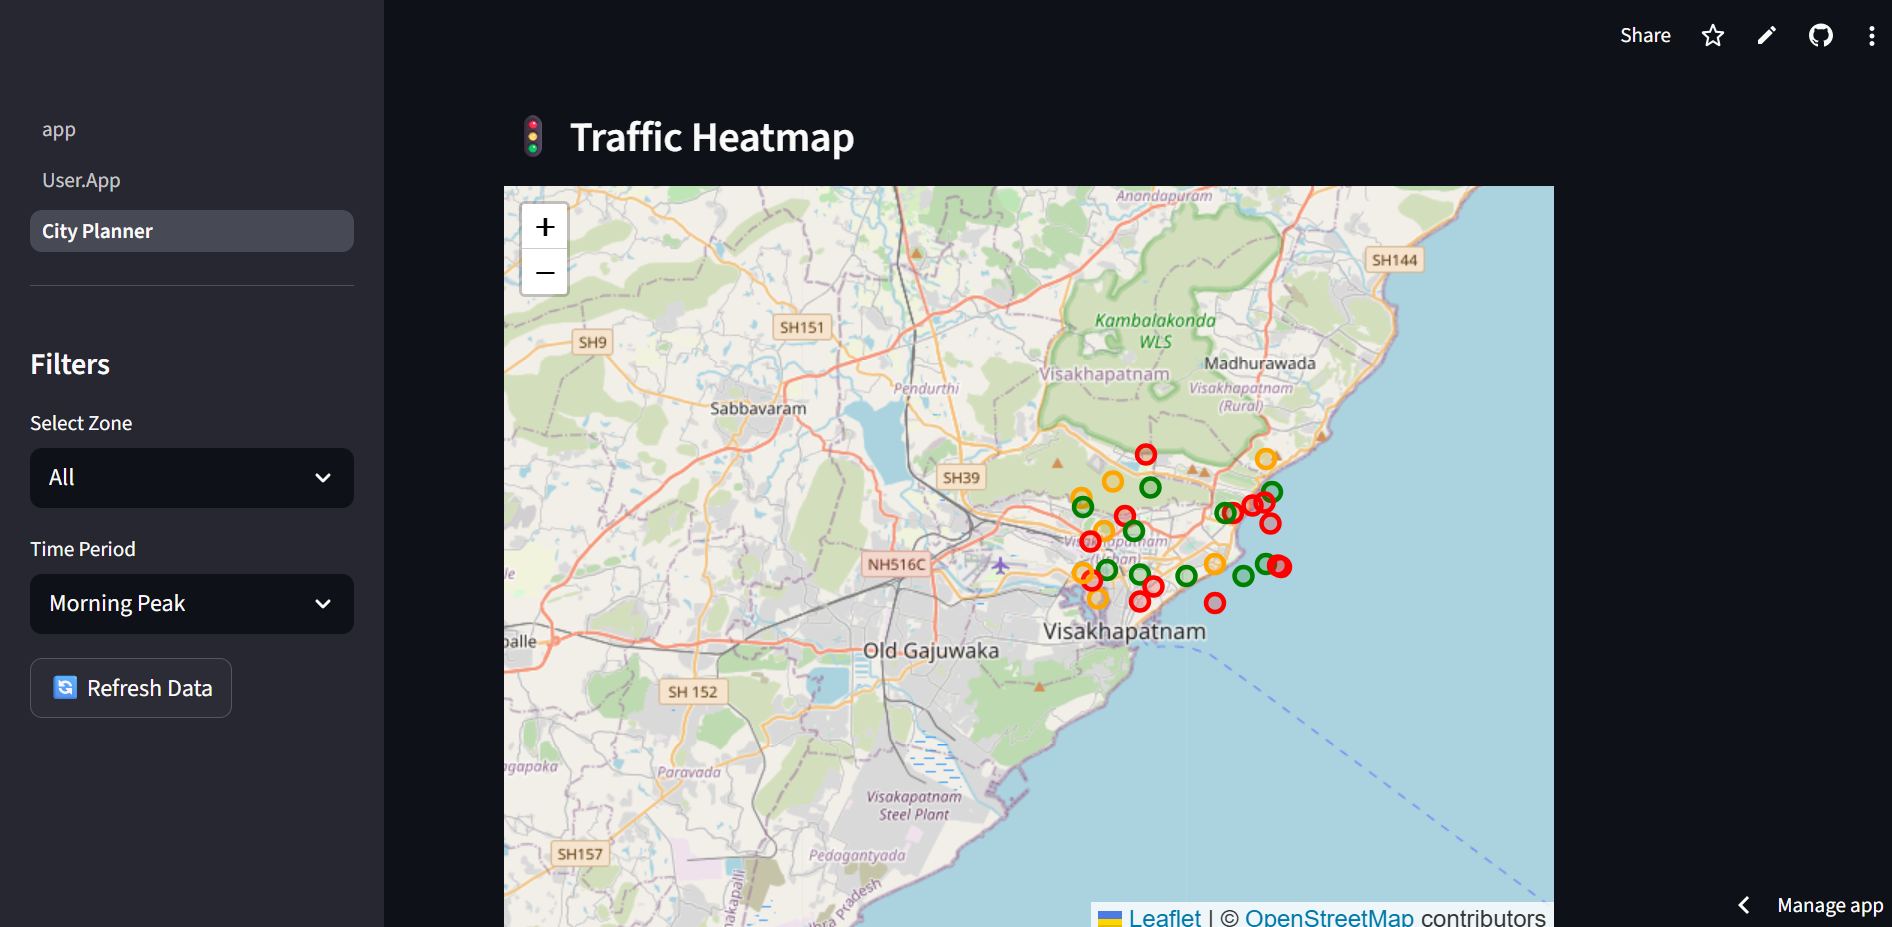
EcoRoute AI is a smart city initiative that provides an interactive dashboard to visualize traffic congestion, estimate CO₂ emissions, and optimize routes. It helps city planners, commuters, and analysts make data-driven, eco-friendly decisions. The platform supports multiple city zones, time-based traffic analysis, and real-time or simulated data, enabling smarter urban mobility and reduced environmental impact.
What it does
EcoRoute AI is a smart city dashboard that helps visualize traffic congestion, estimate CO₂ emissions, and provide optimized eco-friendly routes.
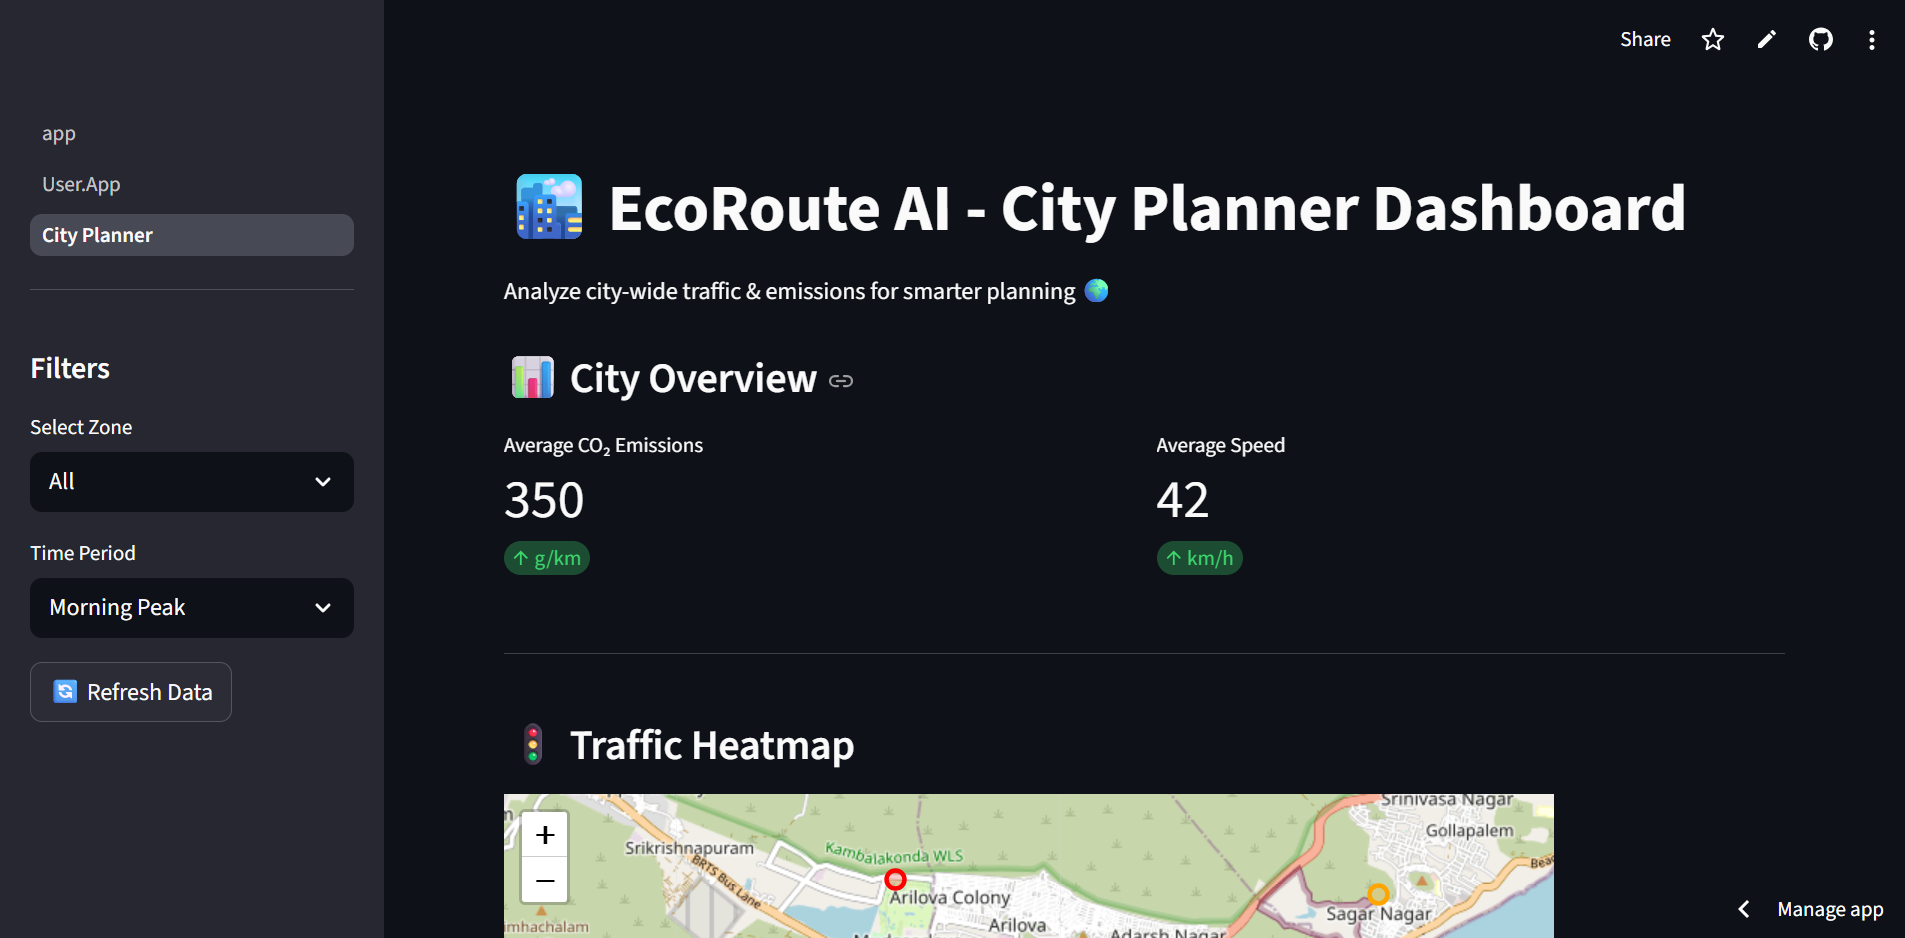
Users can explore traffic data across different zones (North, South, East, West) and time periods (morning, afternoon, evening, night).
The dashboard displays an interactive city map with congestion levels and hotspots.
Provides key city metrics such as average CO₂ emissions and average traffic speed.
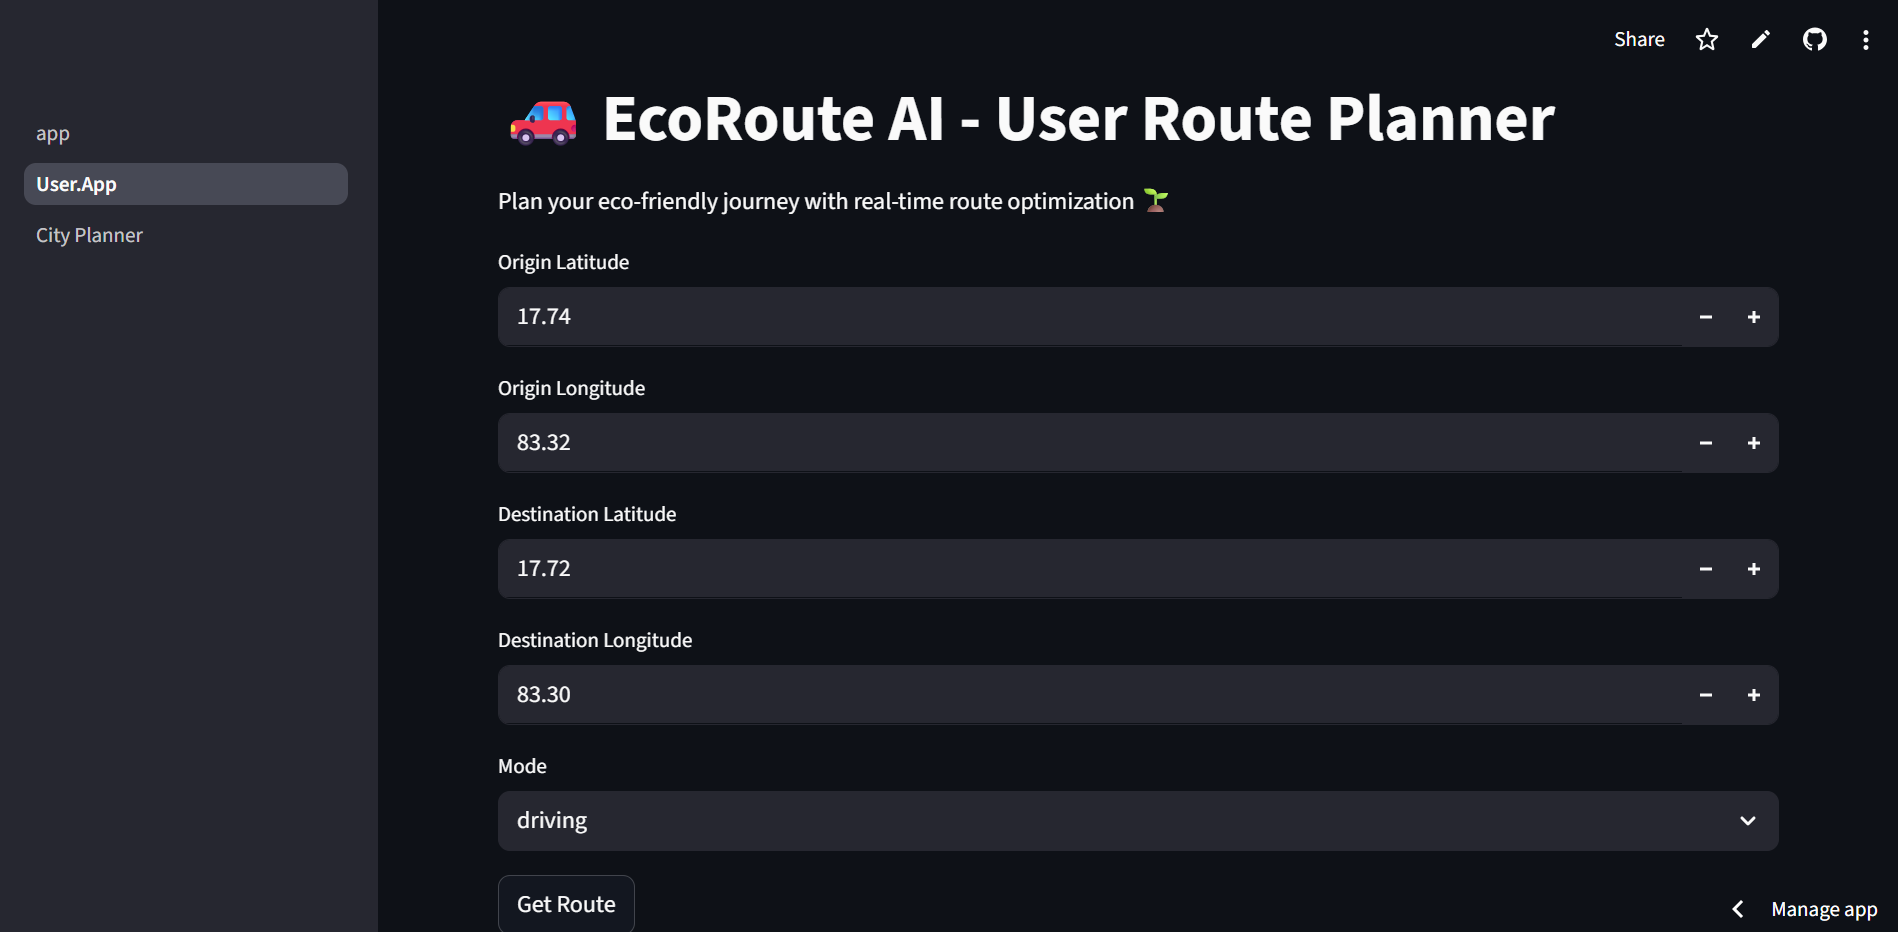
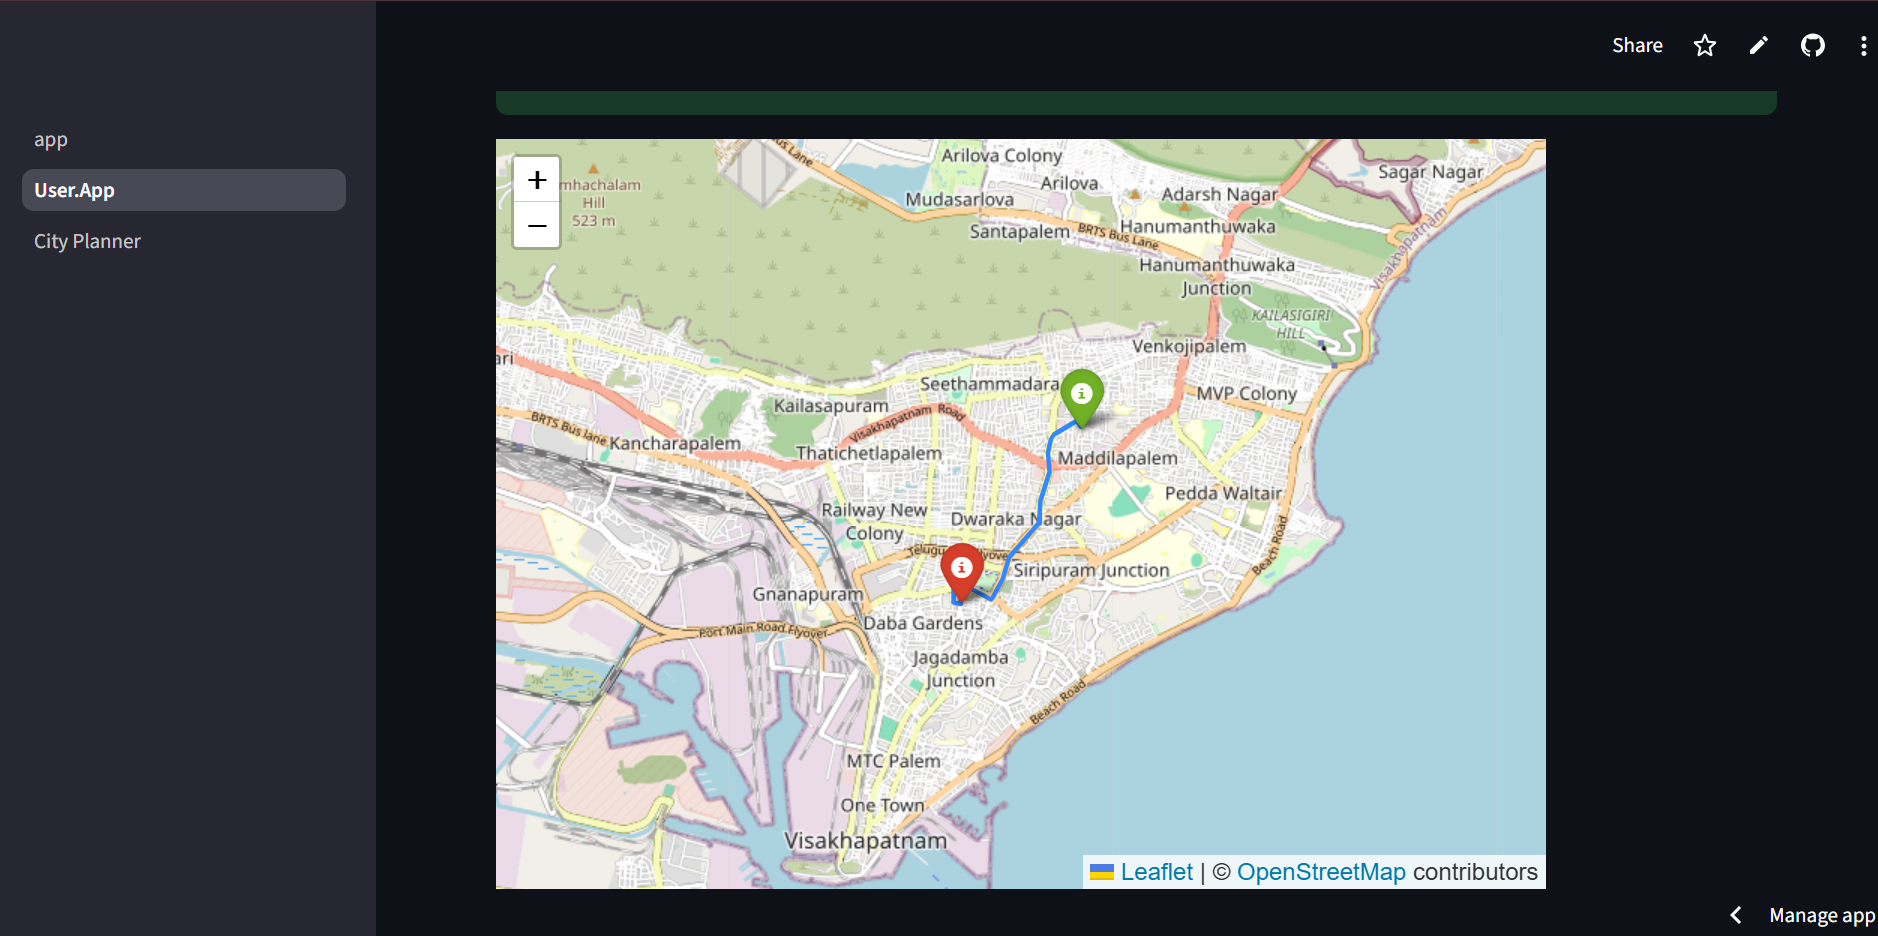
Designed for both city planners (to make policy decisions) and commuters (to plan eco-friendly routes).
Uses demo data now, but can be extended to connect with live traffic and emissions APIs.
How we built it
We developed EcoRoute AI using Python and Streamlit to build an interactive, multi-page dashboard. For visualization, we integrated Folium and Streamlit-Folium to render live traffic maps. Pandas and NumPy were used for data handling and analytics. The app is hosted on Streamlit Cloud, and we used GitHub Actions to keep it active by running periodic pings.
Challenges we ran into
Handling real-time traffic & emissions data integration was complex due to API limitations.
Streamlit apps tend to sleep after inactivity, requiring a workaround to keep it alive.
Maintaining stable map visualizations without “flicker” or reset issues.
Coordinating multiple pages and modules smoothly in one Streamlit deployment.
Accomplishments that we're proud of
Built a functional city planner dashboard with interactive maps and congestion visualization.
Created a modular architecture that can scale to real APIs in the future.
Successfully deployed the app on Streamlit Cloud with an automated uptime solution.
Designed a clean and user-friendly UI to make insights accessible to both planners and commuters.
What we learned
How to build multi-page Streamlit apps with shared states and stable performance.
Practical experience in geo-visualization using Folium & mapping libraries.
Workflow automation with GitHub Actions for deployment maintenance.
Importance of clear UI/UX in making complex data understandable.
What's next for EcoRoute AI
Integrating live traffic and CO₂ emissions APIs for real-time insights.
Adding machine learning models to predict congestion trends and emissions hotspots.
Expanding to include multi-modal transportation planning (public transit, cycling, EV charging).
Offering city-wide dashboards for municipal governments to support climate goals.
Scaling the platform for smart city deployments across multiple regions.

