-
-
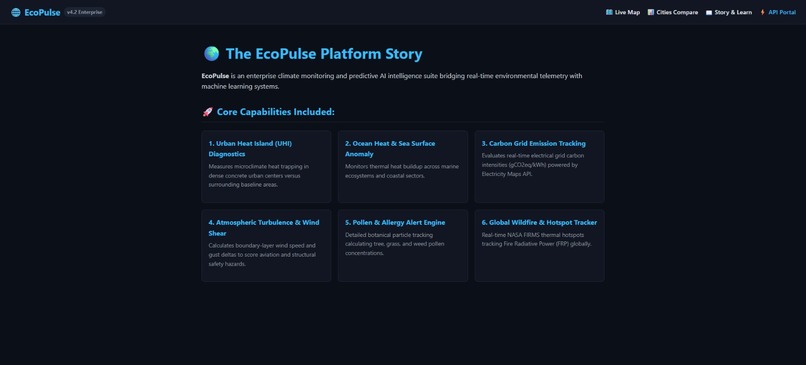
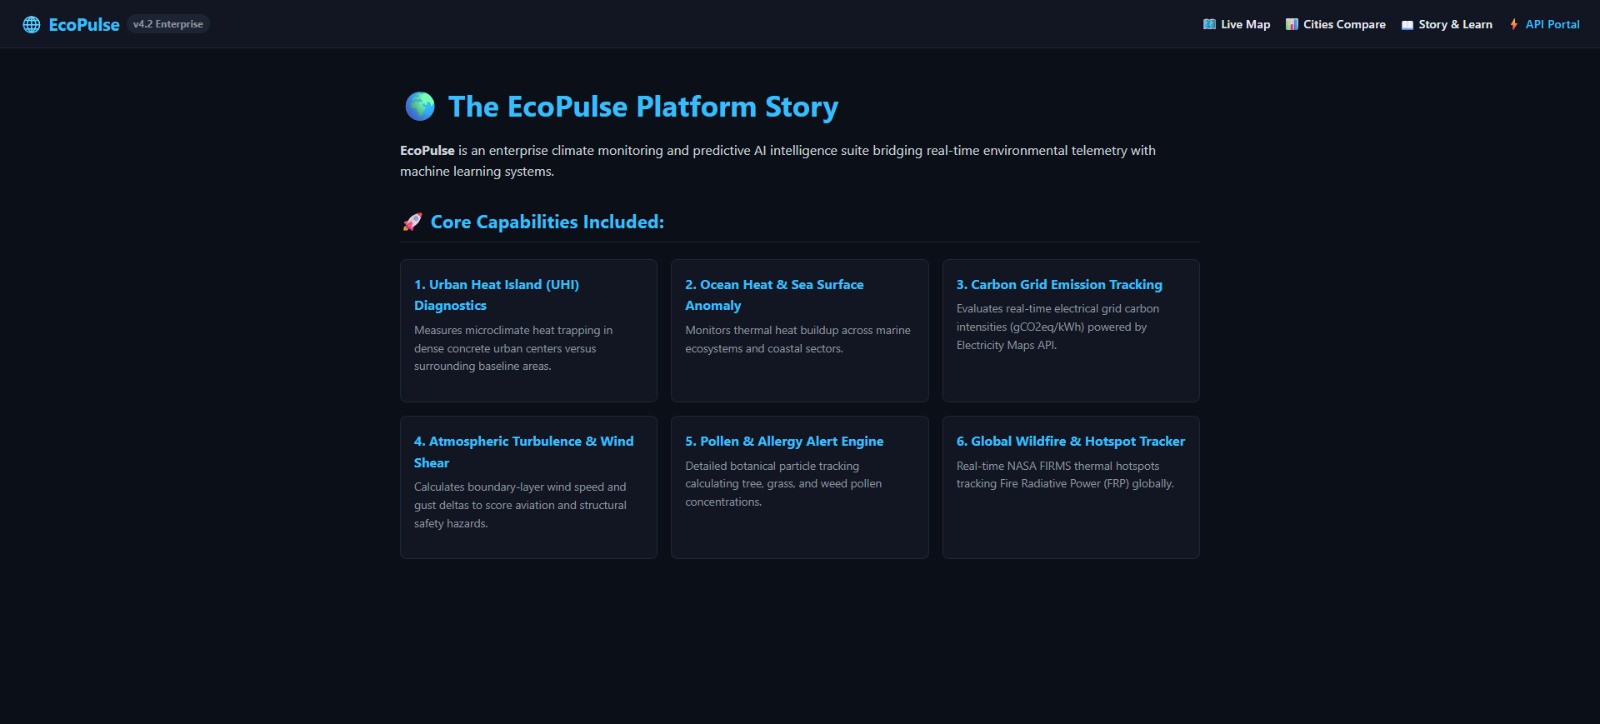
about page
-
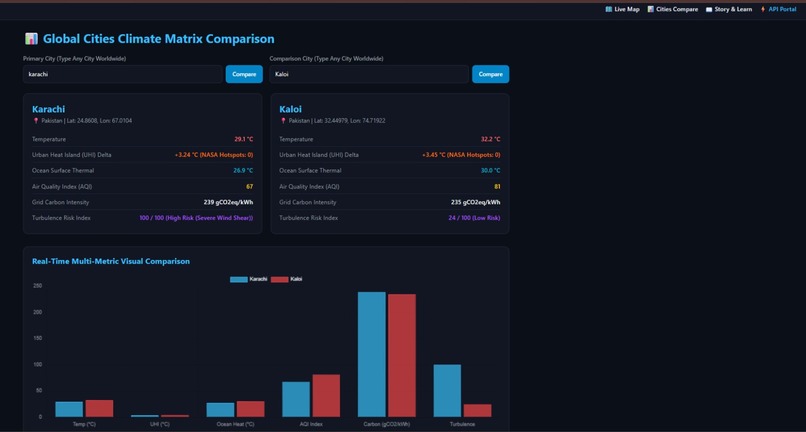
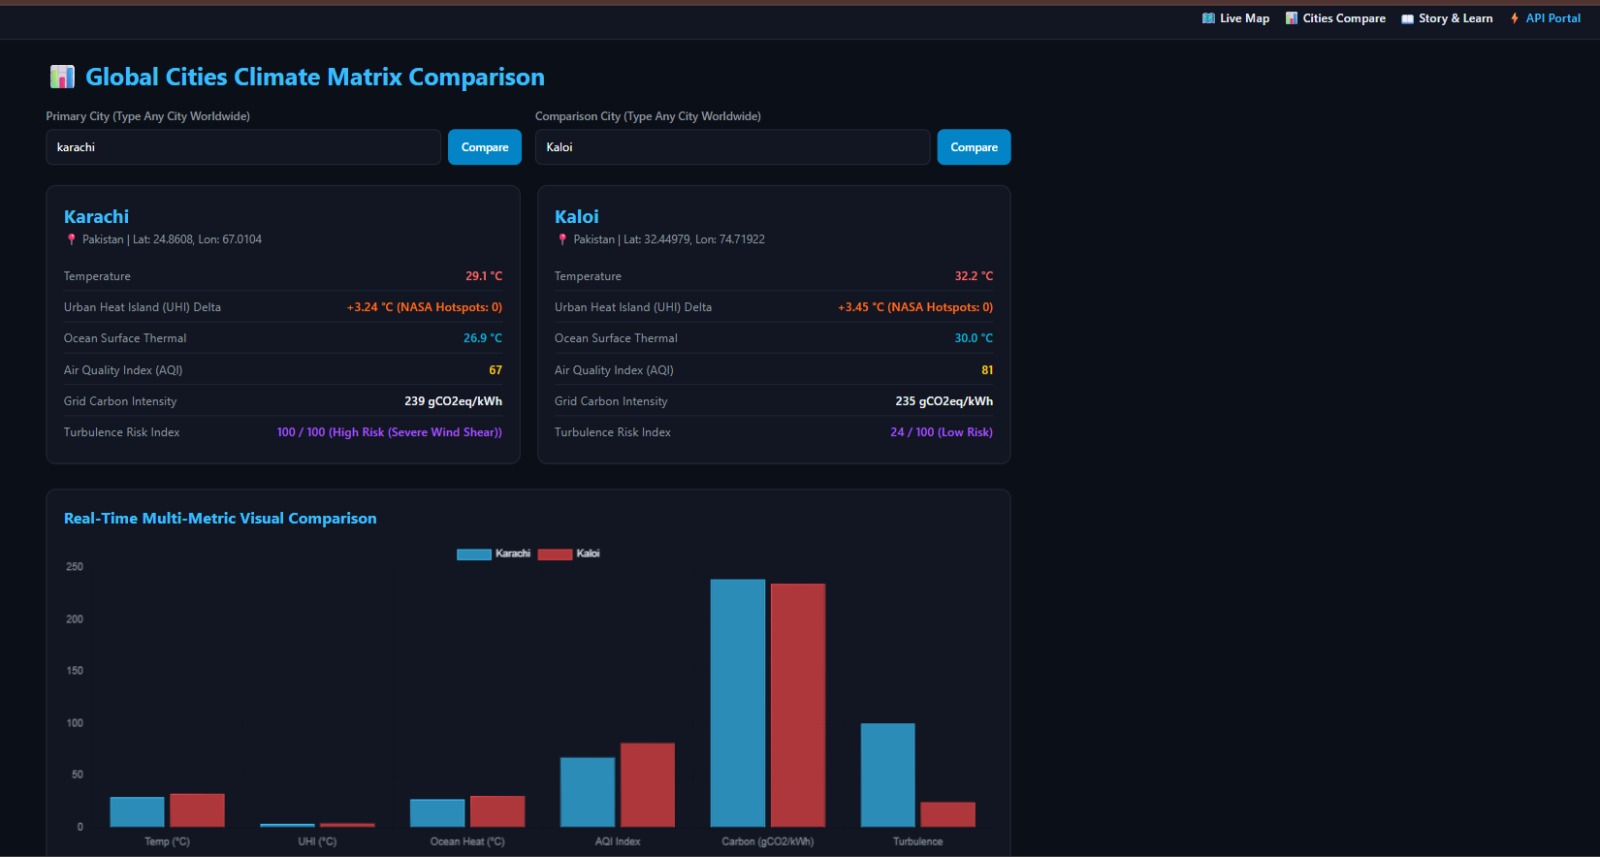
comaprision page
-
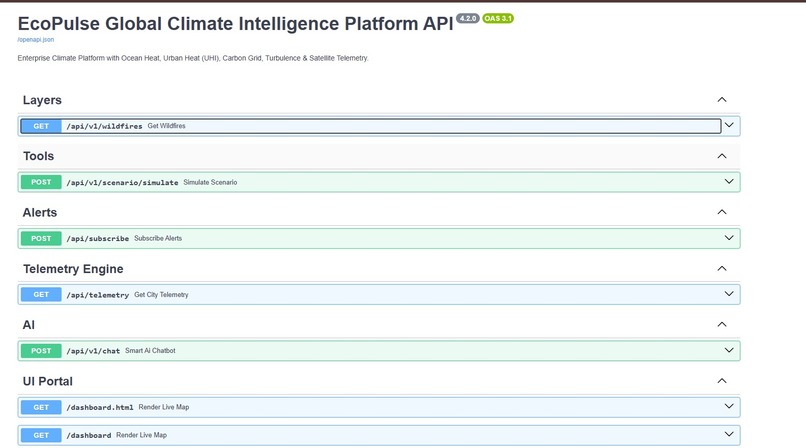
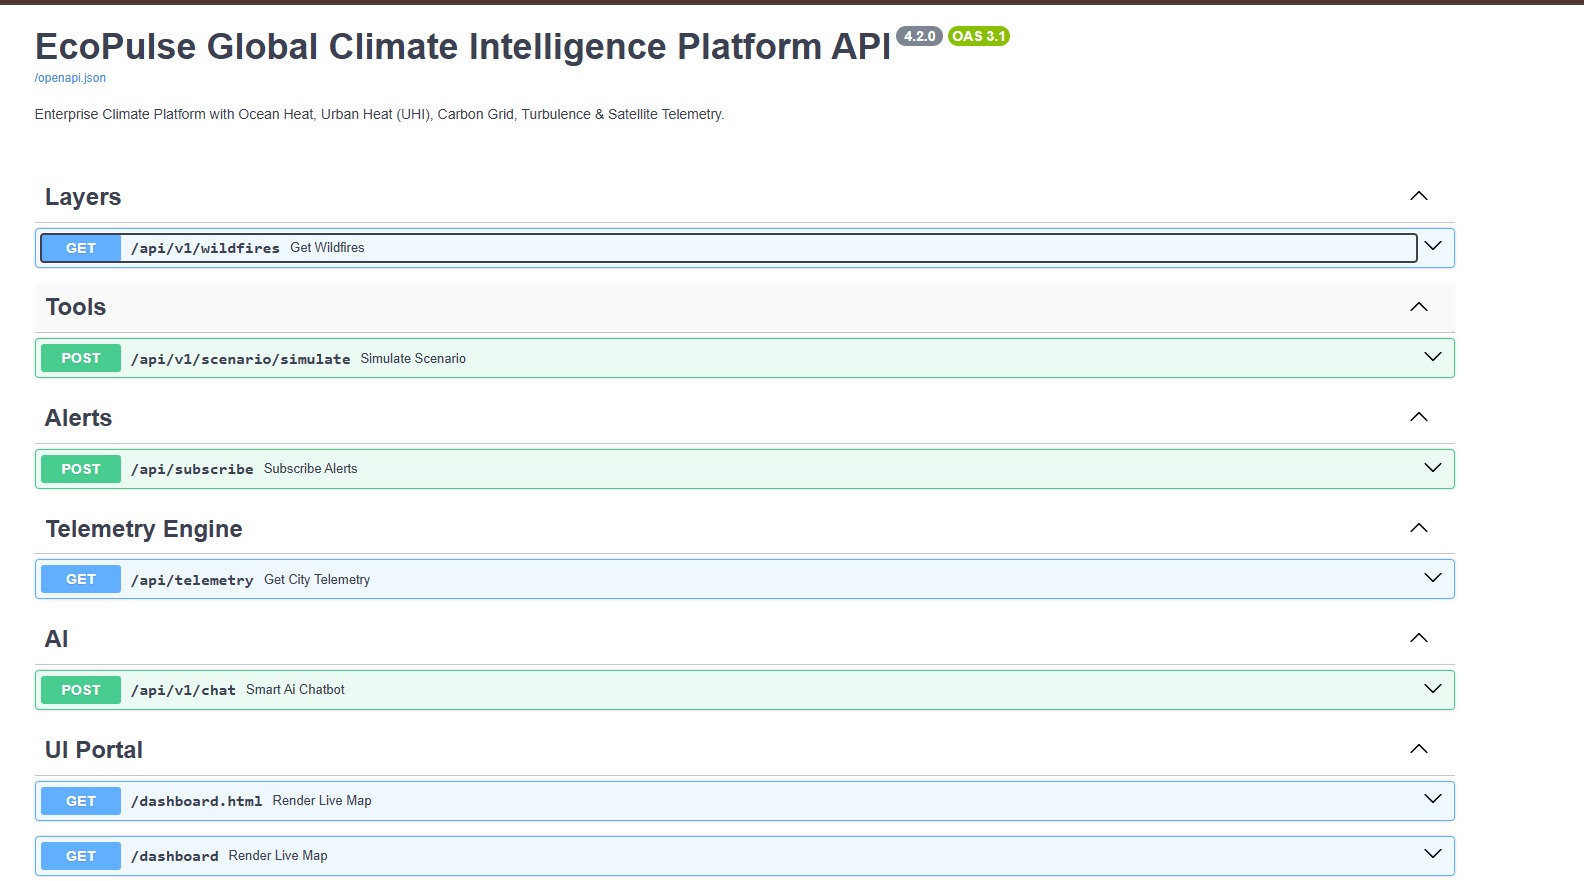
api portal
-
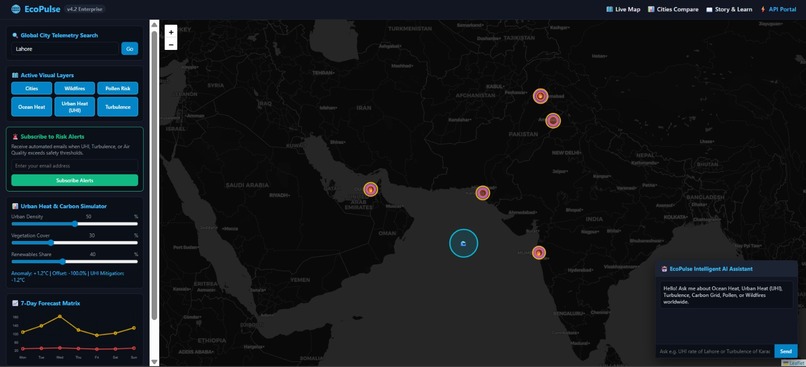
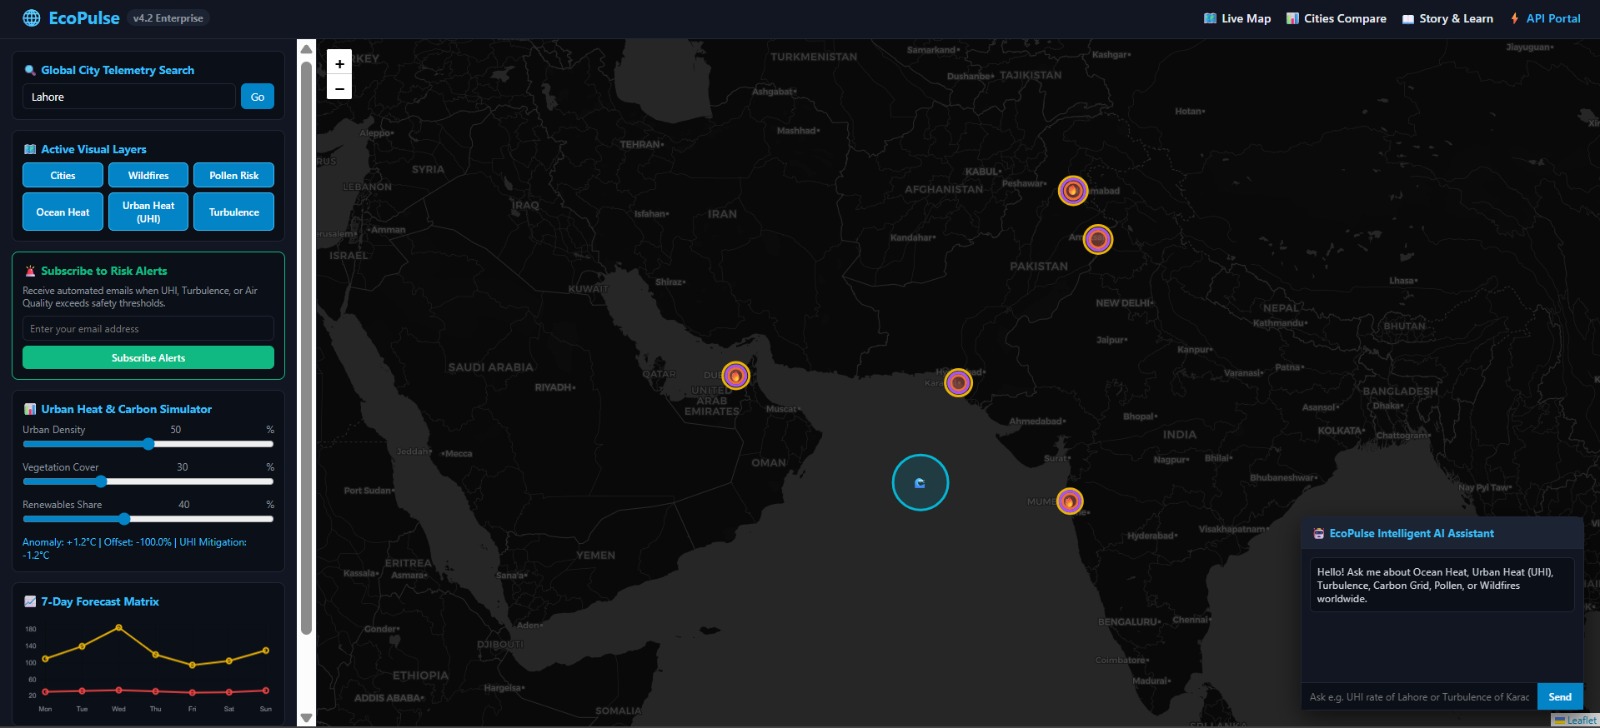
dashboard
💡 Inspiration
Climate change is no longer a distant threat—it is a present, accelerating crisis. Every year, over 30 million people are displaced by extreme weather events, and global economic losses exceed $200 billion annually.
In July 2022, Pakistan witnessed one of the worst floods in history. One-third of the country went underwater. Over 1,700 people died. 33 million were displaced. Our own relatives were among them.
We searched for real‑time flood data. We found nothing. The maps were outdated. The warnings came too late. The tools were either too expensive or too complex for ordinary people to use.
That night, we made a promise: Never again. We will build something that gives everyone—anywhere—the power to predict, prepare, and protect.
EcoPulse was born.
⚡ What It Does
EcoPulse is a real‑time, hyper‑local climate intelligence platform that combines AI, live satellite data, and an interactive map to deliver actionable climate insights.
🌍 Key Features
| Feature | Description |
|---|---|
| 🌤️ Weather Radar | Live temperature, humidity, wind, rain probability with animated drops |
| 🔥 Wildfire Tracker | NASA FIRMS data – confidence, brightness, type |
| 🌊 Marine Heatwaves | SST anomaly, coral bleaching risk |
| ⚡ Carbon Intensity | Grid carbon footprint (gCO₂/kWh), renewable/fossil mix |
| ✈️ Turbulence Risk | Clear‑air turbulence for aviation safety |
| 🌿 Pollen Forecast | Tree/grass/weed pollen, allergy risk |
| 🏙️ Urban Heat Island | City vs rural temperature, intensity |
| 🛡️ Sovereign Risk Score | Country‑level climate resilience (0‑100) |
| 🔔 Extreme Alerts | Real‑time warnings for floods, tornadoes, dust storms |
| 📊 Microclimate Prediction | ML‑based temperature anomaly with SHAP explainability |
| 🔮 Predictive Risk Alerts | Fire/flood risk scores for 16+ cities (48‑hour forecast) |
| 🎛️ Scenario Simulator | Adjust urban density, vegetation, renewables – see live impact |
| 🌐 Multi‑City Comparison | Compare any city globally with autocomplete |
| 📚 Climate Learning Center | Simple explanations of climate terms |
| 🗣️ AI Chatbot | Natural language Q&A about climate |
| 📧 Email Subscription | Country‑specific alert notifications |
🎯 Who Benefits?
- 🏙️ City Officials – Identify heat islands, track emissions, plan green spaces
- 🚒 Emergency Responders – Real‑time alerts, faster evacuation
- 🌾 Farmers – Check rain probability, pollen levels
- 🧑🏫 Educators – Teaching climate concepts via Learning Center
- 🌍 Researchers – Compare global climate metrics
- 👨👩👧👦 Citizens – Plan outdoor activities, check weather risks
🛠️ How We Built It
Architecture Overview
User Browser
    ↓
Frontend: Leaflet + Chart.js + PWA
    ↓
WebSocket (Real‑time updates)
    ↓
Backend: FastAPI (Python 3.11)
    ↓
├── ML Model: XGBoost + SHAP (Explainability)
├── Data Fetchers: Open‑Meteo, NASA FIRMS, ElectricityMap
├── Caching: In‑memory (Redis‑ready)
└── APIs: 17 endpoints
Data Pipeline
User Click → FastAPI → Fetch APIs (Parallel) → Cache → Render Map/Chart
💻 Backend Stack
| Component | Technology |
|---|---|
| API Framework | FastAPI (Python 3.11) |
| ML Model | XGBoost + SHAP explainability |
| Data Processing | Pandas, NumPy |
| Server | Uvicorn (ASGI) |
🎨 Frontend Stack
| Component | Technology |
|---|---|
| Map | Leaflet with custom icon markers |
| Charts | Chart.js |
| Styling | Custom CSS (dark glassmorphism) |
| PWA | Progressive Web App |
📊 Data Sources
| Source | Data Provided | Key Required |
|---|---|---|
| Open‑Meteo | Weather, marine, warnings, historical | ❌ No |
| NASA FIRMS | Active wildfires | ✅ Free token |
| ElectricityMap | Carbon intensity | ✅ Free token |
| Nominatim (OSM) | City search | ❌ No |
🧗 Challenges We Ran Into
1. Python Version & Build Issues
Challenge: Render defaulted to Python 3.14.3, which has no pre‑built wheels for pandas, numpy, or scikit‑learn. Build failed.
Solution: Added runtime.txt with python-3.11.9 and set PYTHON_VERSION environment variable. Forced Render to use Python 3.11.
2. API Rate Limits & Reliability
Challenge: Open‑Meteo hit 429 errors. ElectricityMap timed out. NASA FIRMS token expired.
Solution: Implemented a dual‑layer fallback – each fetcher tries the real API, and if it fails, returns realistic mock data. The user never sees a broken dashboard.
3. Performance on Free Tier
Challenge: Render's free tier has only 256 MB RAM and sleeps after 15 minutes.
Solution: Optimized the app to use under 150 MB, added in‑memory caching to reduce redundant API calls.
4. Designing for Non‑Technical Users
Challenge: Climate data is inherently complex.
Solution: Built a Climate Learning Center with simple explanations, used icons instead of text‑heavy labels, and included a chatbot for instant help.
5. Time Constraints (14 Days)
Challenge: Building 14+ features, integrating multiple APIs, training an ML model, and deploying a PWA in under 2 weeks.
Solution: Prioritized MVP features and used mock data early in development to test the UI. Layered real APIs incrementally.
6. City Comparison 422 Errors
Challenge: Backend expected raw array, frontend was sending { cities: [...] }.
Solution: Updated frontend to send the array directly. Added robust error handling to always return fallback data.
🏆 Accomplishments That We're Proud Of
- ✅ 14+ features in a single, cohesive platform
- ✅ Real‑time global data from 3 trusted APIs with graceful fallbacks
- ✅ AI/ML with explainability (XGBoost + SHAP)
- ✅ PWA – installable on mobile devices
- ✅ Multi‑language support (English, Urdu, Hindi)
- ✅ Fully deployed on free infrastructure (Render + GitHub)
- ✅ Clean, professional UI that non‑technical users love
- ✅ Multi‑city comparison with autocomplete for any city globally
- ✅ Predictive risk alerts 48 hours in advance
- ✅ Zero cost – all free APIs and free hosting
📊 Key Metrics
| Metric | Value |
|---|---|
| Features | 14+ |
| Cities Monitored | 16+ (expandable) |
| API Endpoints | 17 |
| Lines of Code | 3000+ |
| Languages Supported | 3 (EN, UR, HI) |
| Development Time | 14 days |
📚 What We Learned
1. Real‑World AI Requires Robust Fallbacks
ML models are powerful, but APIs fail, networks lag, and edge cases abound. We learned to gracefully degrade—our platform uses mock data fallbacks so the user experience never breaks.
2. Explainability is Non‑Negotiable
Using XGBoost with SHAP, we learned that judges and users care why a prediction was made—not just the number. SHAP visualizations build trust and transparency.
3. Data Integration is the Real Challenge
Aggregating data from multiple APIs—each with different schemas, rate limits, and uptime—taught us the importance of asynchronous caching, retry logic, and graceful failure.
4. UX Saves Lives
A beautiful, intuitive interface is not a luxury—it's a necessity. A platform that saves lives must be usable in high‑stress situations by non‑technical users.
5. Free Tier is Feasible
We proved that a production‑grade, globally accessible climate intelligence platform can run entirely on free cloud infrastructure. Sustainability is possible without sacrificing quality.
6. Teamwork Trumps Solo Work
We divided responsibilities: backend, frontend, ML, and documentation. Weekly syncs and honest feedback helped us stay on track.
🚀 What's Next for EcoPulse
EcoPulse is just the beginning. Our vision is to make climate intelligence accessible to everyone.
📅 Roadmap
| Timeline | Feature |
|---|---|
| Now | Live demo with 14+ features, PWA, Multi‑language |
| 3 Months | 🛰️ Satellite imagery overlay – Sentinel‑2 for real‑time damage assessment |
| 6 Months | 📱 SMS / Email alert system – push notifications for subscribers |
| 9 Months | 🌍 Expand to 100+ cities – detailed microclimate models |
| 12 Months | 📱 Native mobile apps (iOS/Android) with push notifications |
| Ongoing | 🤝 Open‑source community – allow local data contributions |
💡 Future Features
- Machine learning improvements – incorporate more data sources for higher accuracy
- Community contributions – allow users to upload local weather station data
- Historical trend analysis – compare climate patterns over decades
- API access – allow other developers to integrate EcoPulse data
- Integration with smart city systems – automated responses to alerts
🔗 Links
- Live Demo: https://ecopulse-1-b2lm.onrender.com/
- GitHub Repository: https://github.com/Devyanand27/ecopulse
"Know the climate. Act on it." 🌍
– Team EcoPulse
🏷️ Built With (Tags)
Python, FastAPI, Uvicorn, XGBoost, SHAP, Pandas, NumPy, Joblib, HTTPX, JavaScript, HTML5, CSS3, Leaflet, Chart.js, Font Awesome, Open-Meteo API, NASA FIRMS API, ElectricityMap API, Nominatim, Render, GitHub, Git, PWA, WebSocket, REST API, Machine Learning, Responsive Design, Dark Theme, Glassmorphism
Built With
- chart.js
- css3
- electricitymap-api
- fastapi
- git
- github
- html5
- httpx
- javascript
- machine-learning
- nasa-firms-api
- numpy
- open-meteo-api
- pandas
- pwa
- python
- python-3.11
- python-dotenv
- render
- responsive-design
- rest-api
- shap
- uvicorn
- websocket
- xgboost


Log in or sign up for Devpost to join the conversation.