-
-
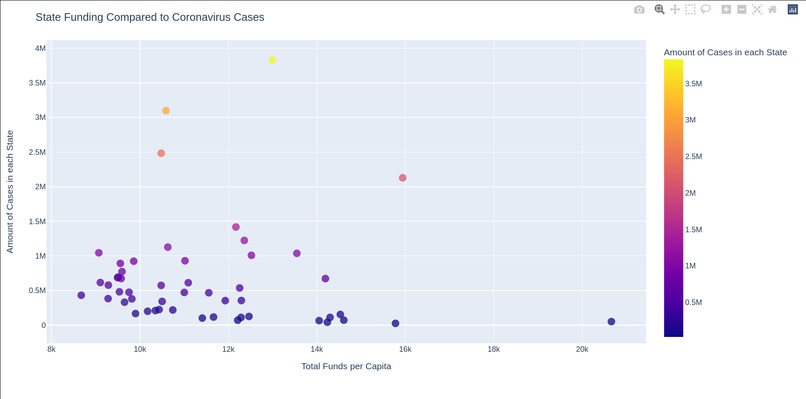
A preview of the first visualization
-
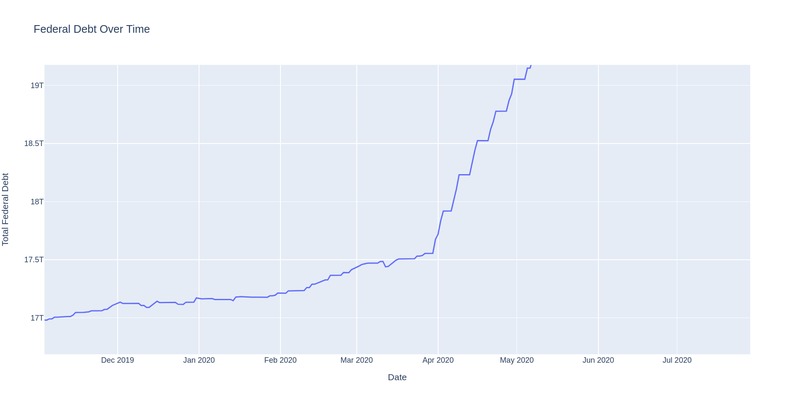
A preview of the second visualization


Inspiration
My inspiration for choosing this topic was my curiosity about economics as well as my interest to visualize and see the clear impact of coronavirus on the US economy.
What it does
For the explanation video of my visualizations, use this link.
How we built it
Both of my visualizations utilize python and plotly to create interactive, web-based graphs. My first project, based on comparing the state funding to Covid-19 cases, can be found here. My second visualization, which shows the federal debt over a span of 5 years, can be found here.
Challenges we ran into
There were actually a few challenges that I ran into with this hackathon. Firstly, because I am quite young, I am going to an intermediate high school. Due it not recognizing my school, I was not able to use the free Tableau offer, requiring me to use just programming and libraries. Secondly, I had more of a personal struggle managing my time, which led to me only being able to create two visualizations.
What we learned
I have learned quite a bit about data science and visualizing during this hackathon. In addition, I have learned about a few very useful libraries, such as plotly for python or R and leafllet for Javascript.
Sources
- Vizathon 2021 Spending Visualization
- Vizathon 2021 Debt Visualization

Log in or sign up for Devpost to join the conversation.