-
-
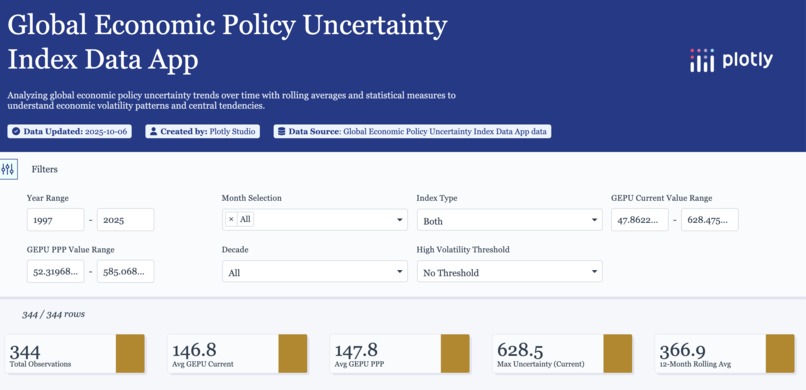
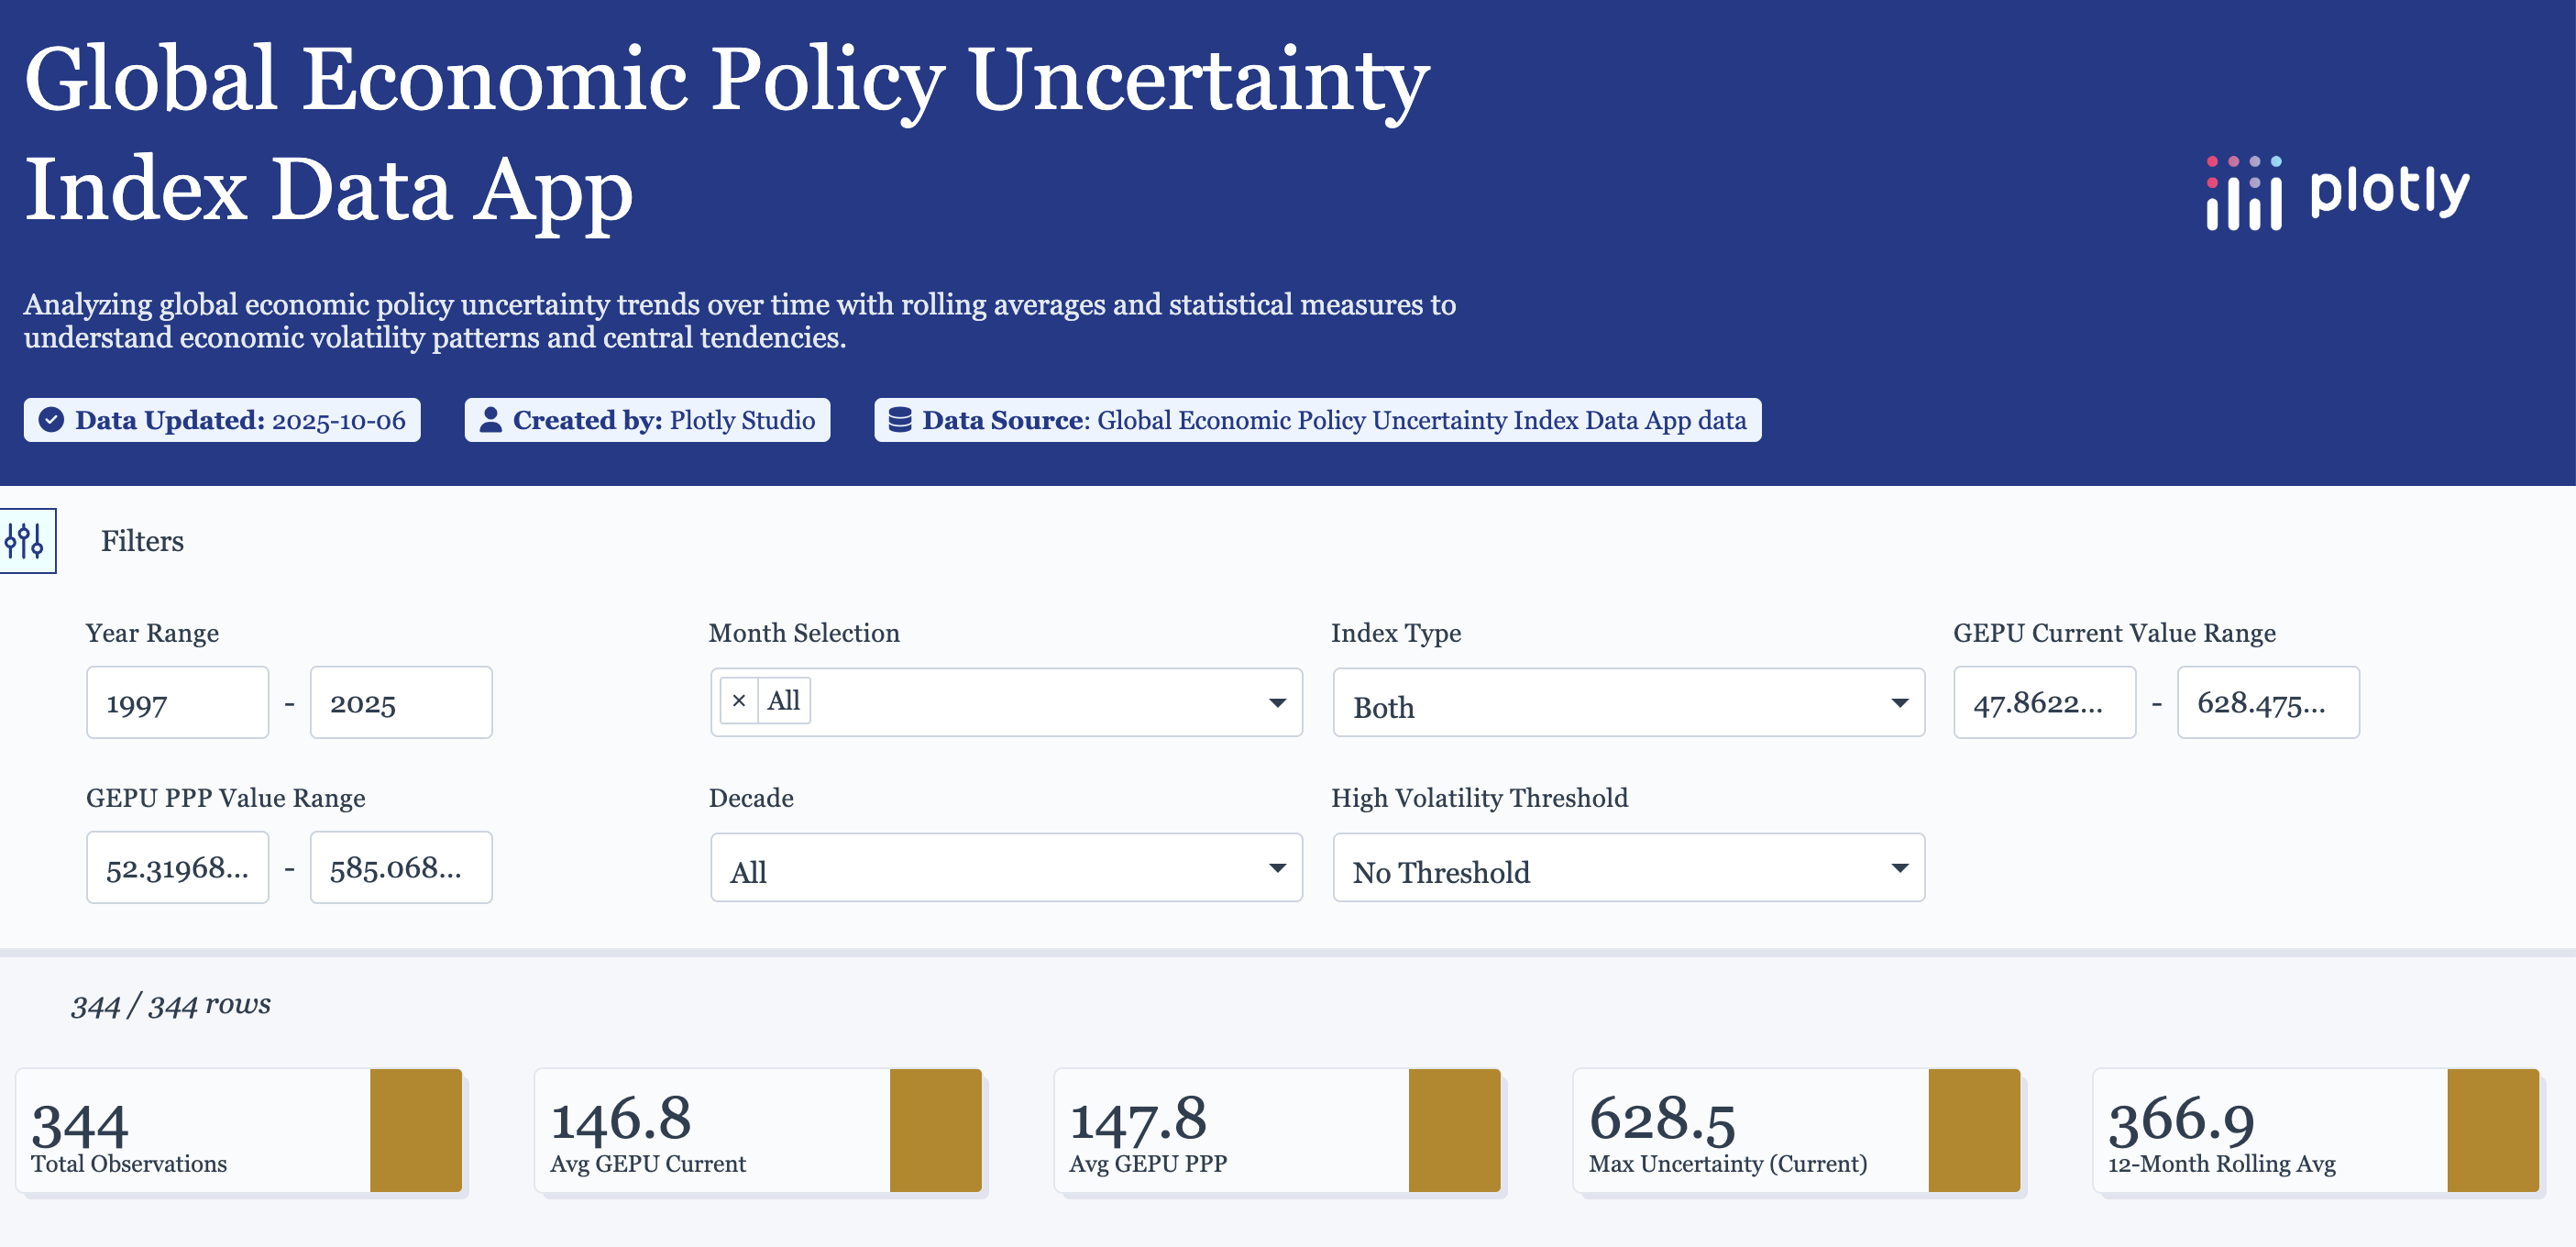
A preview of the app in action.
-
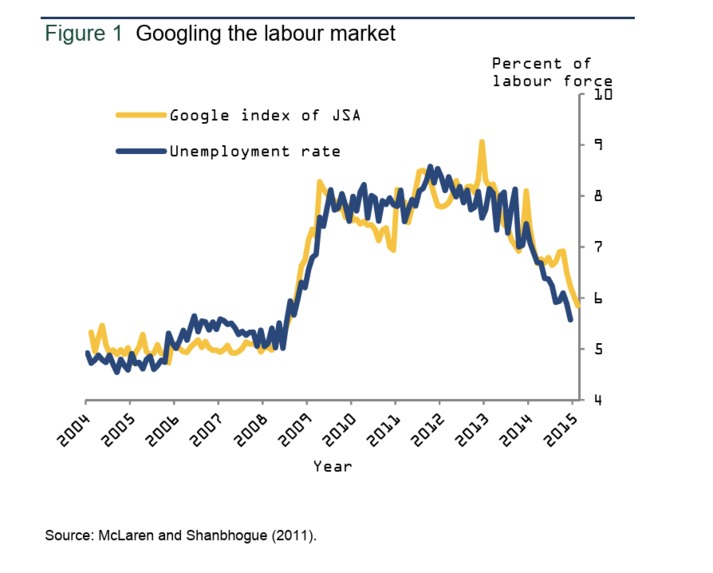
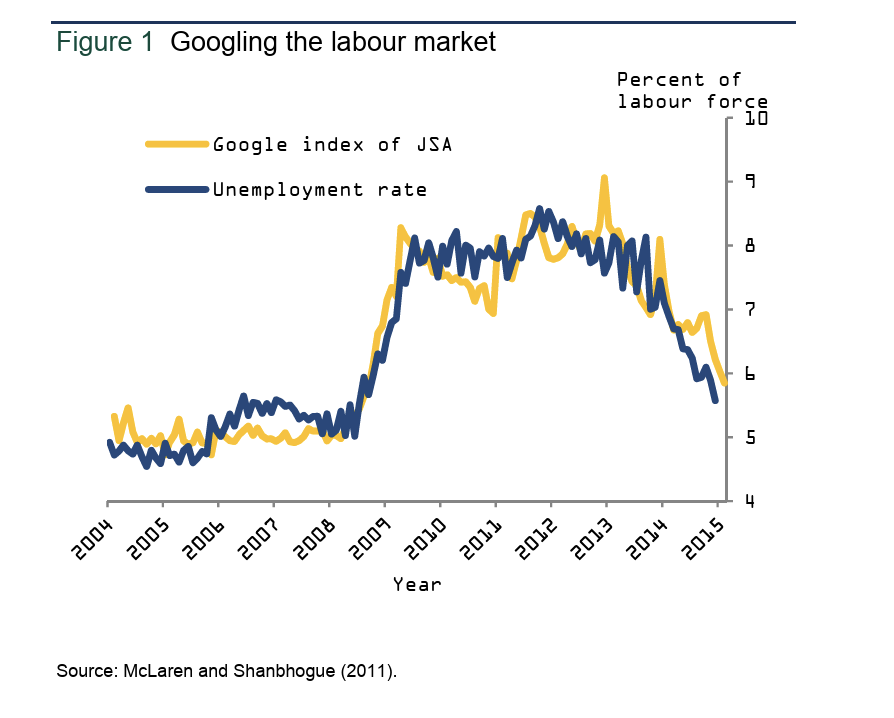
Excerpt from the Bank of England's "Text Mining and Central Banks"
-
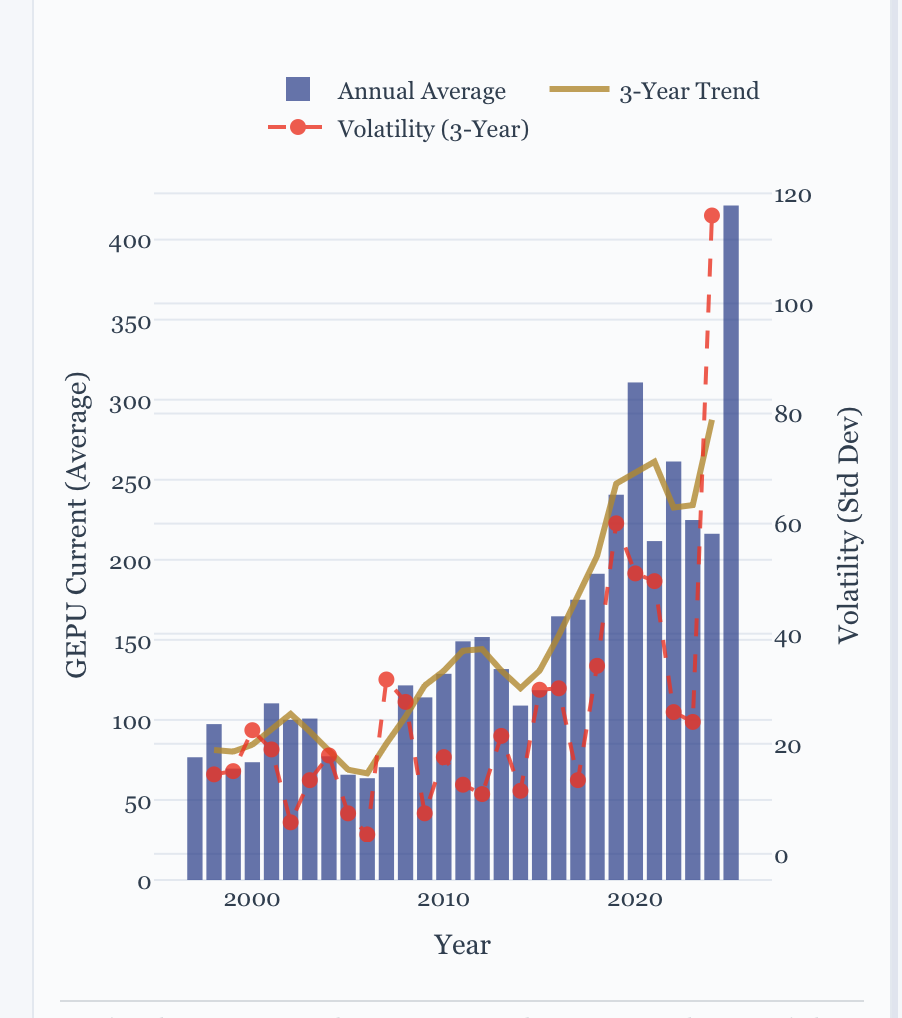
Overview of the Economic Policy Uncertainty index
Economics has frequently been associated with numbers but in recent years, there has been an increased interest among economists in words. The study of words or textual information is called Natural Language Processing (NLP). Economists have found that words can tell us a lot about how people are. For example, researchers at the Bank of England provide a good overview of what they called "text mining" being used in both monetary policy and economics more widely as there were benefits with doing so. For example, in their paper, they found that Google searches could properly track unemployment claims.
They were not the only authors to make note of this. The author of the book Everyone Lies: What the Internet Can Tell Us About Who We Really Are, Seth Stephens-Davidowitz, wrote a book on how the internet is a goldmine when it comes to data because people are more honest about their views on the internet compared to the real world. This is tied to the concept in research methods known as the "social desirability bias". Stephens-Davidowitz claimed that using the internet was a more reliable predictor of the electoral outcome in the United States than what official polls suggested.
One of the biggest developments in economics in relation to NLP is a metric known as the "Economic Policy Uncertainty" index. It was developed by a group of economists who recognised that newspaper headlines were a good indication of how uncertain people are about the future. You can read the original paper here. The Economic Policy Uncertainty index is now used by many media outlets, financial institutions and others to get a sense of how uncertain people are about the future. Uncertainty is important to measure because when people are uncertain about the future, they are less likely to spend, invest or hire, all of which have a negative impact on the economy (usually gauged through something known as the Gross Domestic Product (GDP)).
However, the economists who created this tool are not trained computer scientists, and the field of NLP has made significant developments since they wrote their paper in 2016. This project uses the tools offered by Plotly to make the Economic Policy Uncertainty index more accessible to the public.
Context and Goals set in Plotly Studio
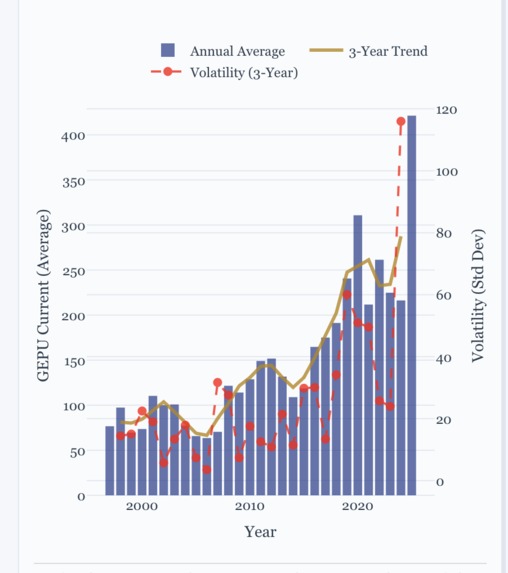
In Plotly Studio, I insisted that I wanted to see a rolling average for the Economic Policy Uncertainty index, together with measures of central tendency such as the mean and median. The .csv file used was for the Global Economic Policy Uncertainty index, but you can easily be more specific by downloading the relevant data from the website. Note that when you download the data, it wil be in the form of a .xlsx format. This is the format for Microsoft Excel files. You need to save it again to .csv within the context of Microsoft Excel so that you can use it in Plotly Studio.
Interpreting the data
To interpret the data, you only need to know that higher figures mean people are feeling more uncertain and lower figures mean people are feeling less uncertain. In general, greater uncertainty is a bad thing as it reduces spending, investment and hiring. The economy, at least as measured through this index, has become increasingly uncertain.
My review of Plotly Studio
I found it very easy to use, although the documentation could do with some improvement. I would say you learn more from Plotly by actually using it as opposed to reading the documentation. I really love the various charts it shows too. One thing that wasn't clear was how to retrieve the context and goals you originally set for the program? It wasn't immediately clear.
Data Source:
Global Economic Policy Uncertainty Index (1997-2025) : https://www.policyuncertainty.com/media/Global_Policy_Uncertainty_Data.xlsx (be sure to convert to .csv for use on Plotly Studio)


Log in or sign up for Devpost to join the conversation.