-
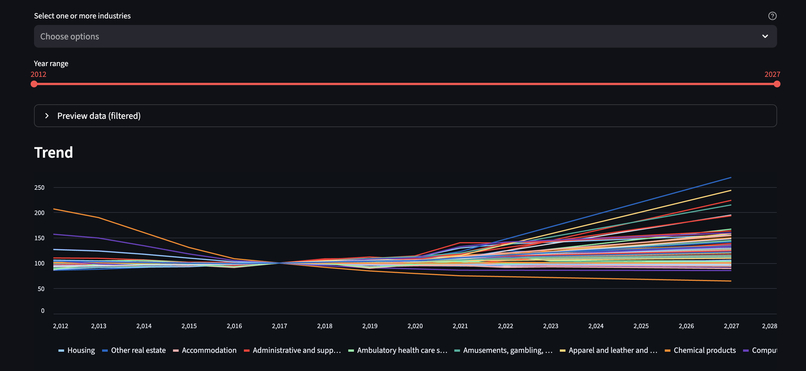
Visualization of the various industries economic change over time.

Industry Sub-Sector Forecasting Dashboard
Inspiration
We were inspired by a simple but important problem: Gross Output is too broad.
It hides critical details about which sub-sectors are truly thriving and which are stagnating or shrinking. Investors, policymakers, and researchers all need more granular insights to make informed decisions.
What We Learned
Through this project, we learned:
- How to break down economic aggregates into meaningful sectoral stories.
- How different industries can move in opposite directions even if the overall Gross Output looks stable.
- The importance of statistical inference (t-tests, p-values) in validating our projections against real-world data.
- The practical side of turning raw datasets into interactive dashboards for storytelling.
How We Built It
Data Preparation
- Cleaned BEA’s wide-format space economy dataset.
- Transformed it into a tidy structure for easier analysis and visualization.
- Cleaned BEA’s wide-format space economy dataset.
Modeling
- Applied Holt’s Linear Trend Exponential Smoothing:
$$ \ell_t = \alpha y_t + (1 - \alpha)(\ell_{t-1} + b_{t-1}) $$
$$ b_t = \beta (\ell_t - \ell_{t-1}) + (1 - \beta)b_{t-1} $$
$$ \hat{y}_{t+h} = \ell_t + hb_t $$
- Applied Holt’s Linear Trend Exponential Smoothing:
- This let us capture smooth growth/decay without overfitting, even with only ~12 years of data.
Inference Testing
- We compared projected 2023 values to actual 2023 values using a two-sample t-test:
$$ t = \frac{\bar{X}_1 - \bar{X}_2}{\sqrt{\frac{s_1^2}{n_1} + \frac{s_2^2}{n_2}}} $$
- We compared projected 2023 values to actual 2023 values using a two-sample t-test:
- Found no significant difference between our projections and actuals ($p = 0.80 > \alpha = 0.05$).
- Visualization
- Built an interactive Streamlit dashboard with a dropdown to select industries and plot trends.
- Users can focus on specific sub-sectors and ranges of years.
- Built an interactive Streamlit dashboard with a dropdown to select industries and plot trends.


Challenges
- Data sparsity: only annual values from 2012–2023, limiting complex models.
- Heterogeneity across industries: some sectors grow rapidly, others stagnate, making one-size-fits-all modeling difficult.
- Deployment hurdles: Colab + ngrok tunnels weren’t stable for long-term hosting, so we had to rethink how to make the app demo-ready.
- Presentation: explaining statistical methods (like exponential smoothing or t-tests) in a way that’s digestible for non-technical judges.
Key Takeaways
- Gravity ≠ Zero Gravity: sectors that all follow the overall market are hard to distinguish. What matters are the ones that rise independently.
- Those “zero-gravity” sectors—resilient to market trends—are exactly where investors find opportunity.


Log in or sign up for Devpost to join the conversation.