-
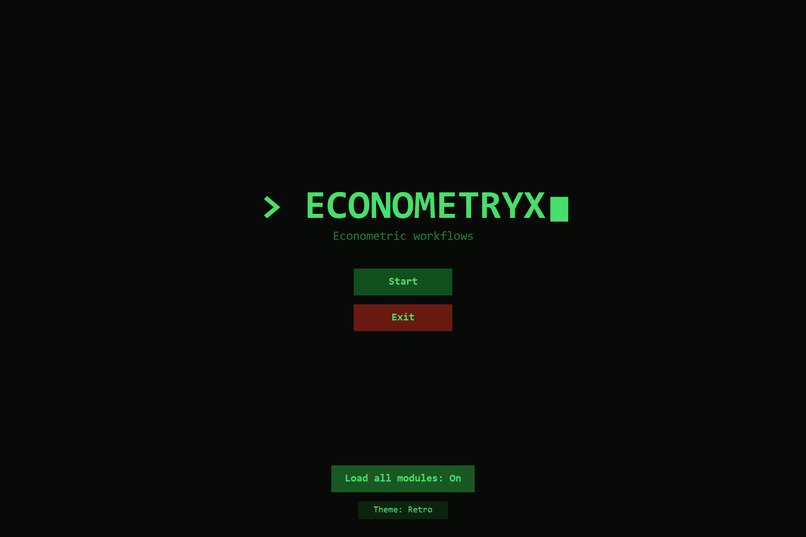
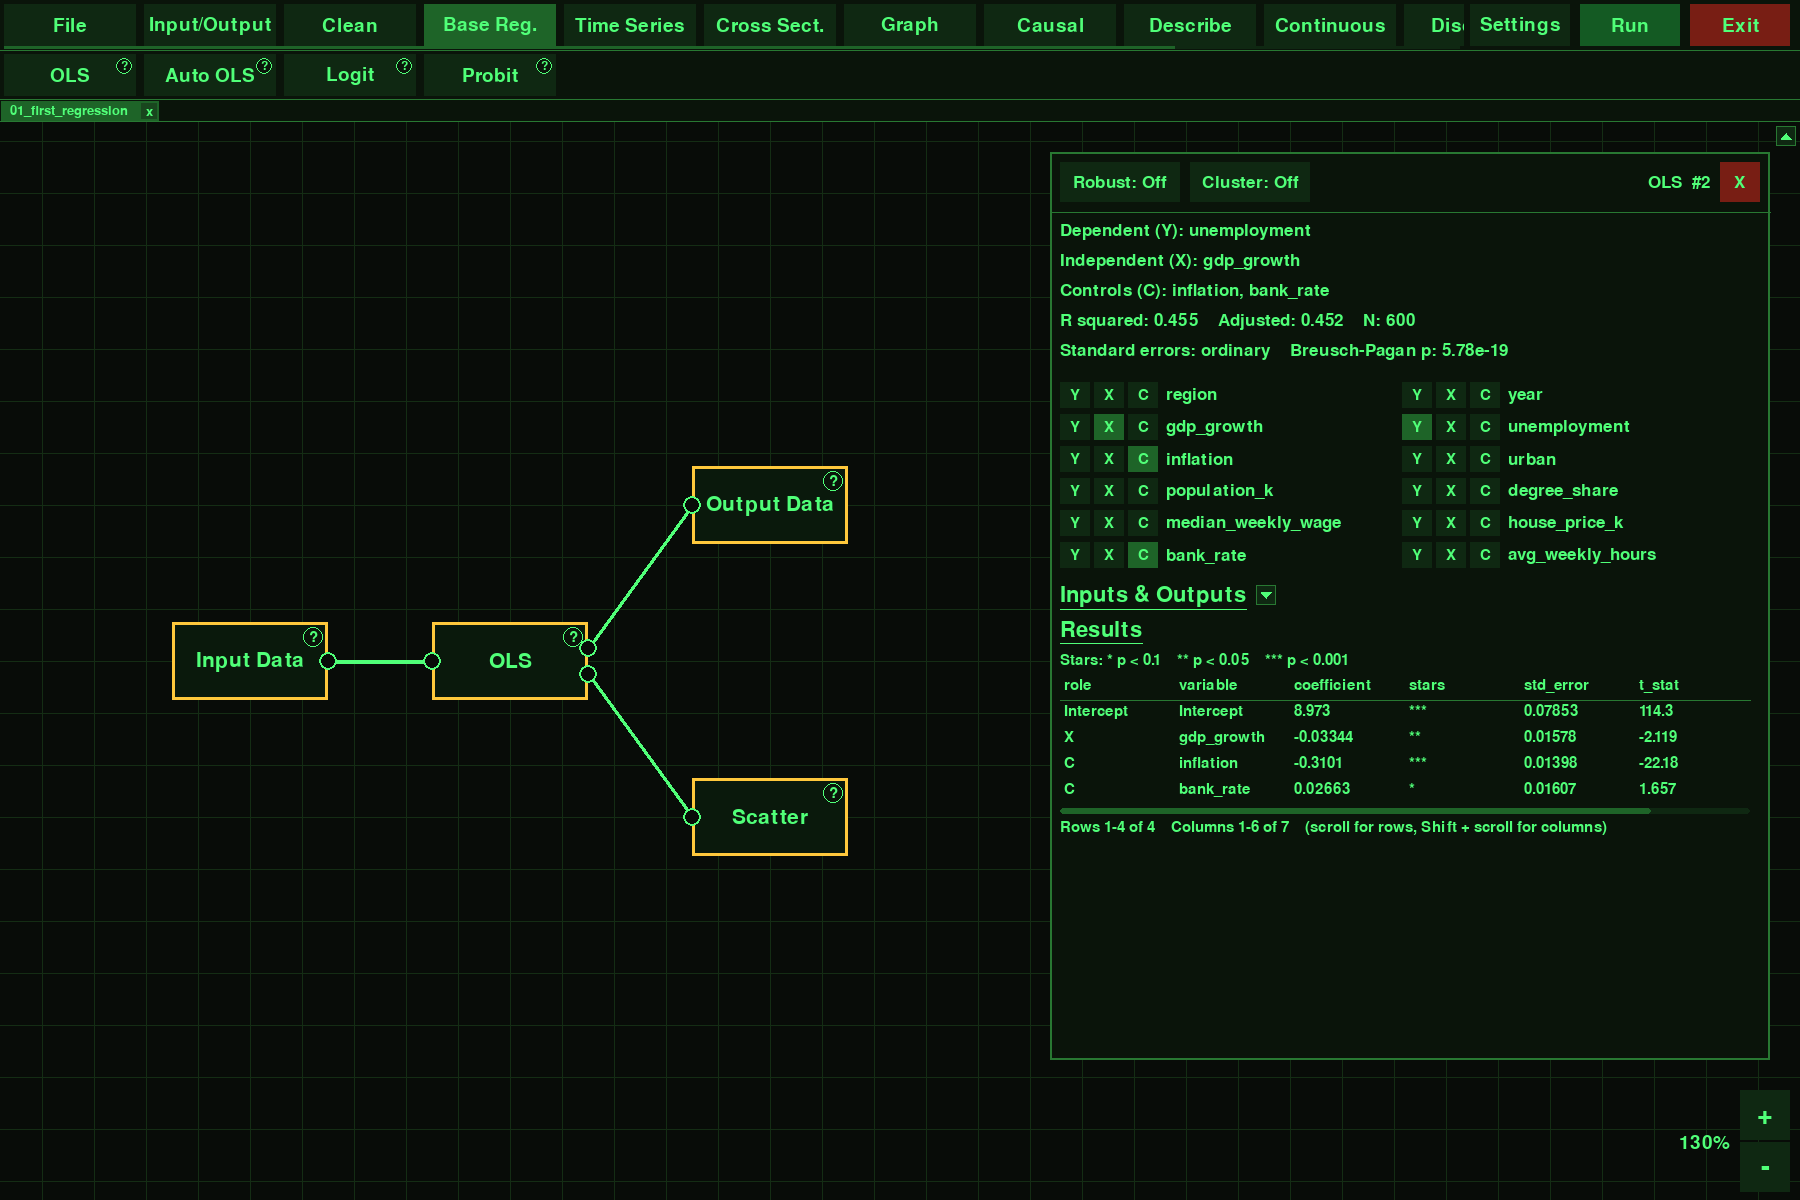
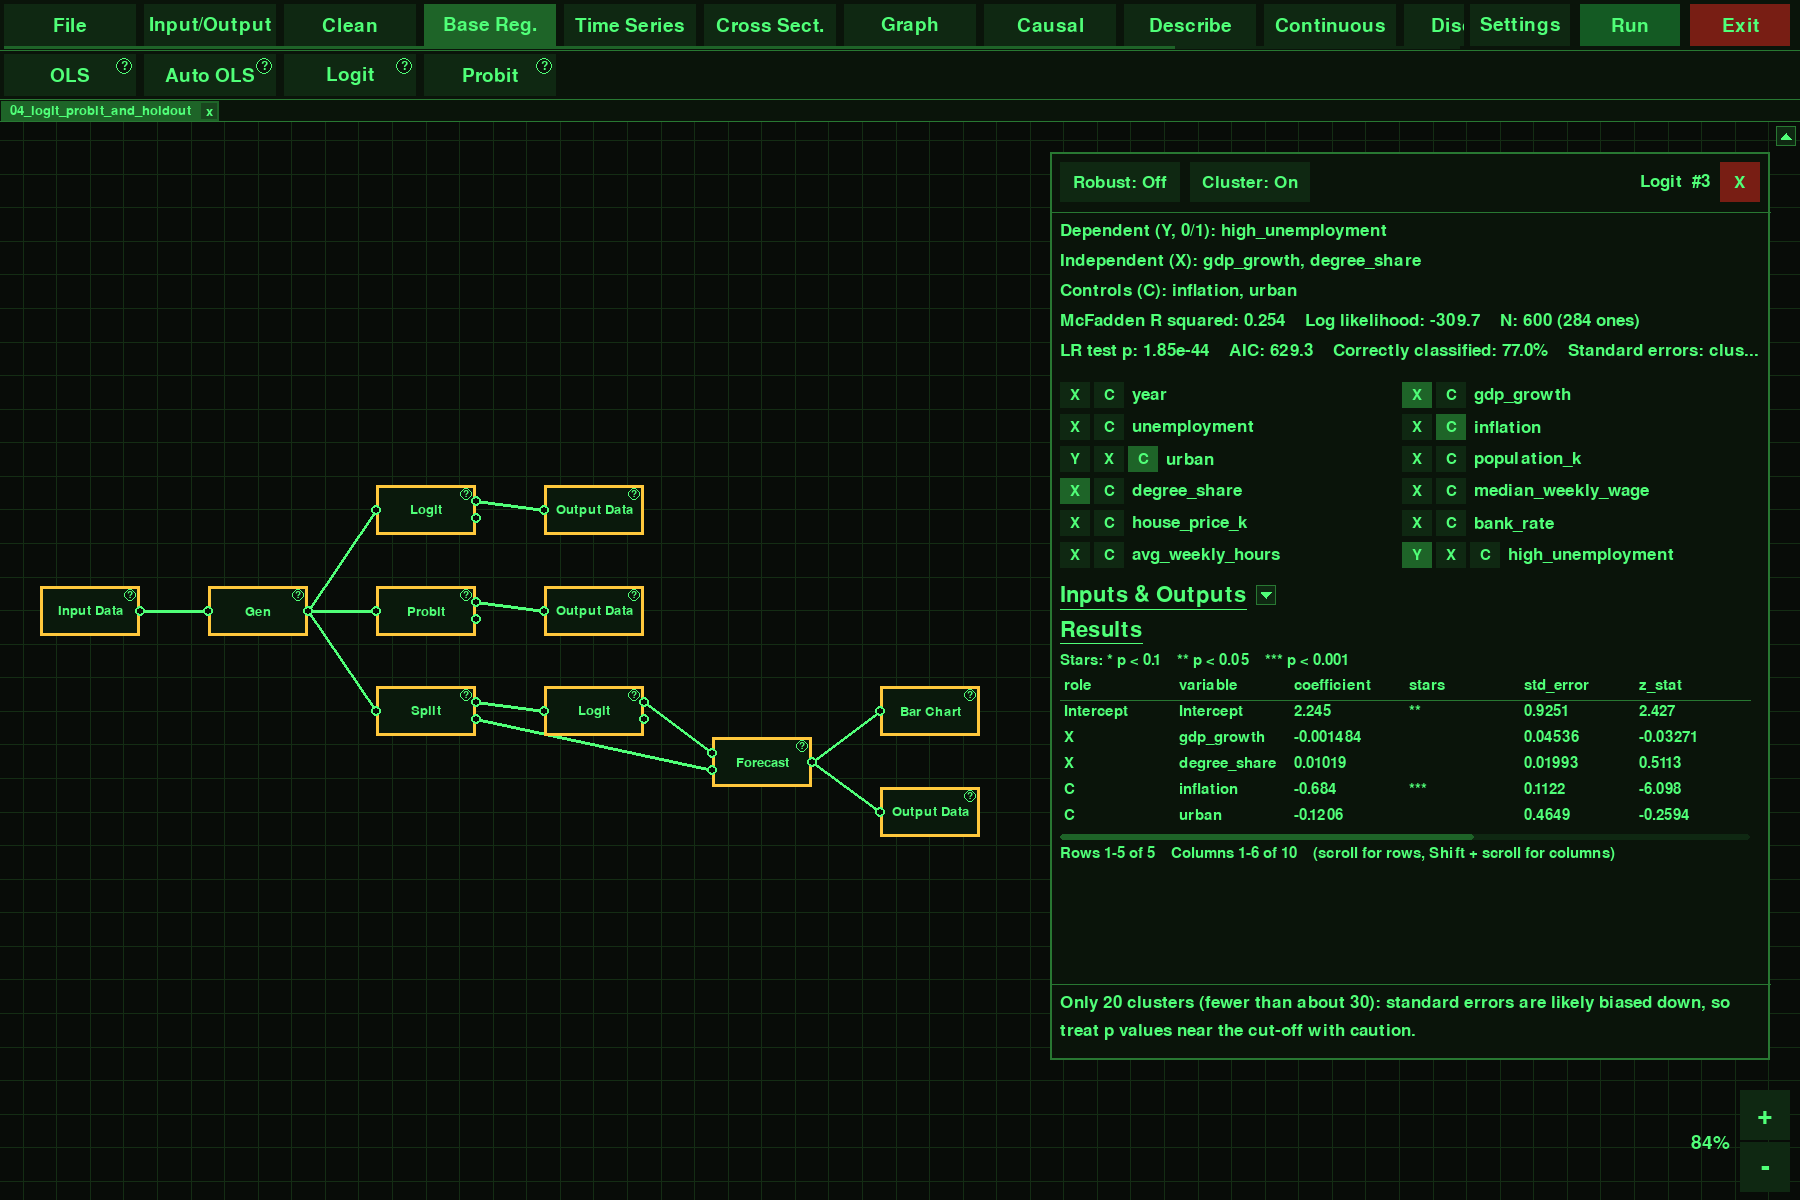
Econometryx in Retro mode: a green-screen terminal look for drag-and-drop econometrics. Normal and Y2K themes are included too.
-
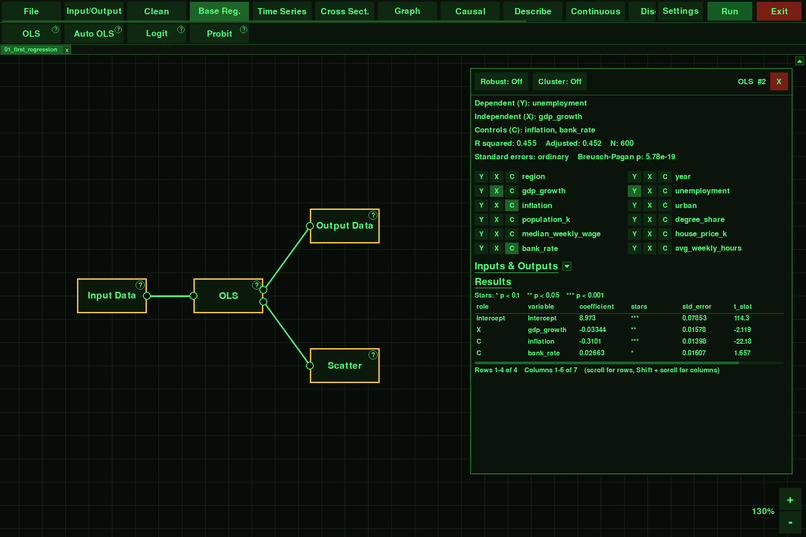
Your first regression in four modules: OLS with coefficients, significance stars, R² and a Breusch-Pagan test, all without writing code.
-
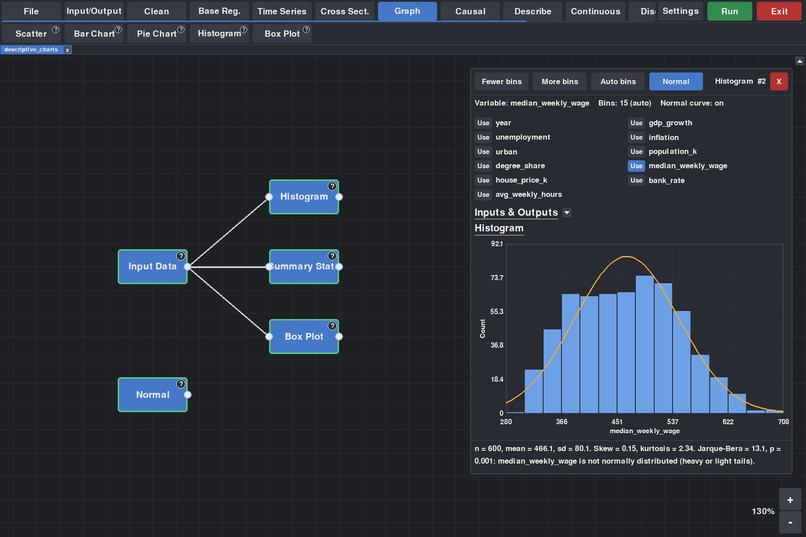
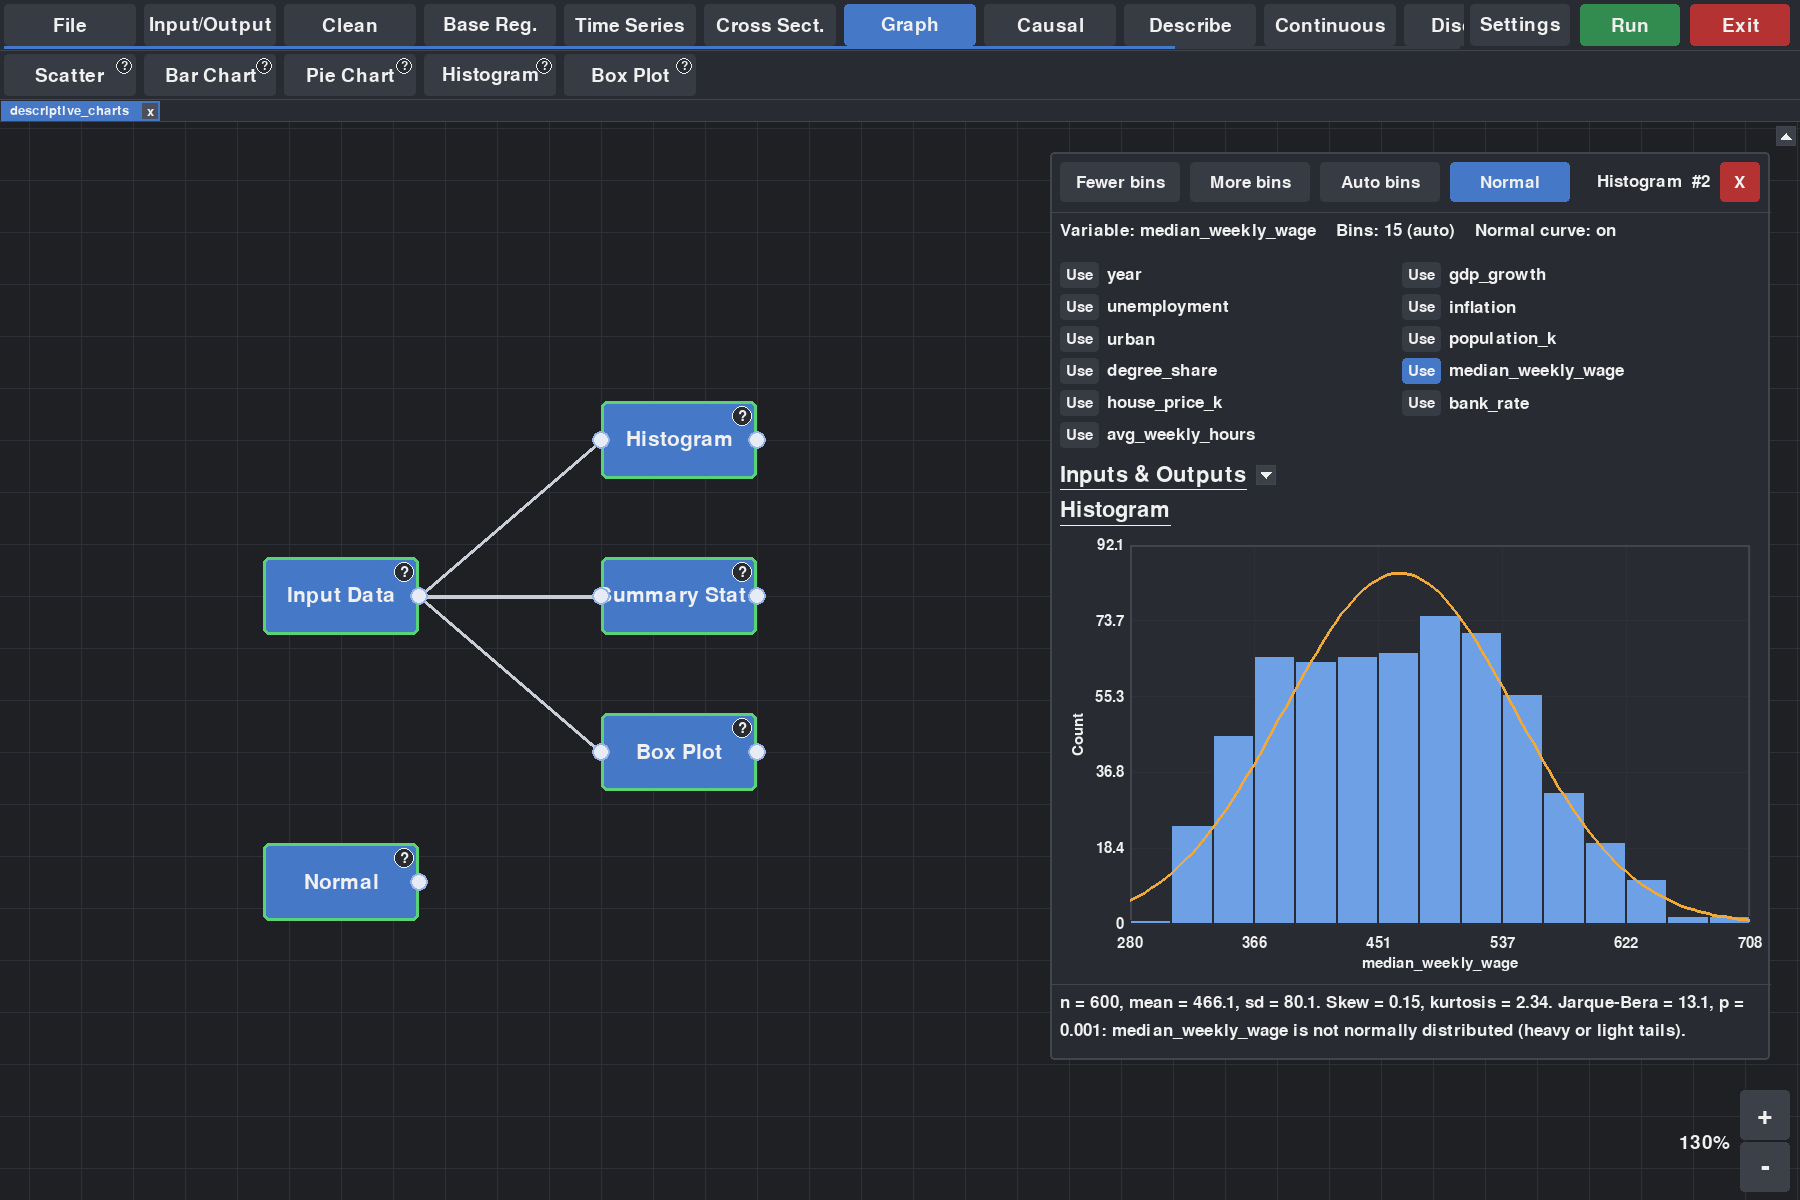
Histograms with a fitted normal curve and a Jarque-Bera test, with descriptive stats and box plots from the Graphs+ pack.
-
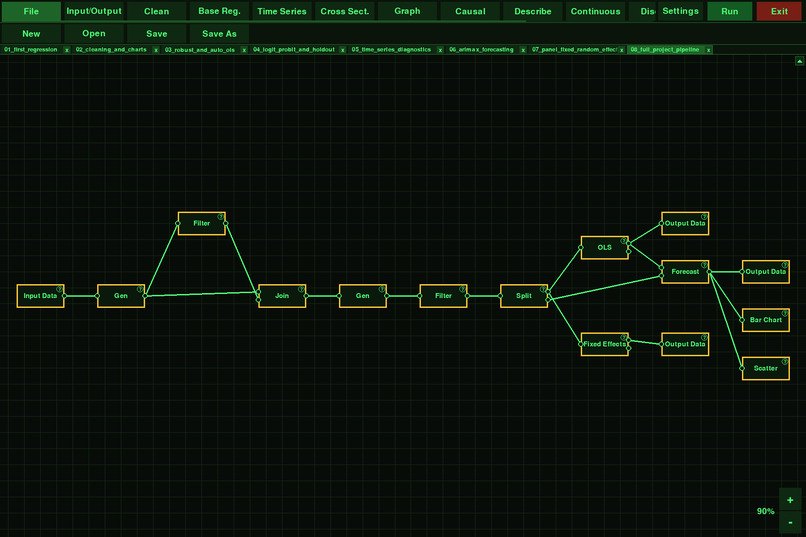
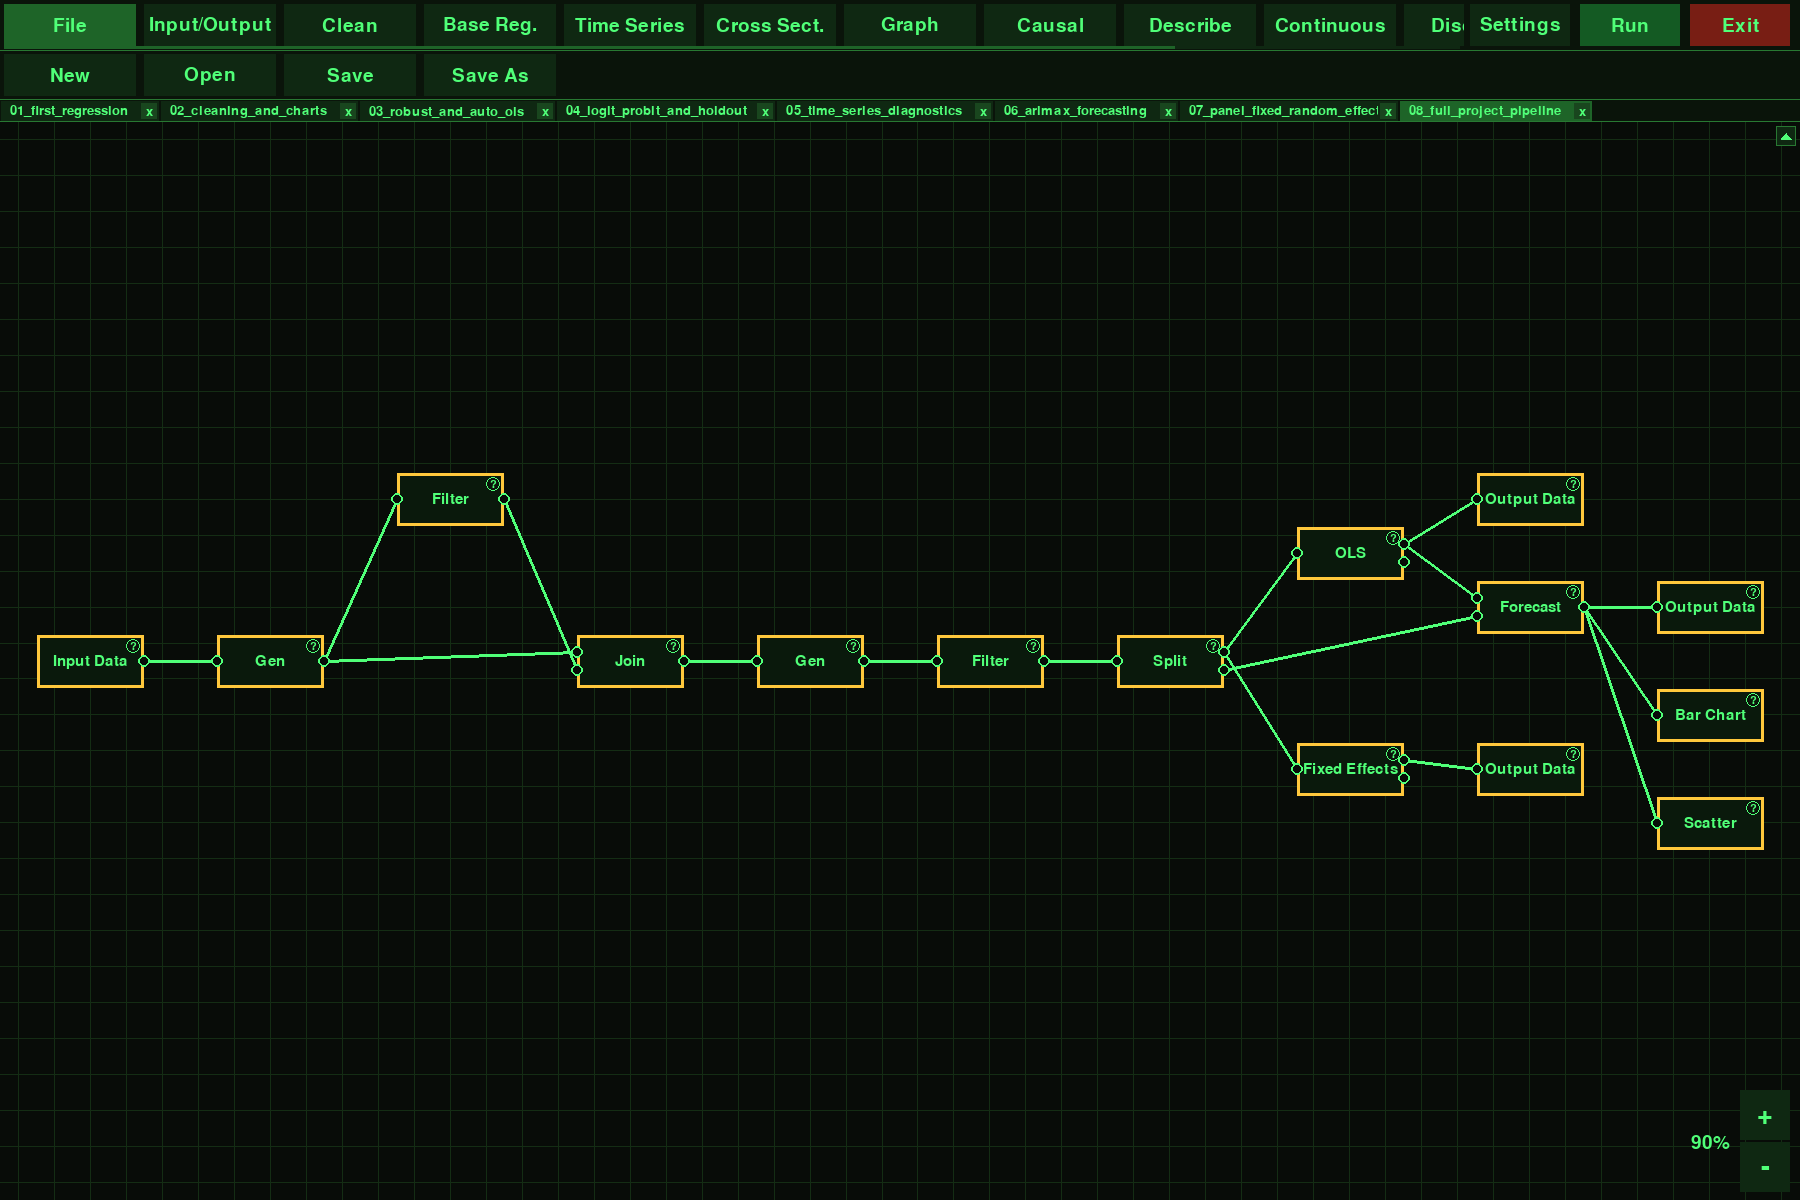
A full research project on one canvas: join, transform, split, model and export to Excel. Keep several workflows open in tabs.
-
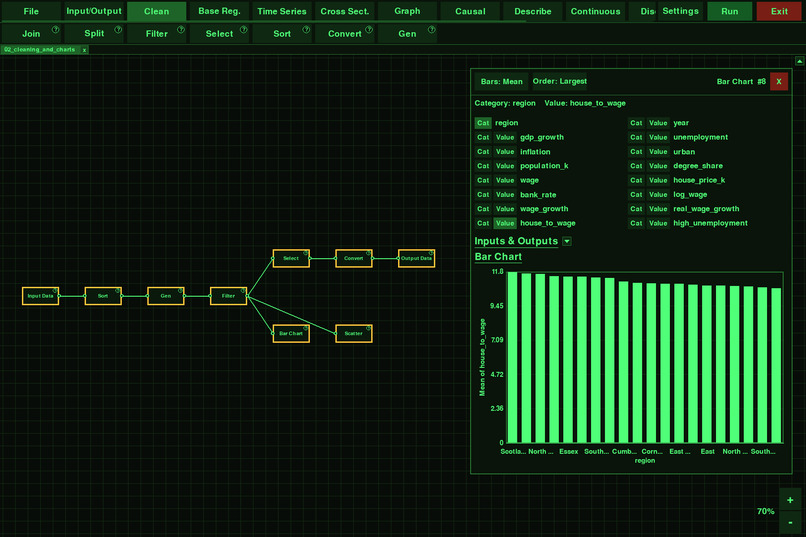
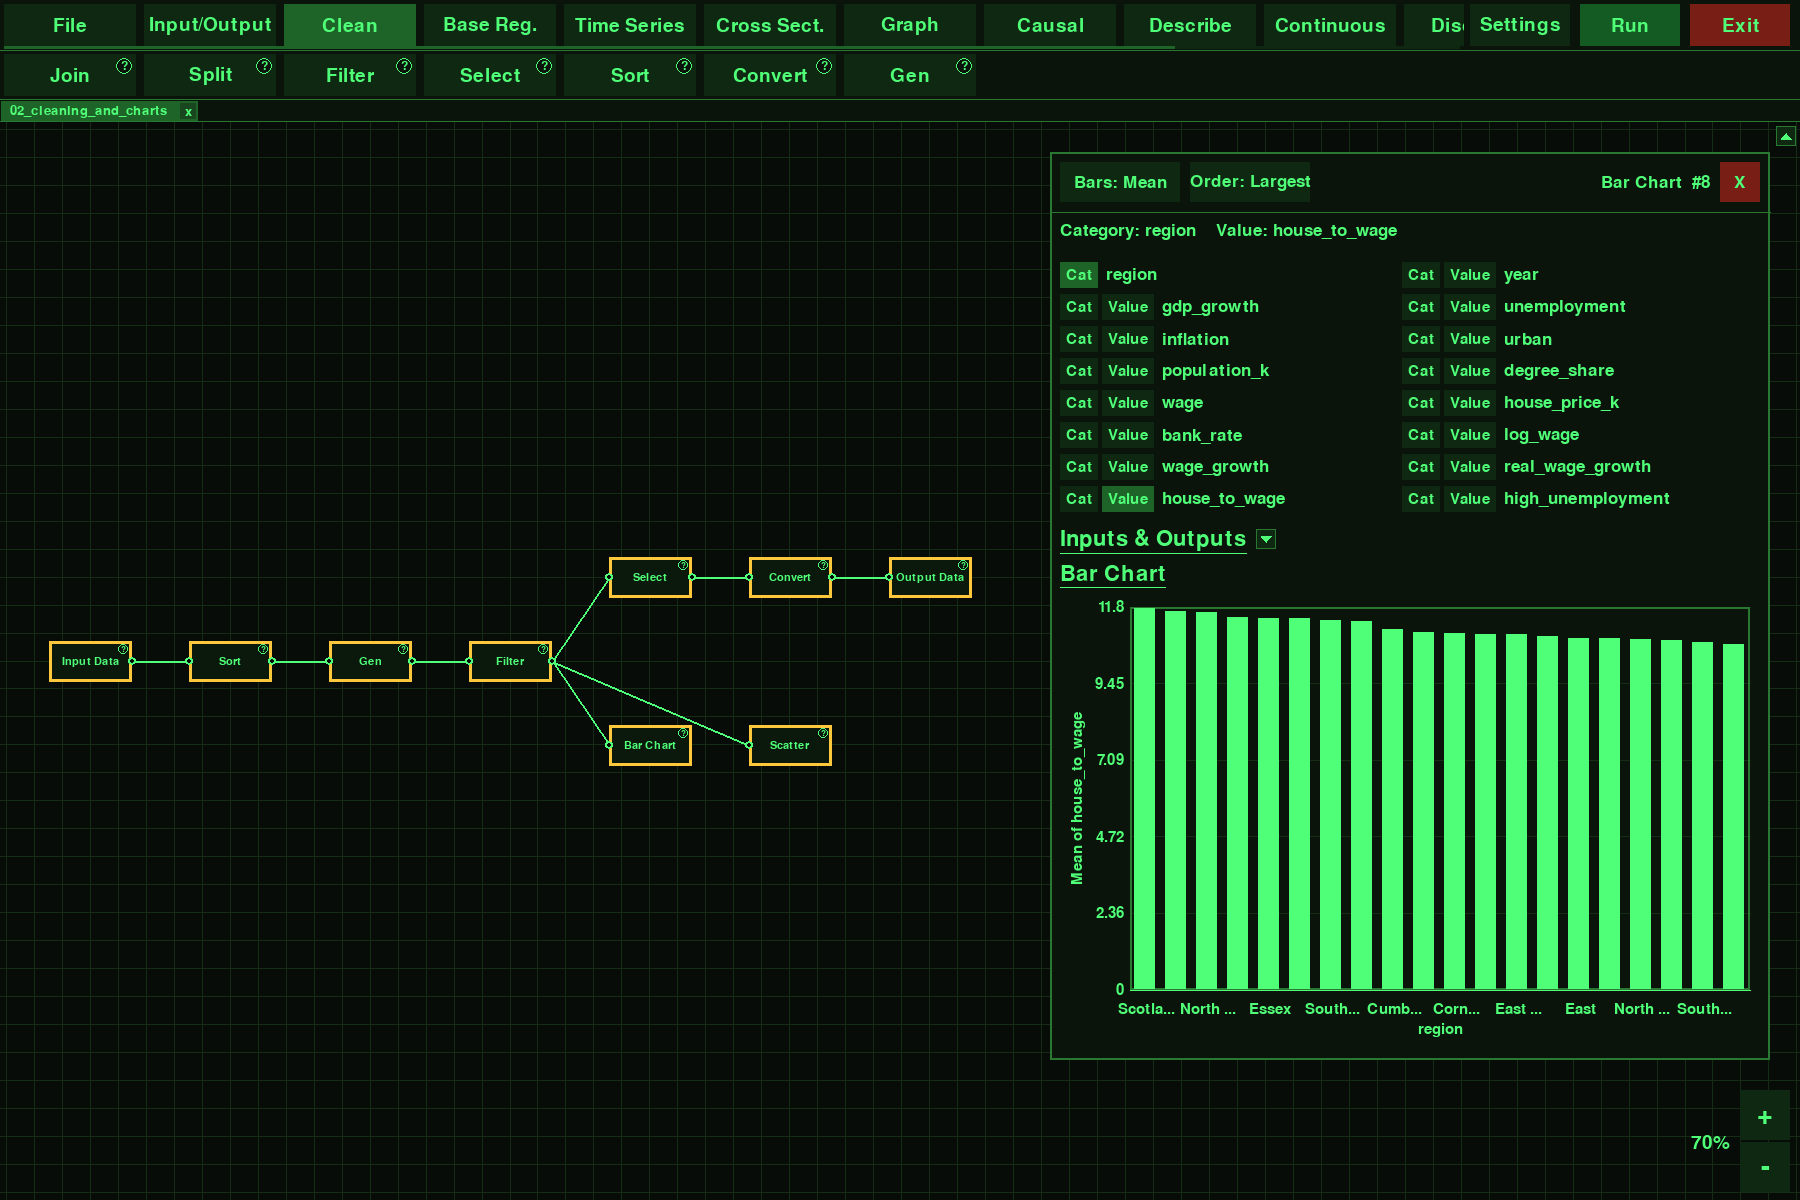
Clean data visually: sort, generate, filter, select and convert in one pipeline, then chart the results by category.
-
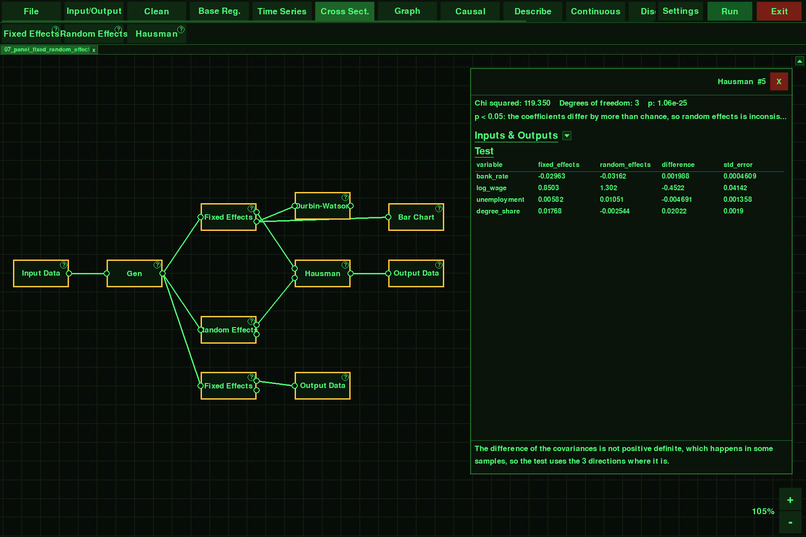
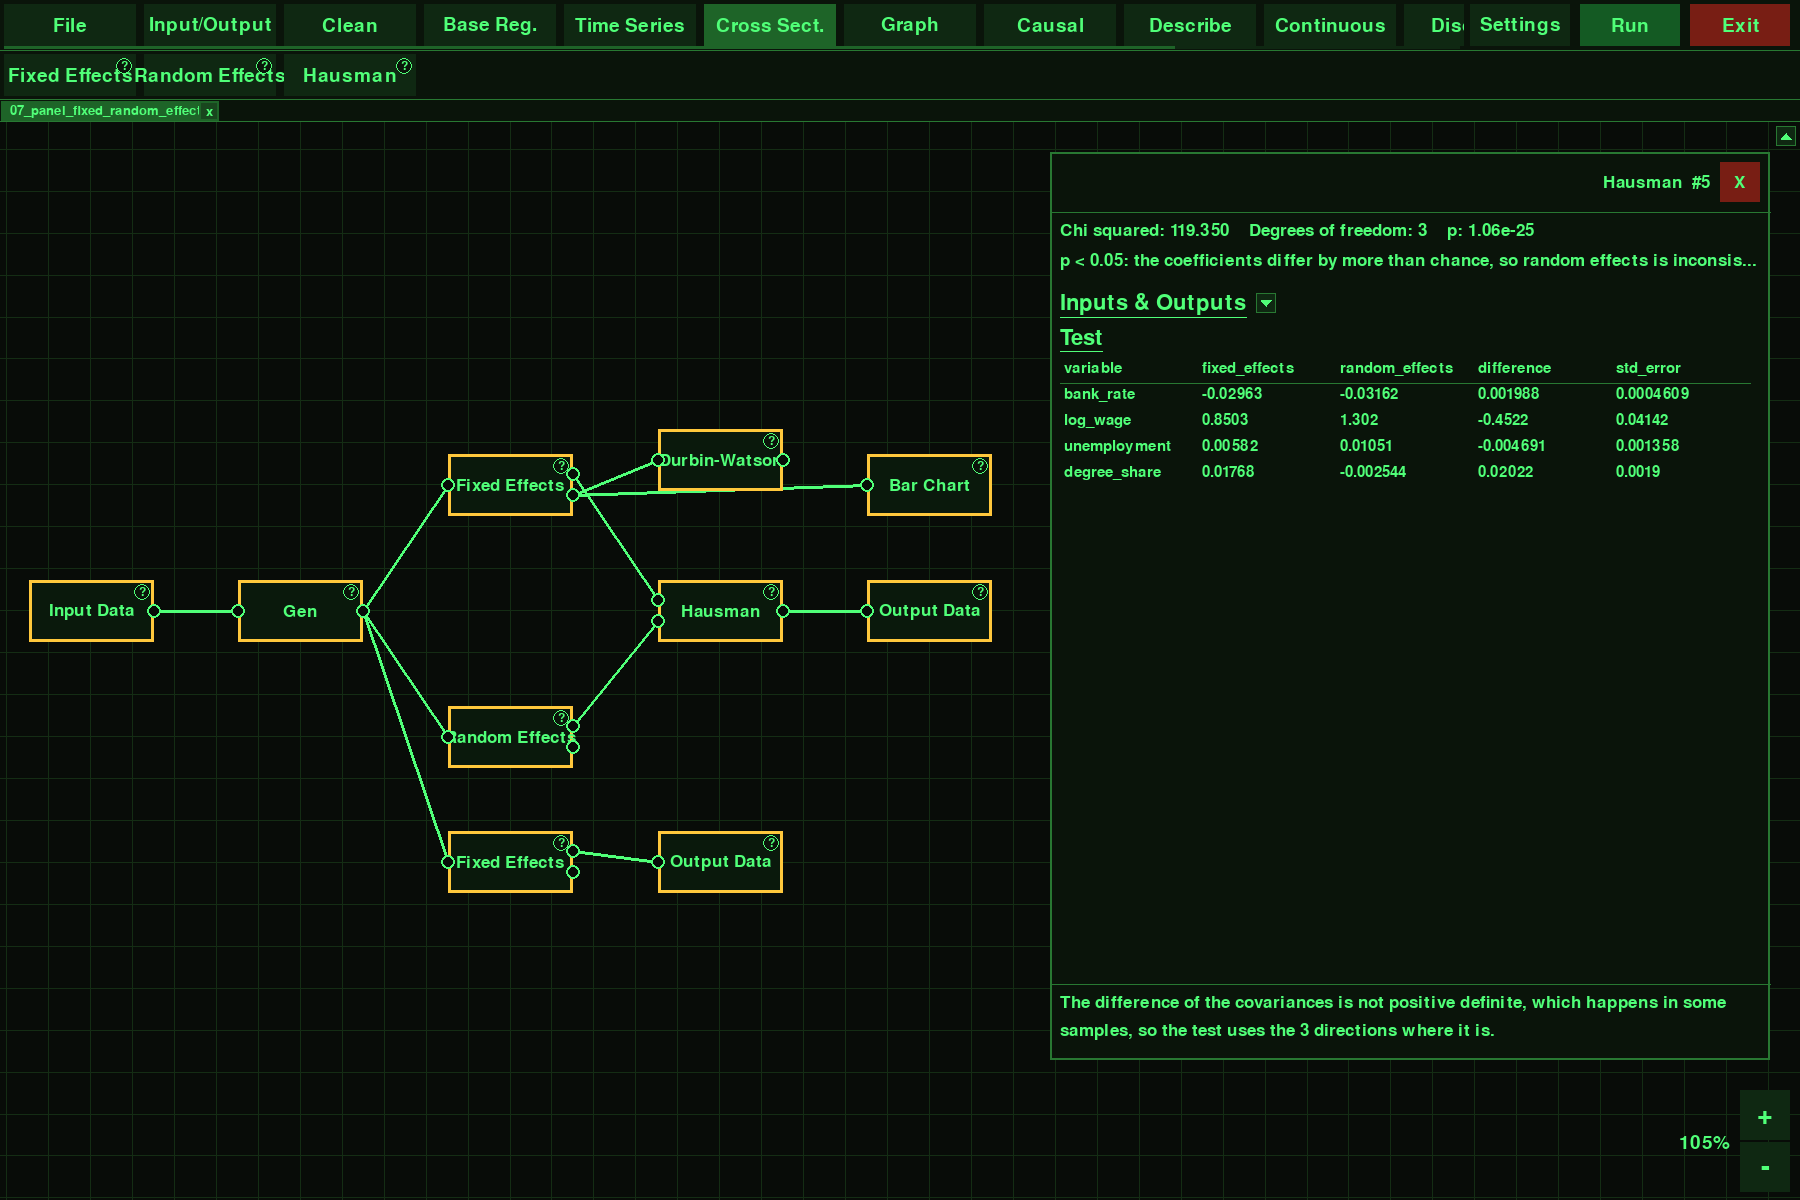
Panel data made simple: fixed and random effects side by side, with a Hausman test to choose between them.
-
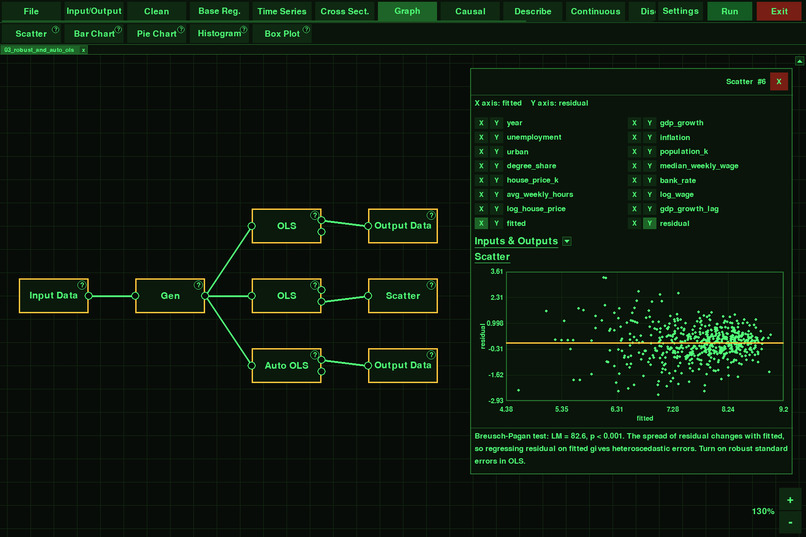
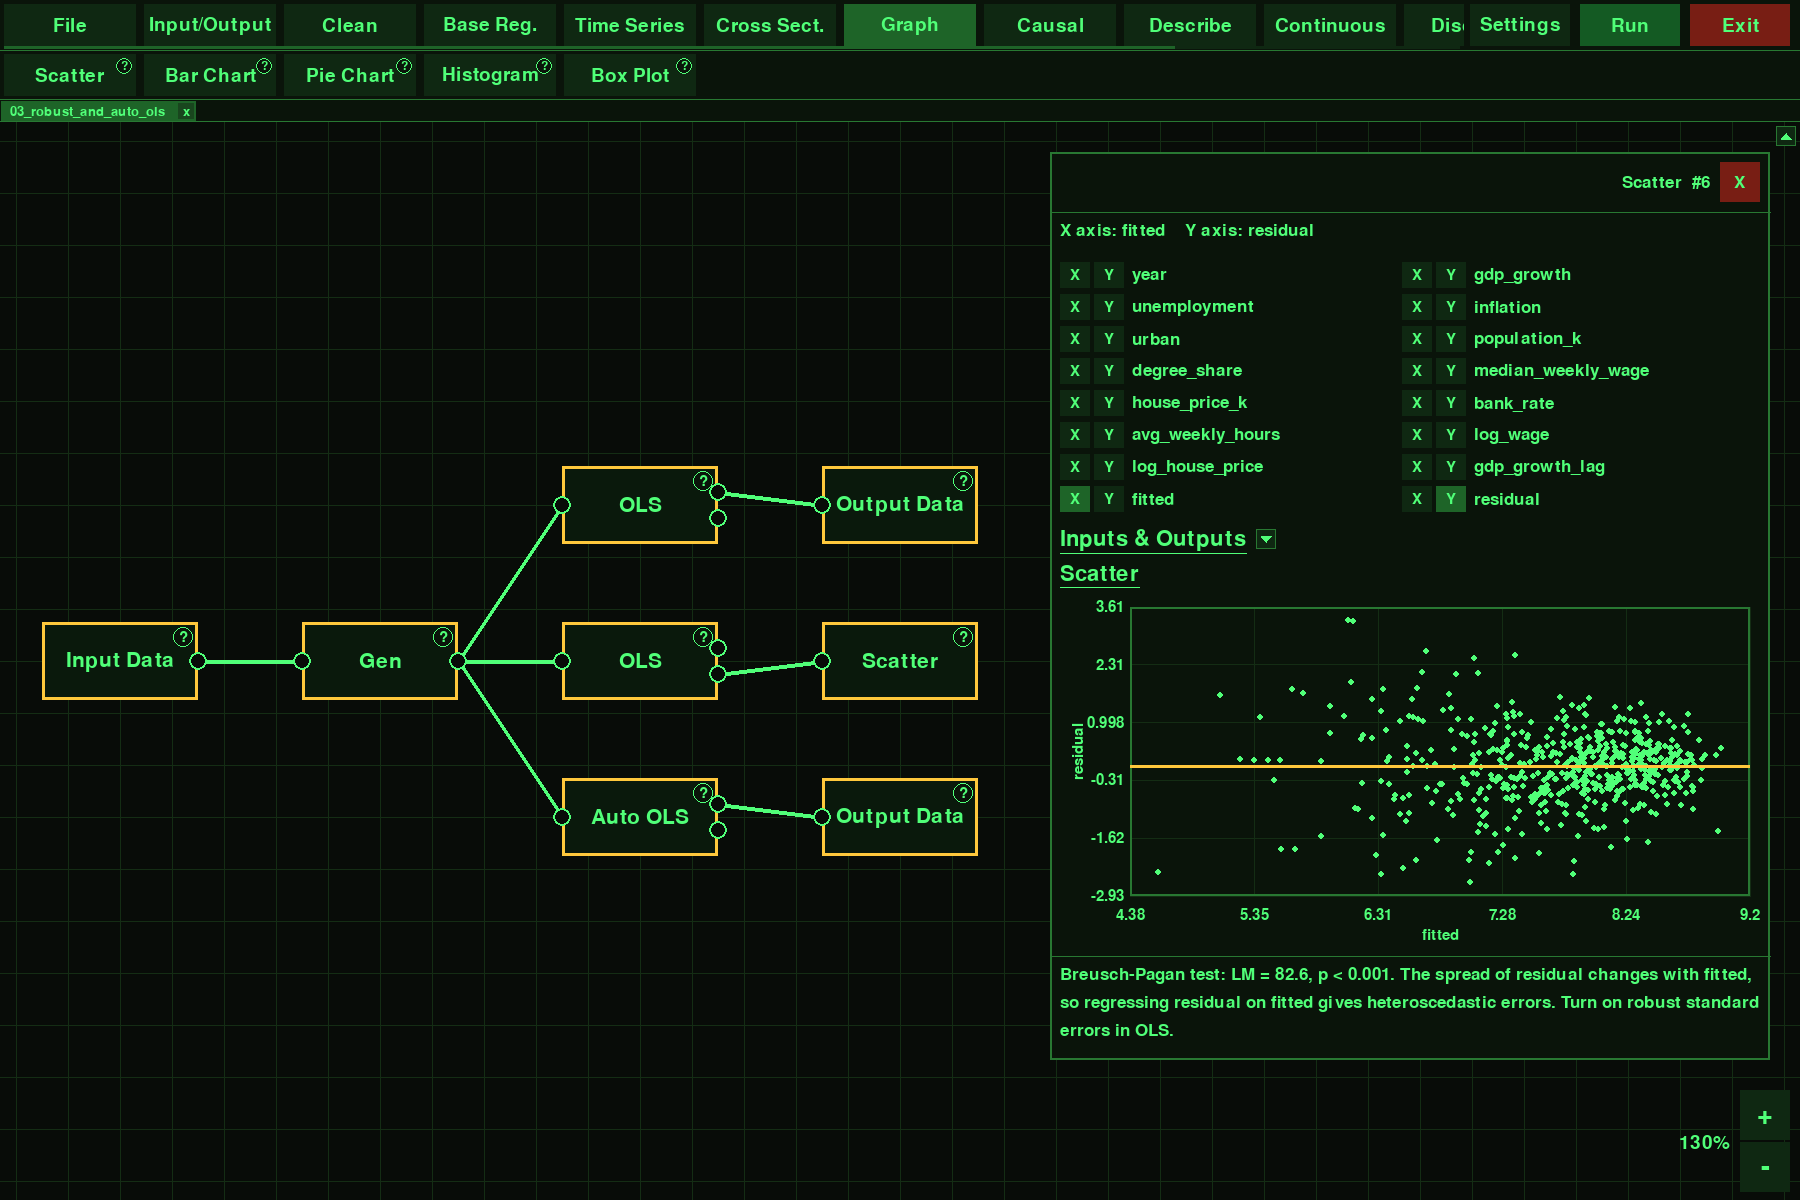
A residual-vs-fitted scatter flags heteroscedasticity automatically and suggests switching on robust standard errors.
-
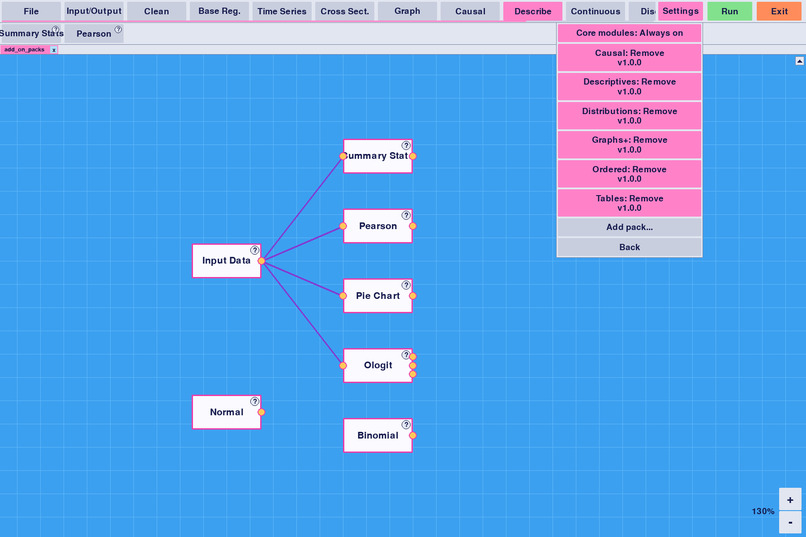
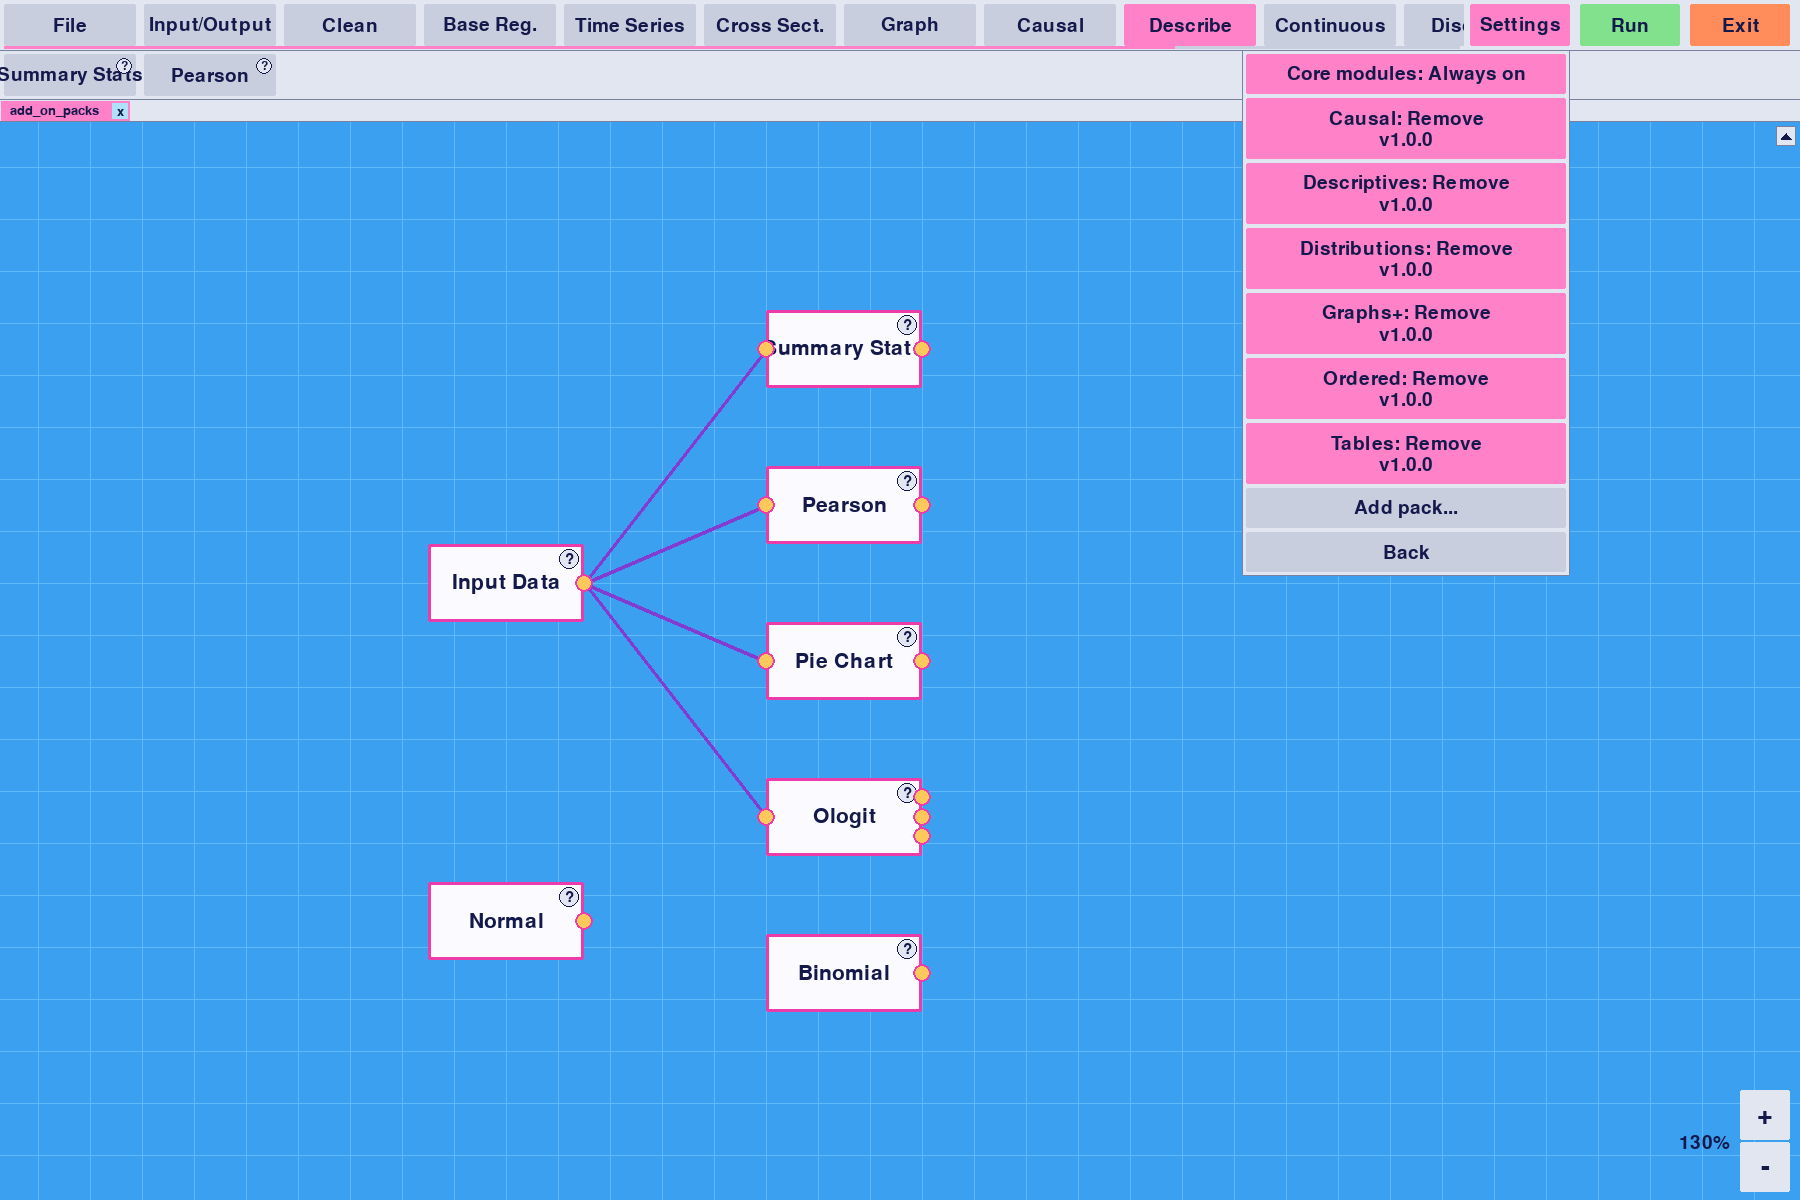
Extend it with add-on packs: causal inference, descriptives, distributions, extra charts, ordered models and tables. Or write your own.
-
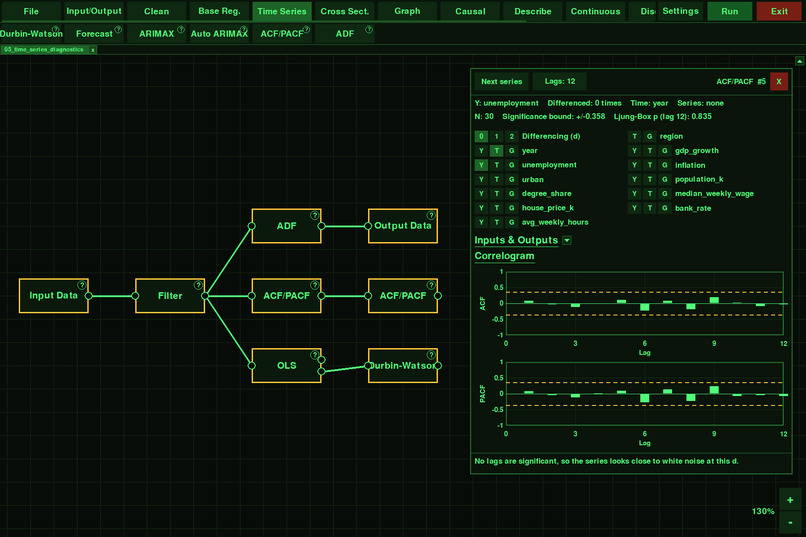
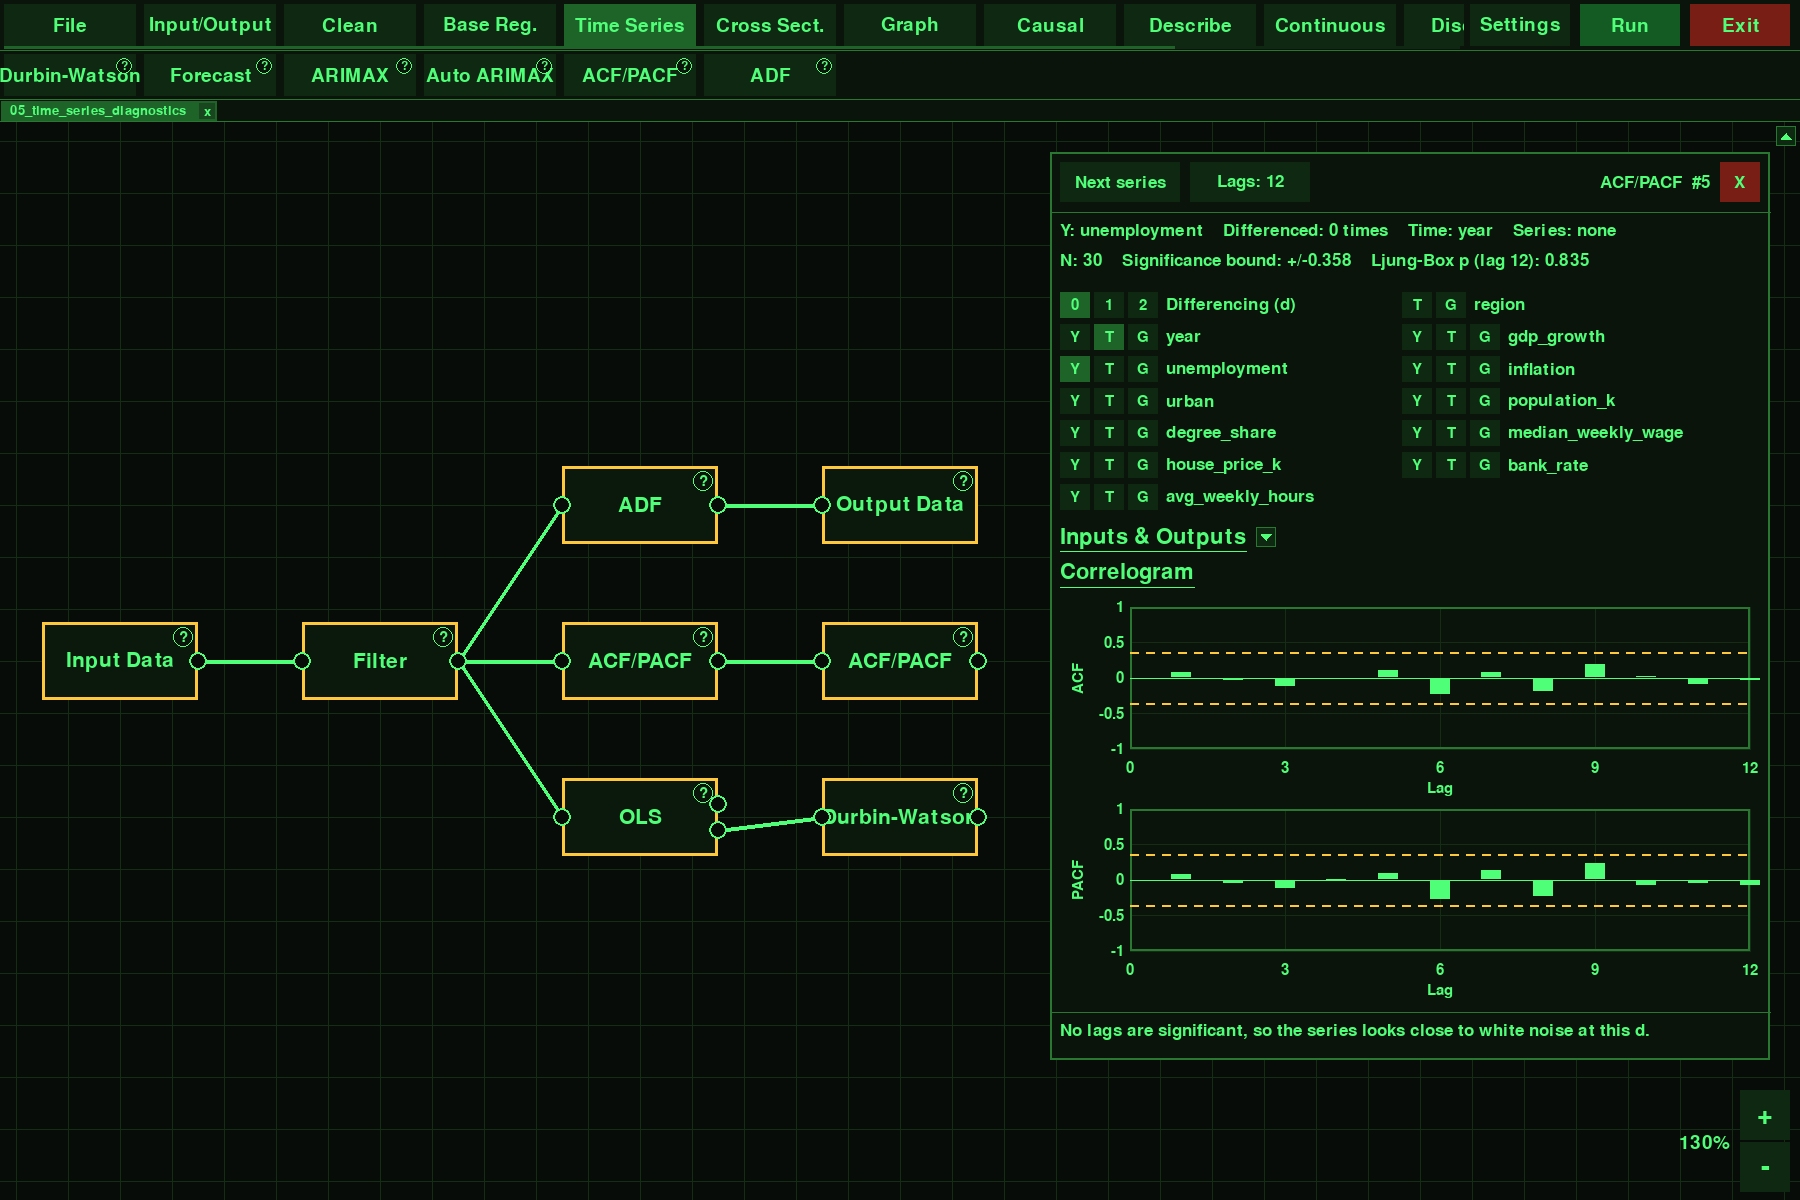
Time-series diagnostics: an ACF/PACF correlogram with significance bounds and a Ljung-Box test, plus ADF and Durbin-Watson.
-
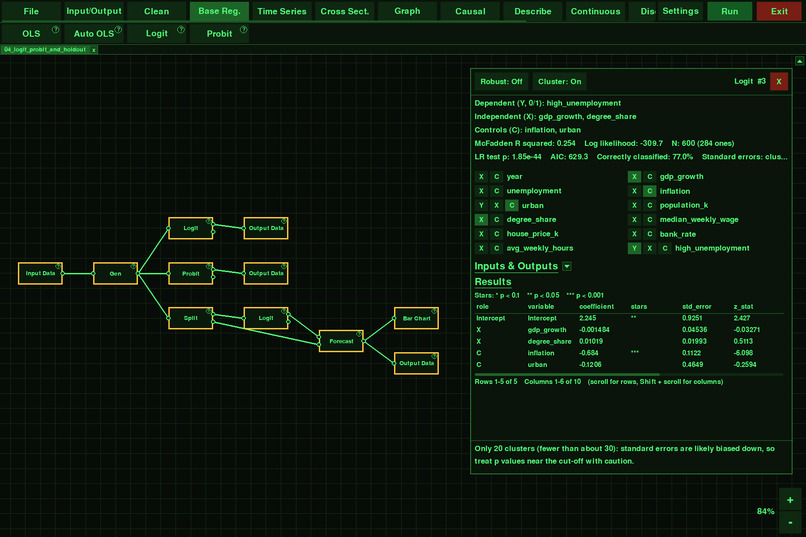
Logit and probit with clustered errors, then an 80/20 holdout split to score the model out of sample.
-
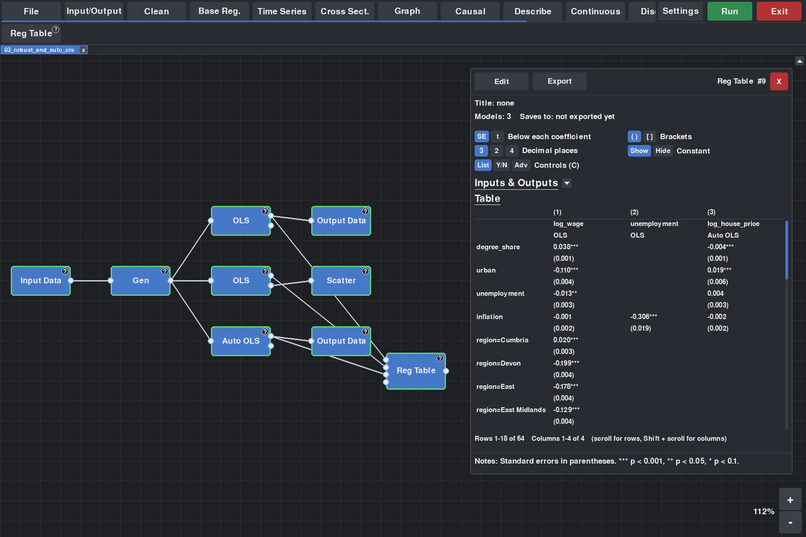
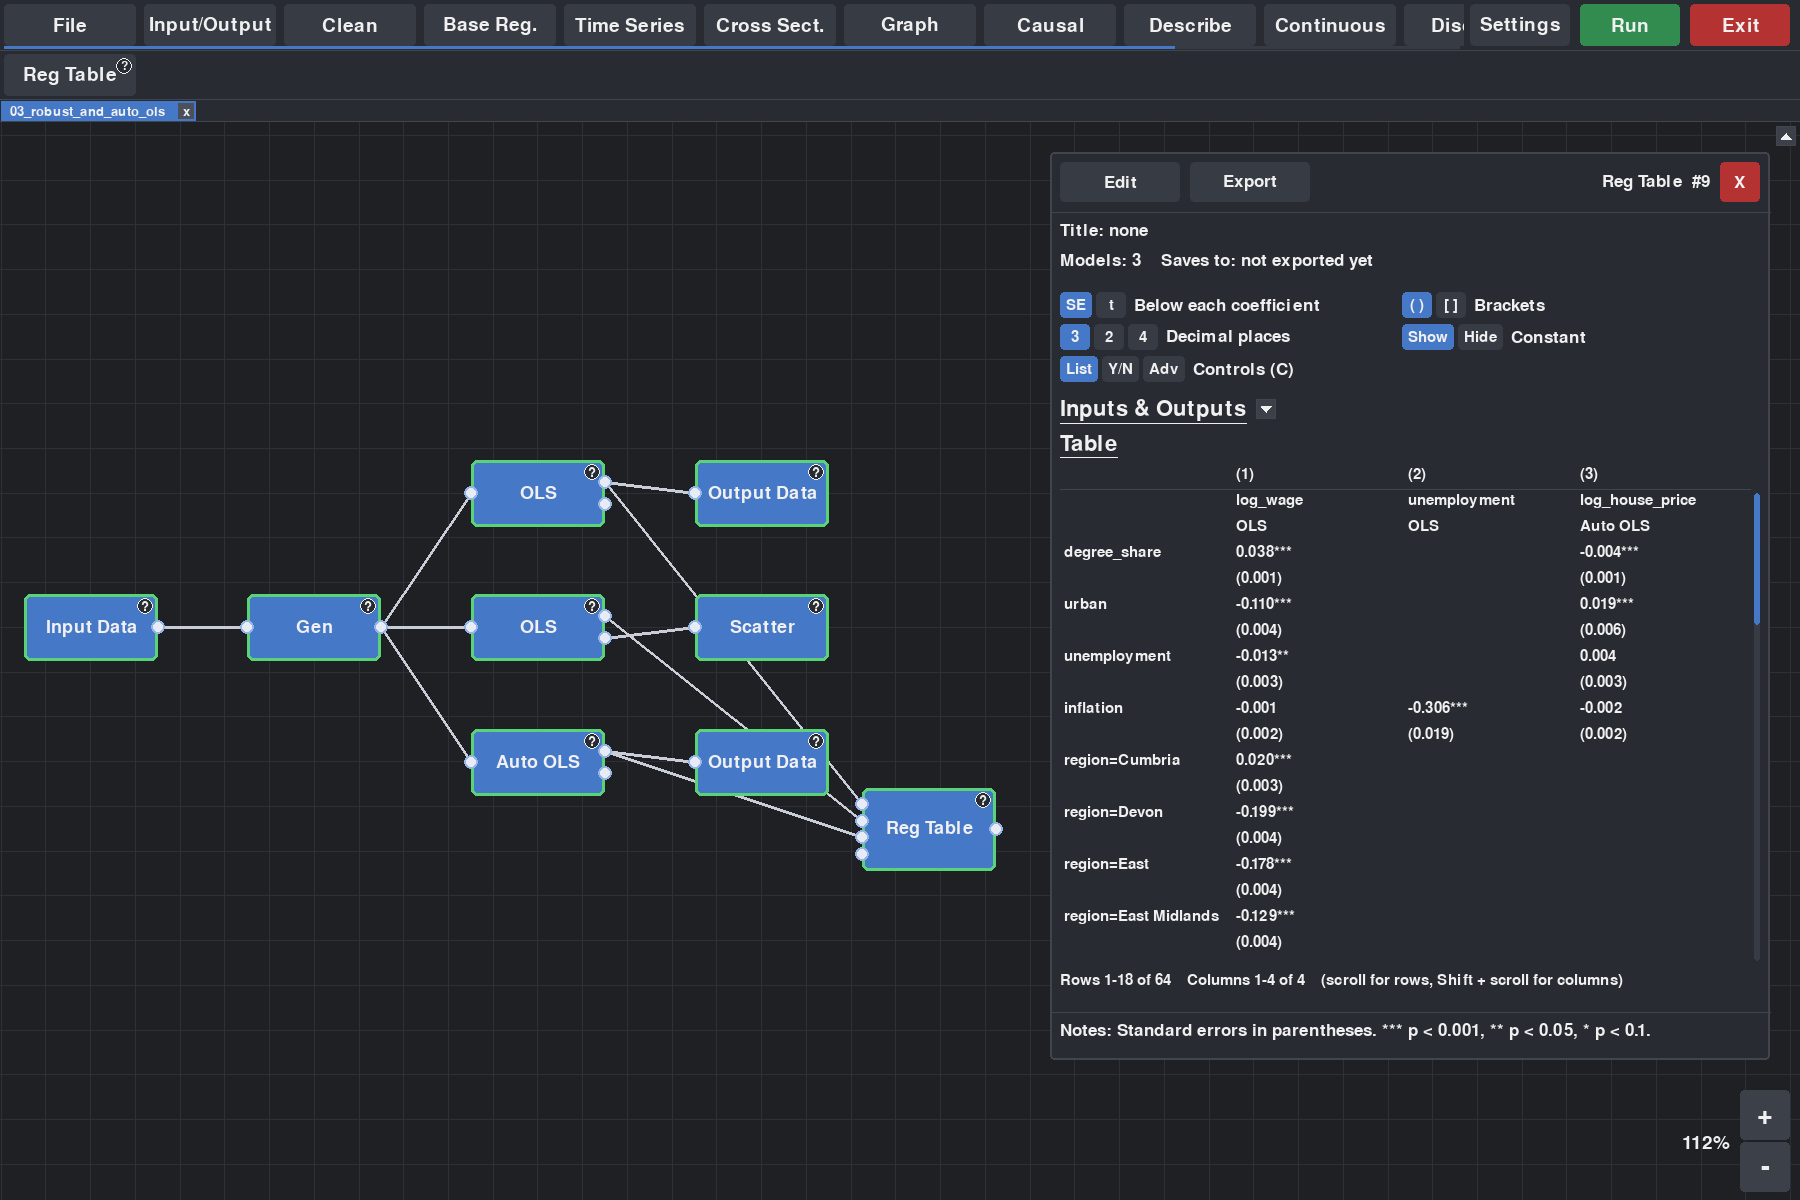
Connect several models to get a side-by-side regression table in the style of economics journals, ready to export to Excel.
-
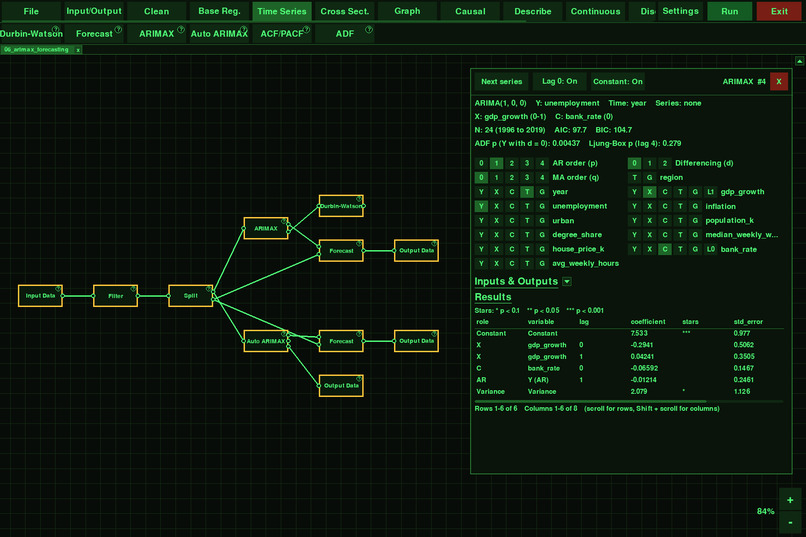
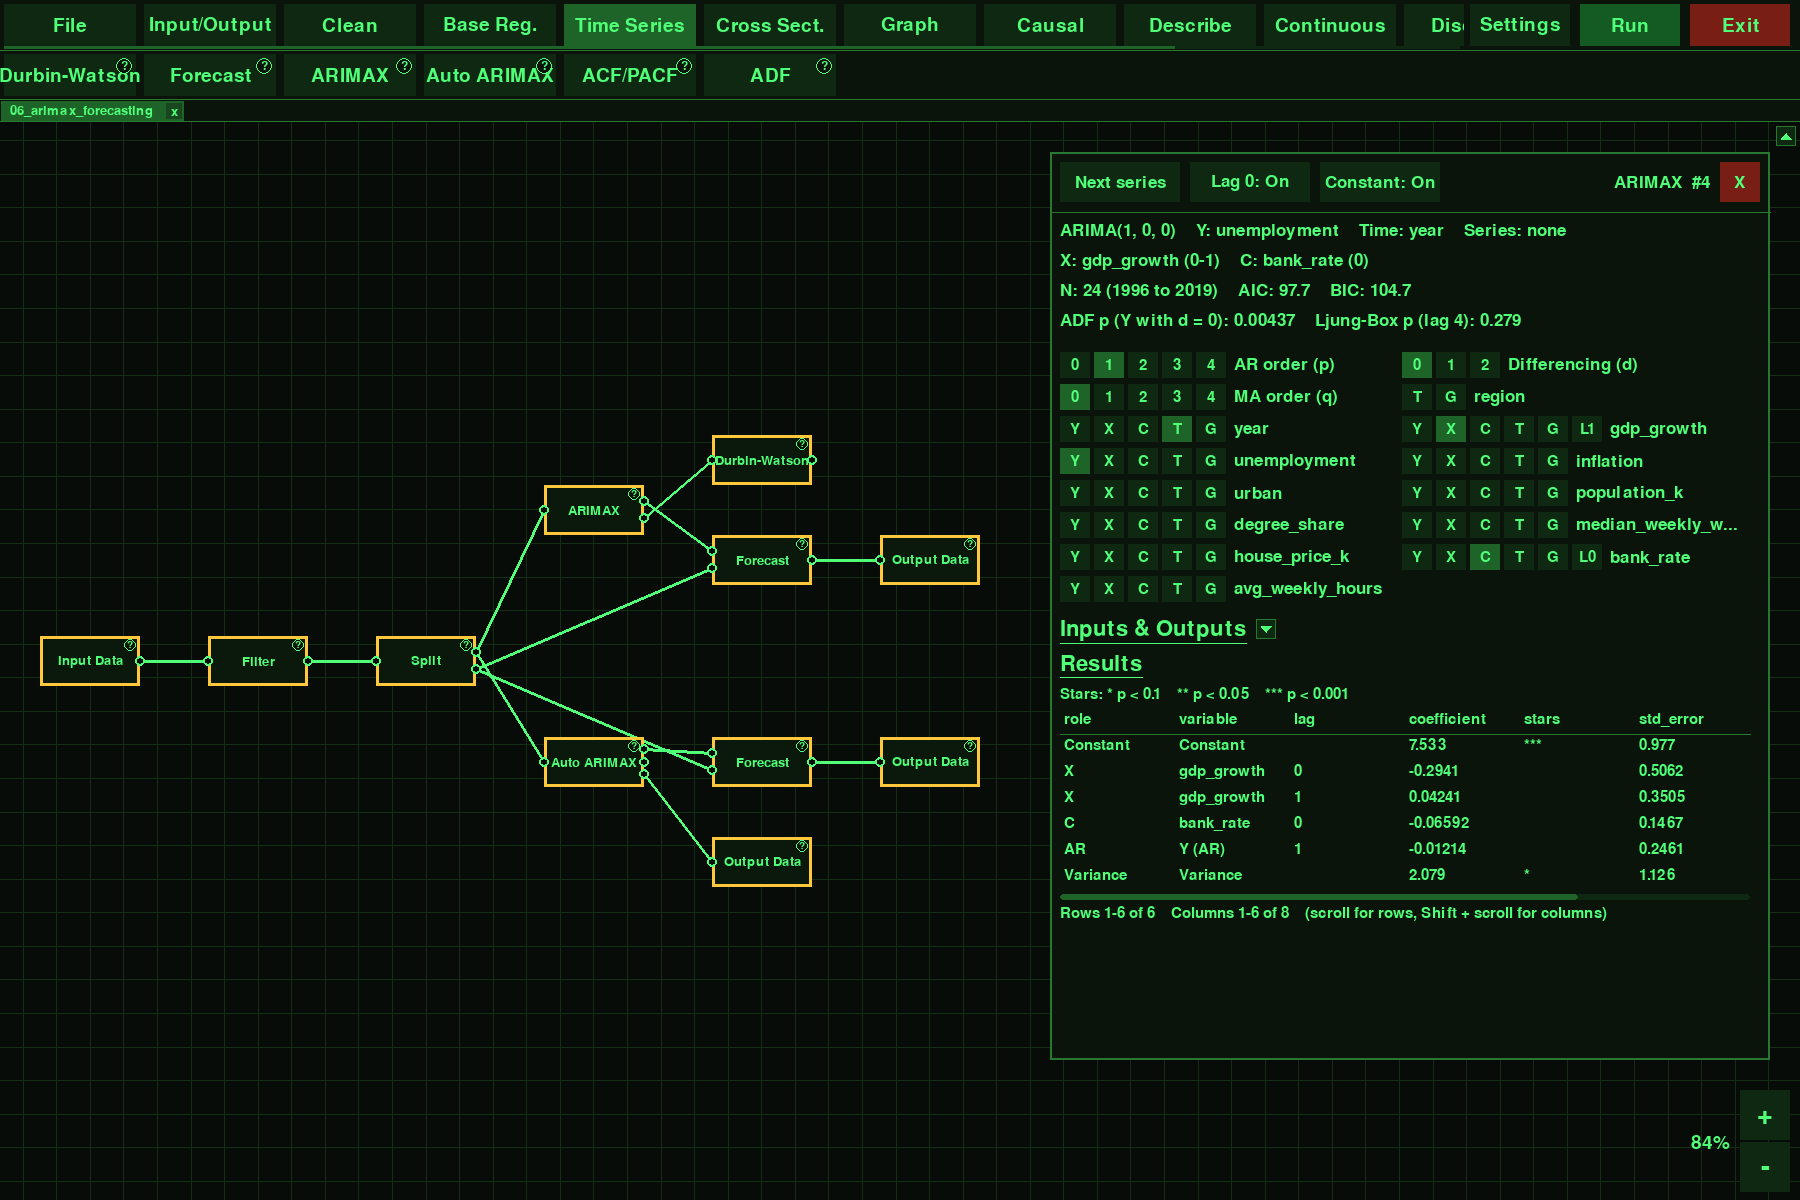
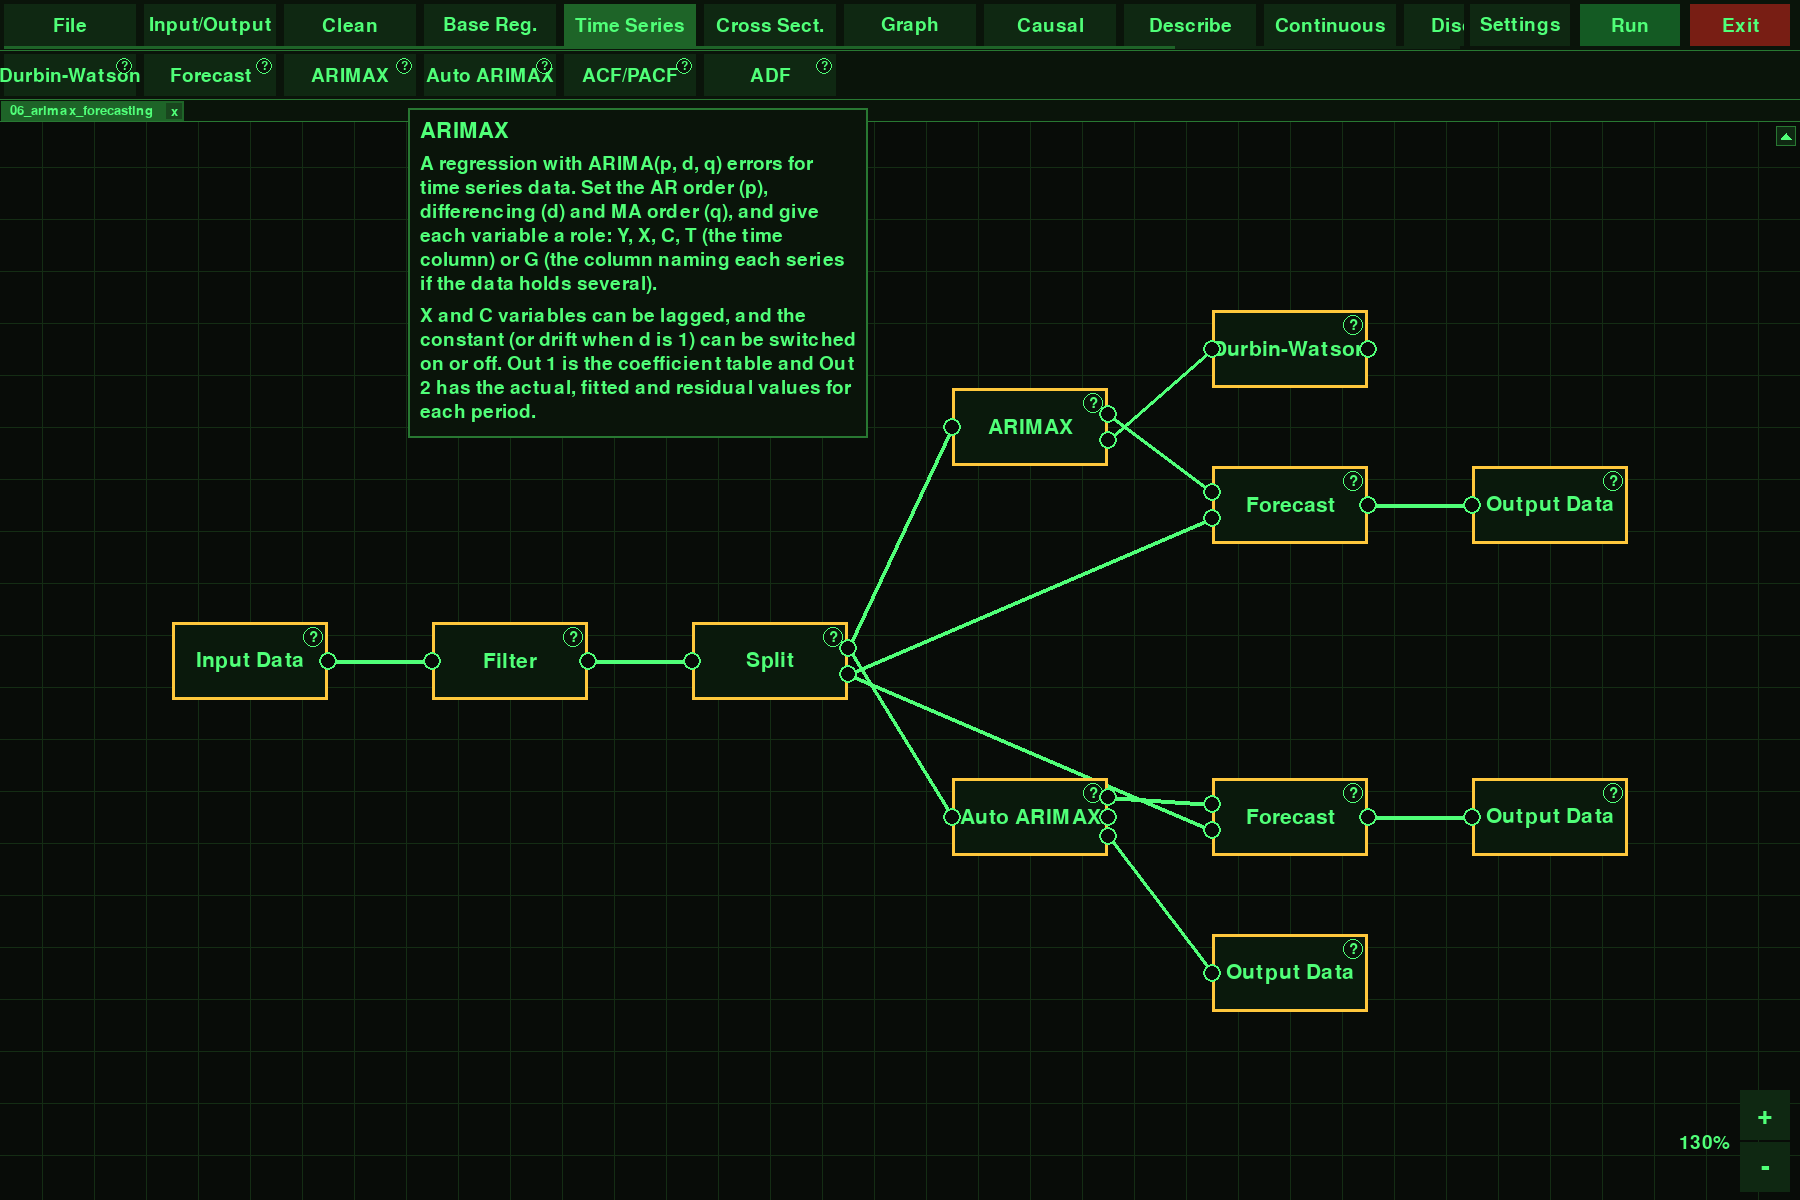
ARIMAX with lagged regressors: pick p, d and q with a click, then forecast with 90% prediction intervals.
-
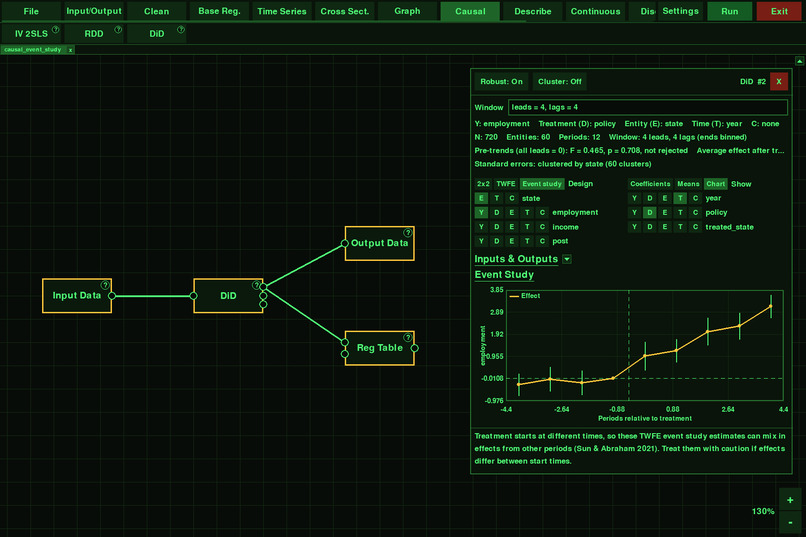
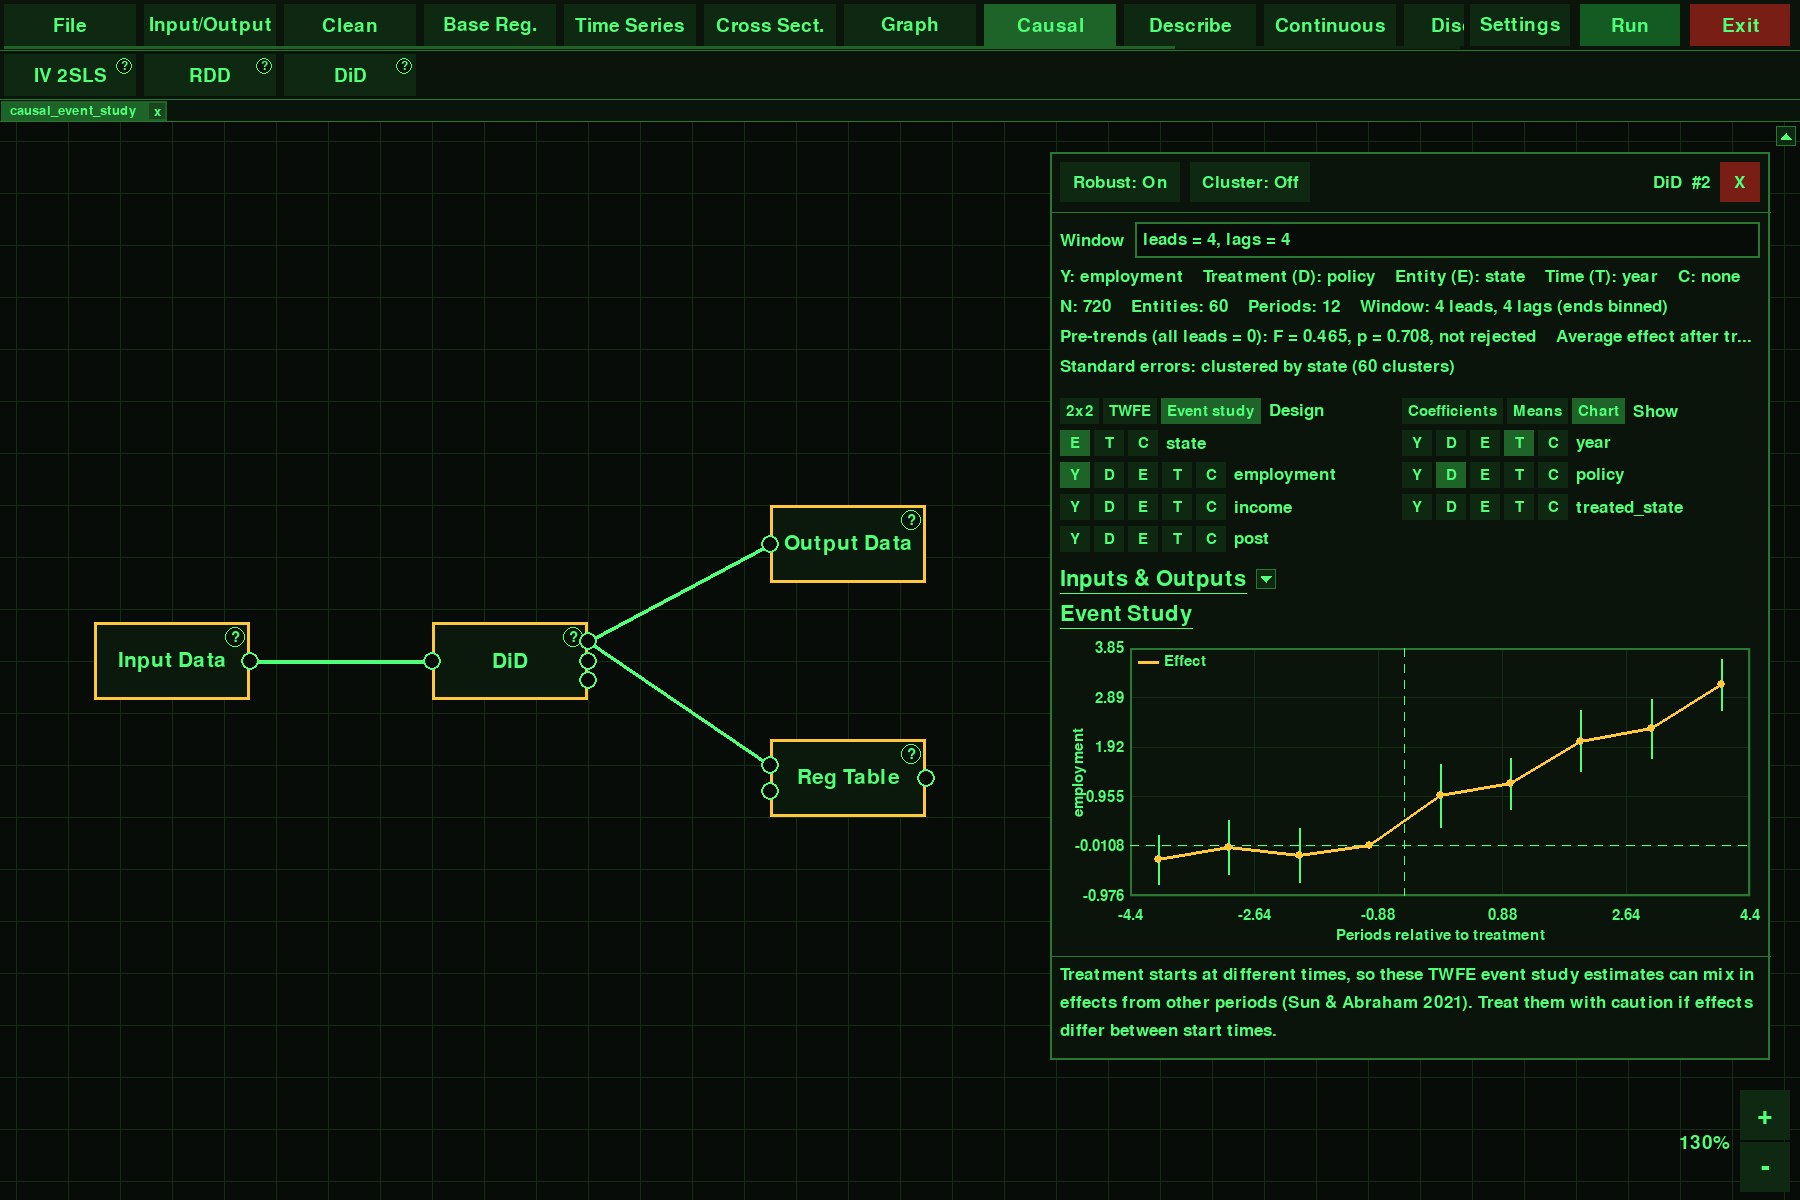
Causal add-on: difference-in-differences event study with confidence intervals and a pre-trends test.
-
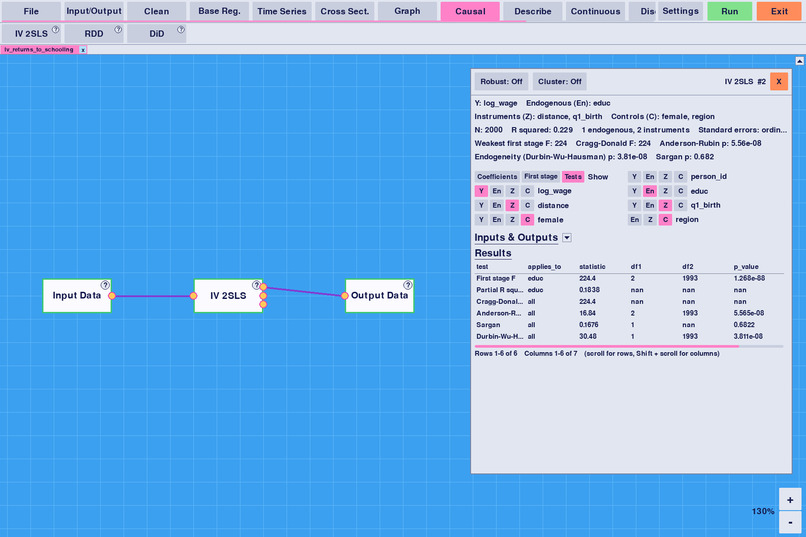
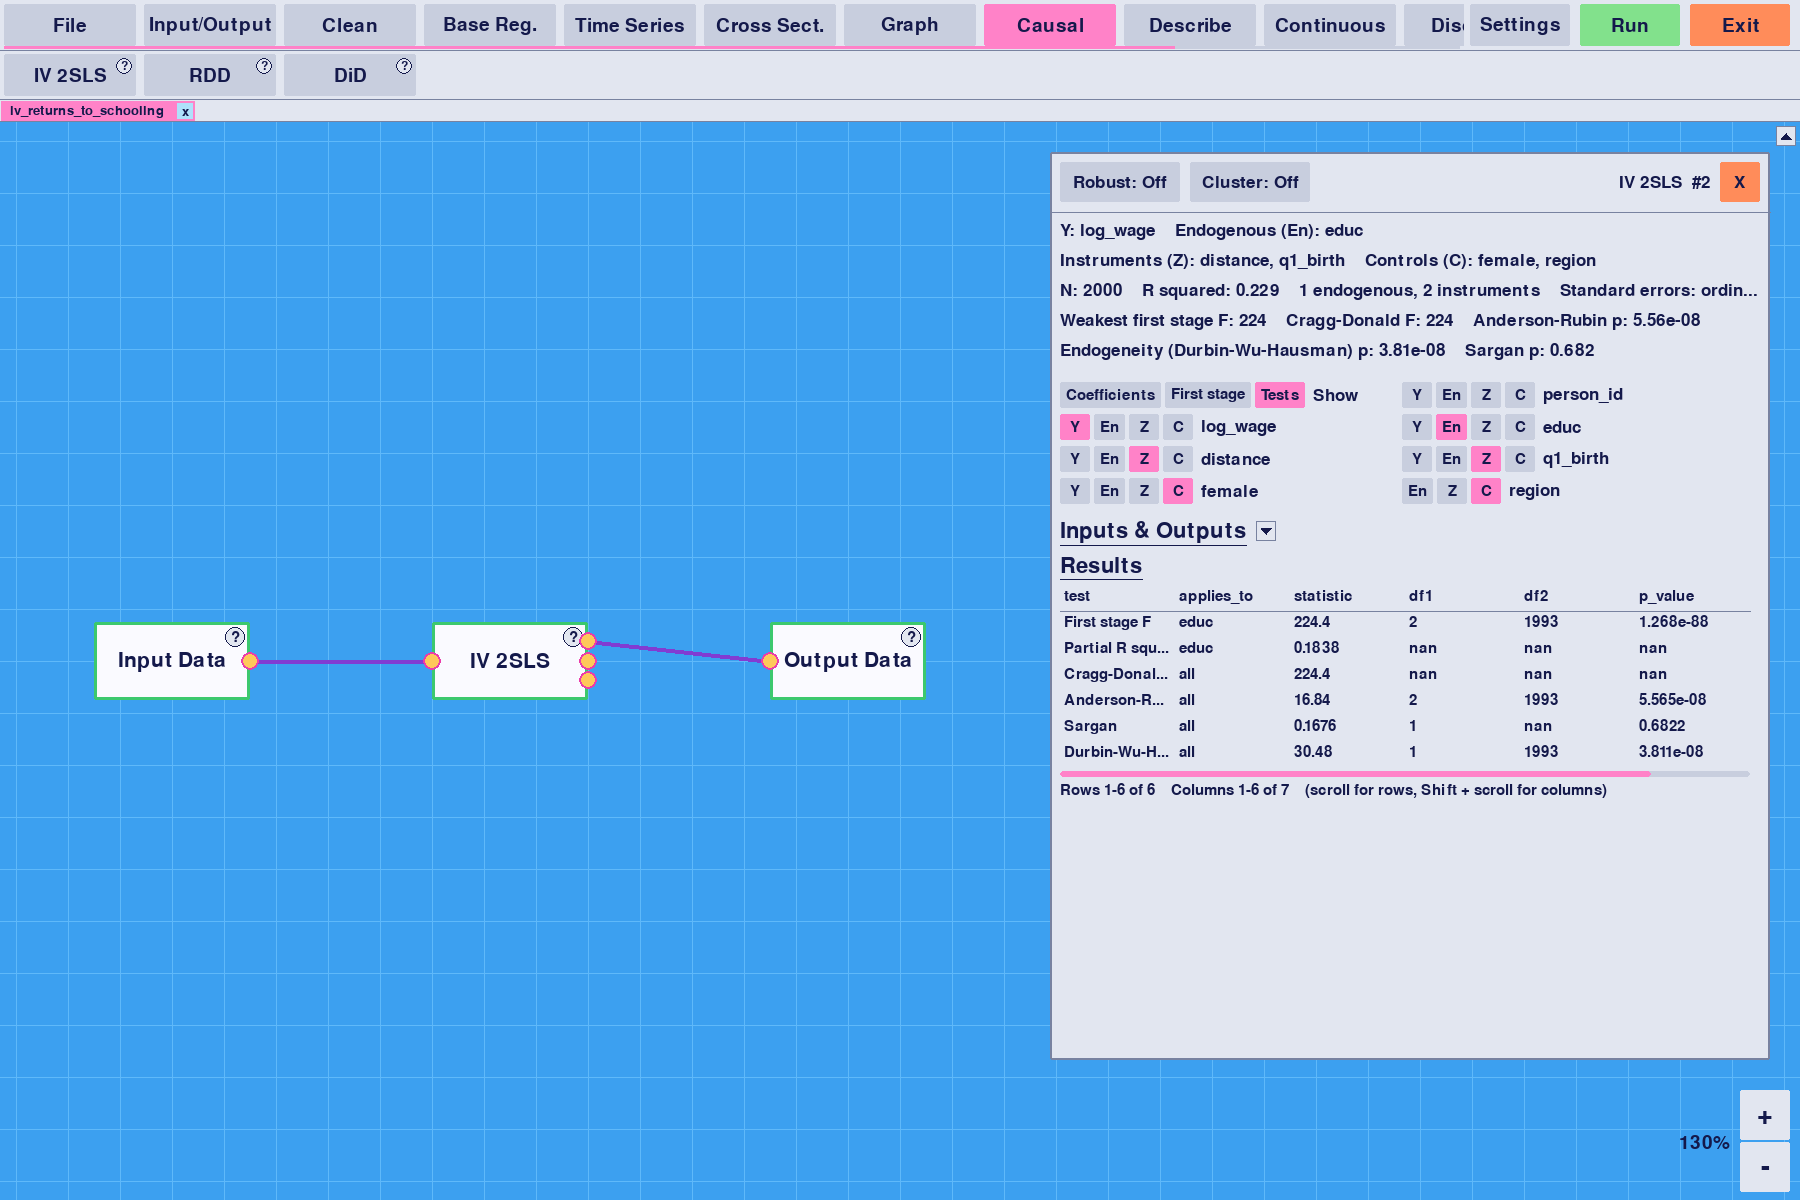
IV 2SLS in Y2K mode, with first-stage F, Cragg-Donald, Anderson-Rubin, Sargan and endogeneity tests built in.
-
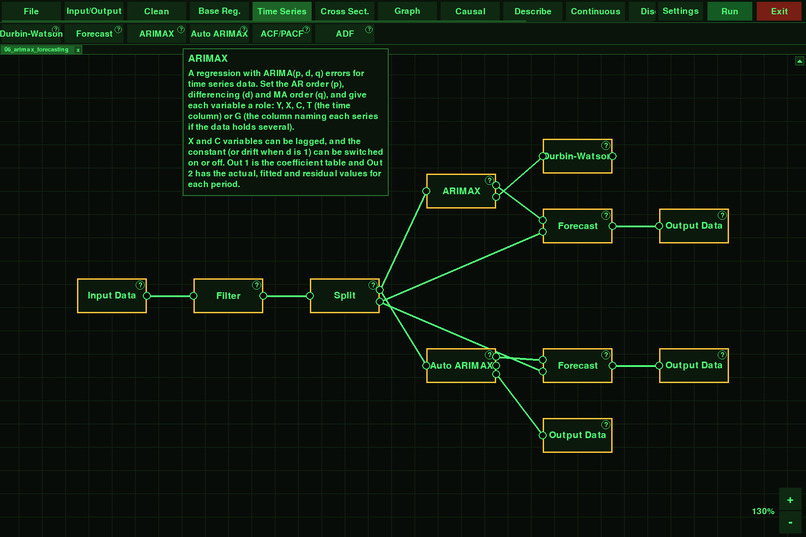
Stuck? Every module has a ? that explains what it does and what each input and output holds.
Inspiration
I wanted something with the statistical power of Stata and Python, but that was actually accessible, and that anyone could add to. I really like Alteryx and how you just drag boxes around and wire them up, but it costs a fortune, so most students will never get to use it. It also doesn't have the econometrics tools I actually need for my course. So I decided to build my own version with the econometrics built in.
What it does
Econometryx lets you do advanced statistics & econometrics by dragging modules onto a canvas and connecting them up. You load your data, clean it, run your models and export the results, all without writing any code. When you hit Run, every module goes green if it worked or red if it didn't, and you can click on any of them to see the output.
Right now it can do:
- Data cleaning (joins, filters, splits, sorting, making new variables like logs, lags and growth rates)
- OLS (with robust or clustered errors), Auto OLS, logit and probit
- Time series stuff: ARIMAX, Auto ARIMAX, ACF/PACF, ADF/KPSS and Durbin-Watson
- Fixed effects, random effects and the Hausman test
- Out-of-sample forecasting
- Scatter plots and bar charts
On top of that there's an add-on system, so you can load extra packs. I made six: causal inference (IV, RDD and diff-in-diff), descriptive stats, probability distributions, more graphs, ordered logit/probit, and a regression table maker that exports to Excel in the style journals use. You can write your own packs too.
One thing I really wanted was for the app to tell you what your results mean, not just give you regression coefficients. So if your residuals look heteroscedastic, it tells you to turn on robust errors. If you only have 20 clusters, it warns you your standard errors might be off. Every module also has a little '?' button explaining what it does.
Workflows save as Econometryx’s own workbook files (.ectyx), so you can save a project and load it back exactly as you left it. You can also have several workbooks open at once and switch between them, which makes it easy to compare different versions of a model or keep a few projects going at the same time.
There are also three themes (Normal, Y2K and Retro). The Retro one is a green terminal look, and it's my personal favourite.
How I built it
It's all in Python. I used Pygame for the whole interface, and pandas, statsmodels and SciPy for the actual stats. I really wanted to focus Econometryx around complex and advanced stats, rather than building a UI from scratch. My deep knowledge and familiarity with Pygame allowed me to quickly and easily set up a working GUI and move on to the statistical software development.
Each module is its own folder with a module.py that says how many inputs and outputs it has, what its settings panel looks like and what it does when it runs. Add-on packs work exactly the same way, which is what makes it easy to expand; the GitHub contains a wiki that breaks down how to build a custom module.
A lot of the maths I wrote myself rather than leaning on a library, partly because I wanted to properly understand it. The IV module does 2SLS by hand:
$$\hat\beta_{2SLS} = (X^\top P_Z X)^{-1} X^\top P_Z y, \qquad P_Z = Z(Z^\top Z)^{-1} Z^\top$$
It then reports the first-stage F, Cragg-Donald, Anderson-Rubin, Sargan and Durbin-Wu-Hausman tests next to the estimates, so you can check whether your instruments are any good.
The diff-in-diff module can run a TWFE event study:
$$y_{it} = \alpha_i + \lambda_t + \sum_{k \neq -1} \beta_k \mathbf{1}[t - E_i = k] + \varepsilon_{it}$$
with errors clustered by entity. It also runs a joint F-test that all the leads are zero, as a pre-trends check, and plots each βₖ with its confidence interval.
Robust errors in OLS use the HC1 sandwich:
$$\hat V_{HC1} = \frac{n}{n-k} (X^\top X)^{-1} \left( \sum_i \hat u_i^2 x_i x_i^\top \right) (X^\top X)^{-1}$$
Challenges I ran into
The add-on system took forever. Getting packs to load while the app is running, slot into the right toolbar tabs and be removable without breaking everything was way harder than I thought it would be.
The other big one was that real data breaks textbook formulas. The Hausman test is a good example:
$$H = (\hat\beta_{FE} - \hat\beta_{RE})^\top \left[ \hat V_{FE} - \hat V_{RE} \right]^{-1} (\hat\beta_{FE} - \hat\beta_{RE}) \sim \chi^2_k$$
In theory, V̂_FE − V̂_RE is positive definite, but in actual samples it often isn't, and then H can come out negative or just be nonsense. So the module only uses the directions where the difference is positive definite, and it tells you that's what it did. There were loads of little things like this. Clustering with only 20 groups biases your standard errors down. A TWFE event study with staggered treatment timing can mix up effects from different periods (the Sun & Abraham problem). Each of these needed a fallback or a warning that makes sense to someone who isn't an econometrician, rather than the app just crashing.
Accomplishments that I'm proud of
Getting 25 core modules and 6 add-on packs working in a weekend! I also built 8 sample workflows that go from a basic regression to a full project, so someone new can learn from them. And the diff-in-diff event study chart looks really cool in the retro theme.
What I learned
I learned a lot more econometrics than I expected. You can't explain a test's output to someone else until you understand it yourself, especially in edge cases where the textbook definitions don't work. I also learned that planning the structure early saves loads of time later: once every module followed the same layout, adding new ones got really quick. This is the first time I have ever planned a project, or at least to this level. Designing how the engine, ui & app work before beginning coding made it all work a lot more seamlessly.
What's next for Econometryx
I'd like to add more methods (GMM, VAR, quantile regression, maybe some machine learning), make an installer so you don't need Python, and set up the git hub and/or a server to store community-made modules. As there are minimal restrictions on modules, entire workflows can, in theory, be built inside one node, allowing potentially huge workflows to be designed within one canvas. At the moment, there is no GitHub link, as I want to continue to develop it before releasing a pre-release. I am also unsure how I want to licence it - and what the future of Econometryx will entail!


Log in or sign up for Devpost to join the conversation.