-
-

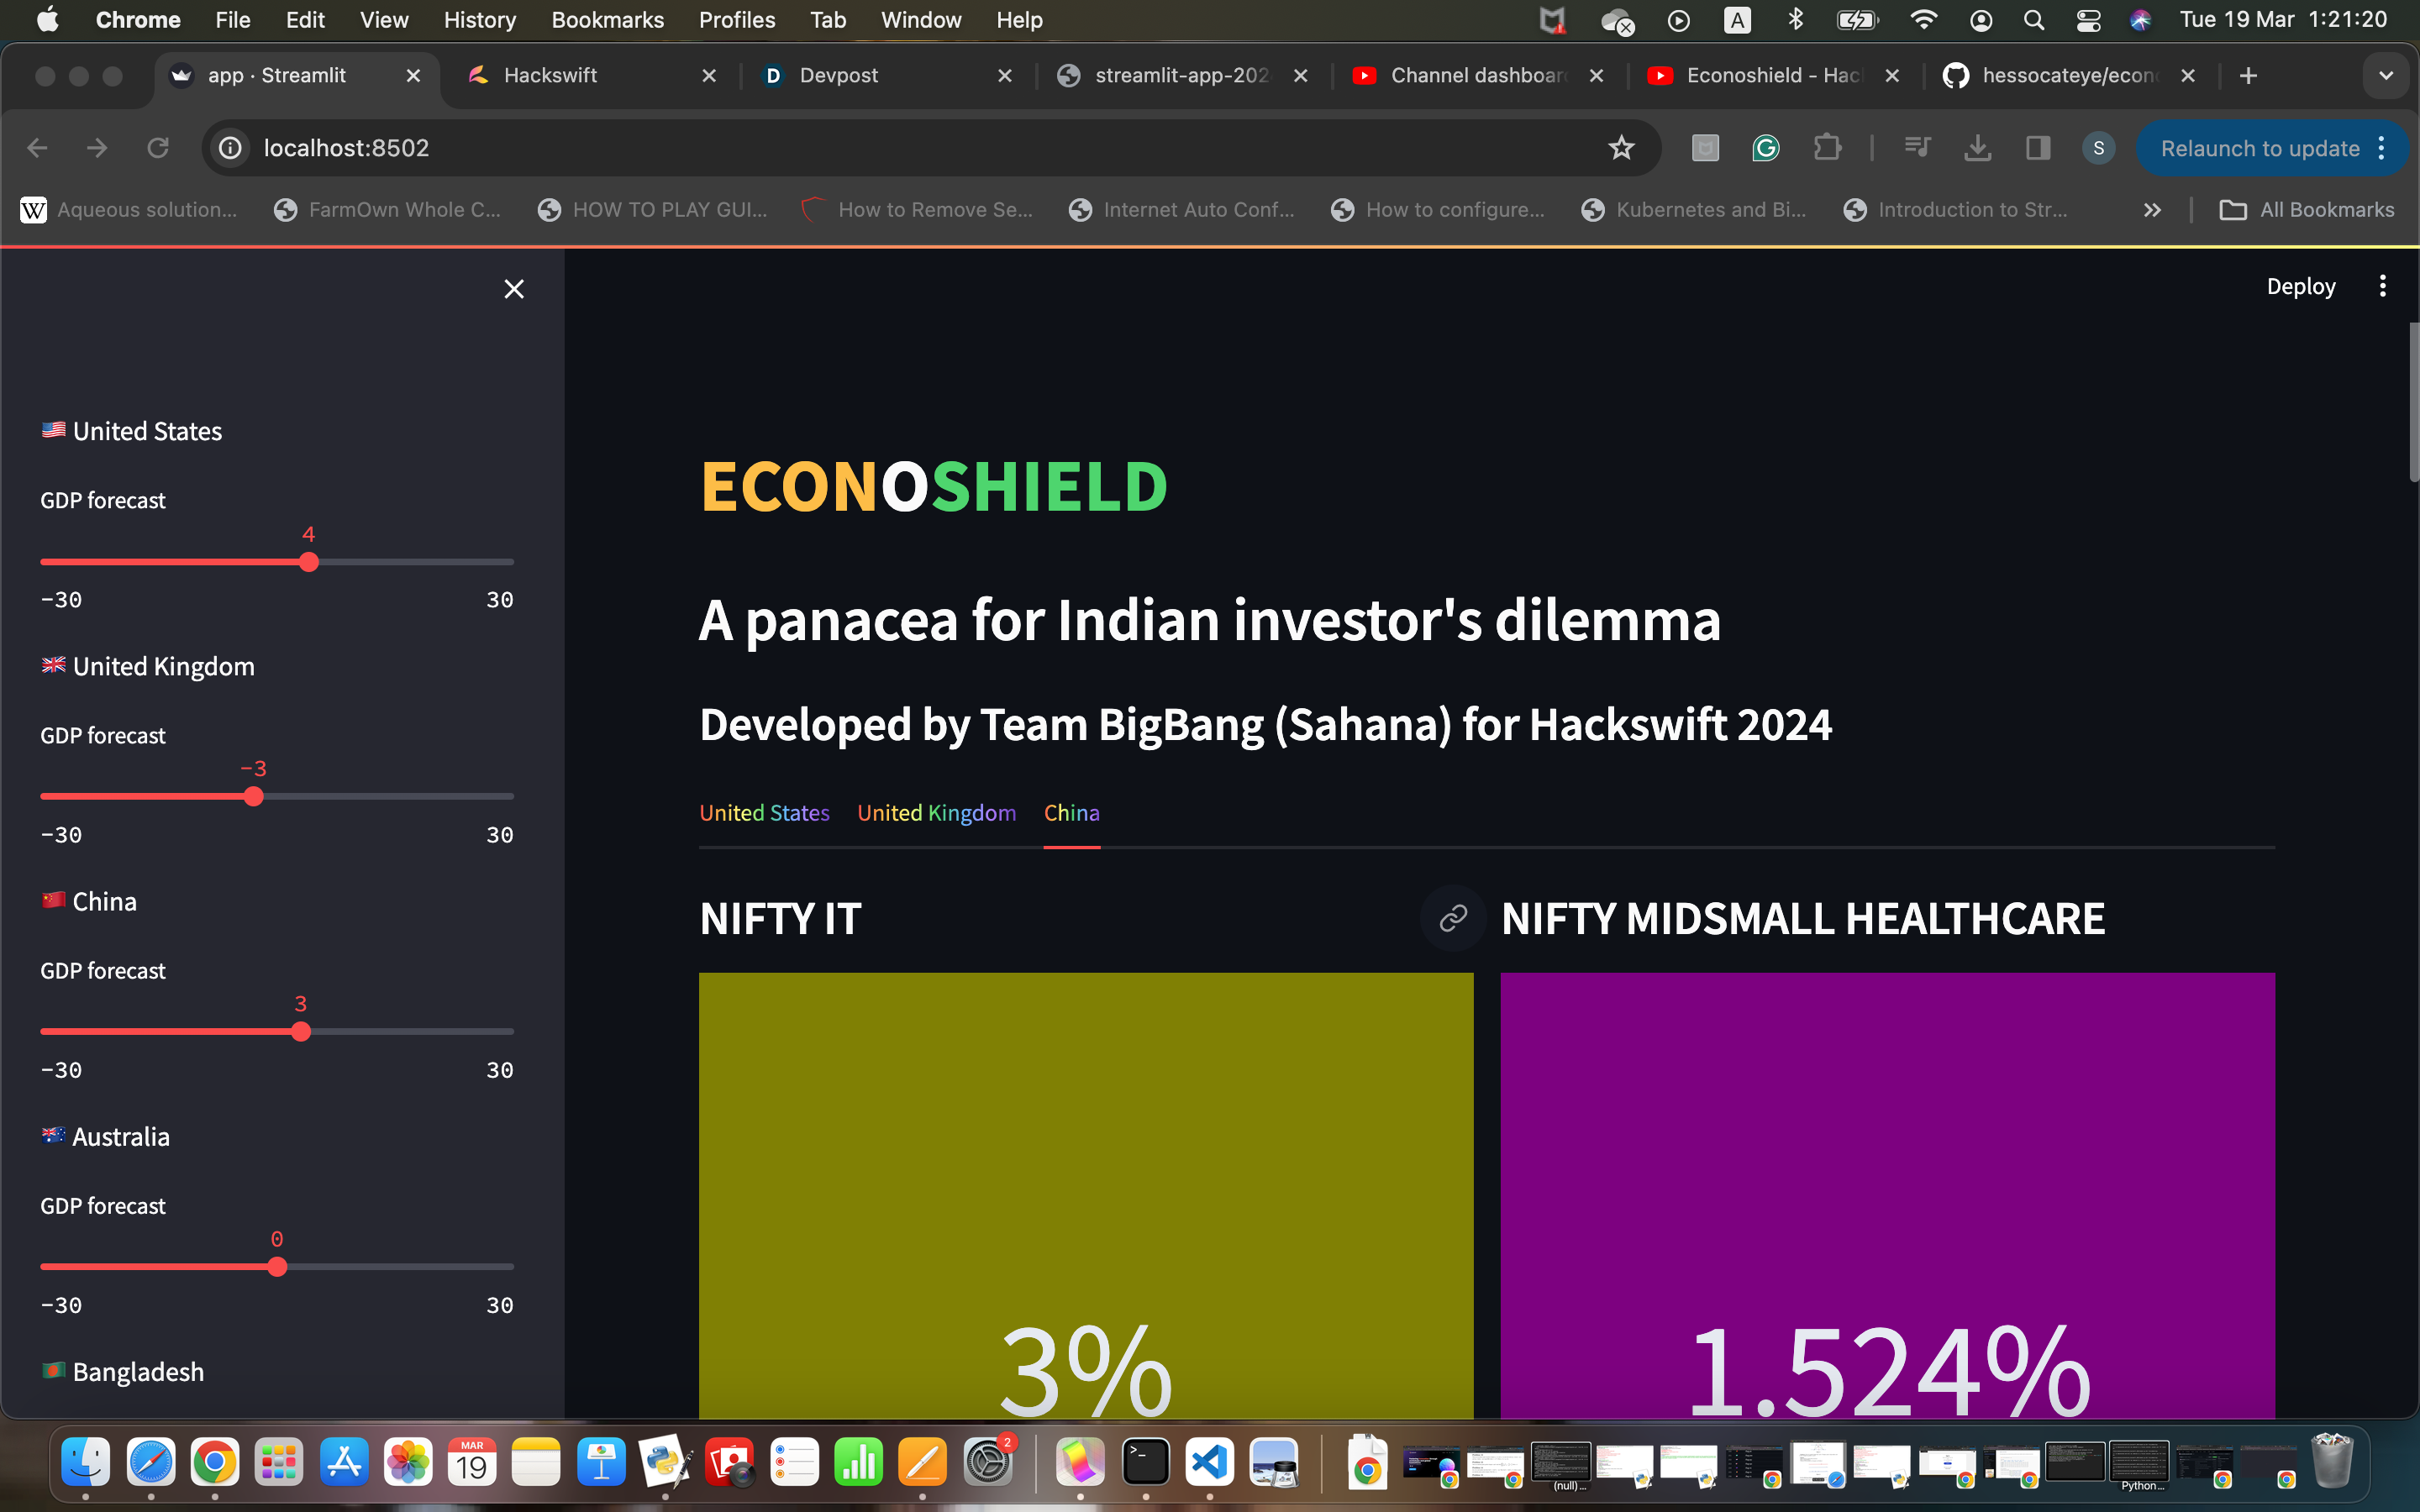
Whatif tool showing impact of GDP changes on Indian sectors
-

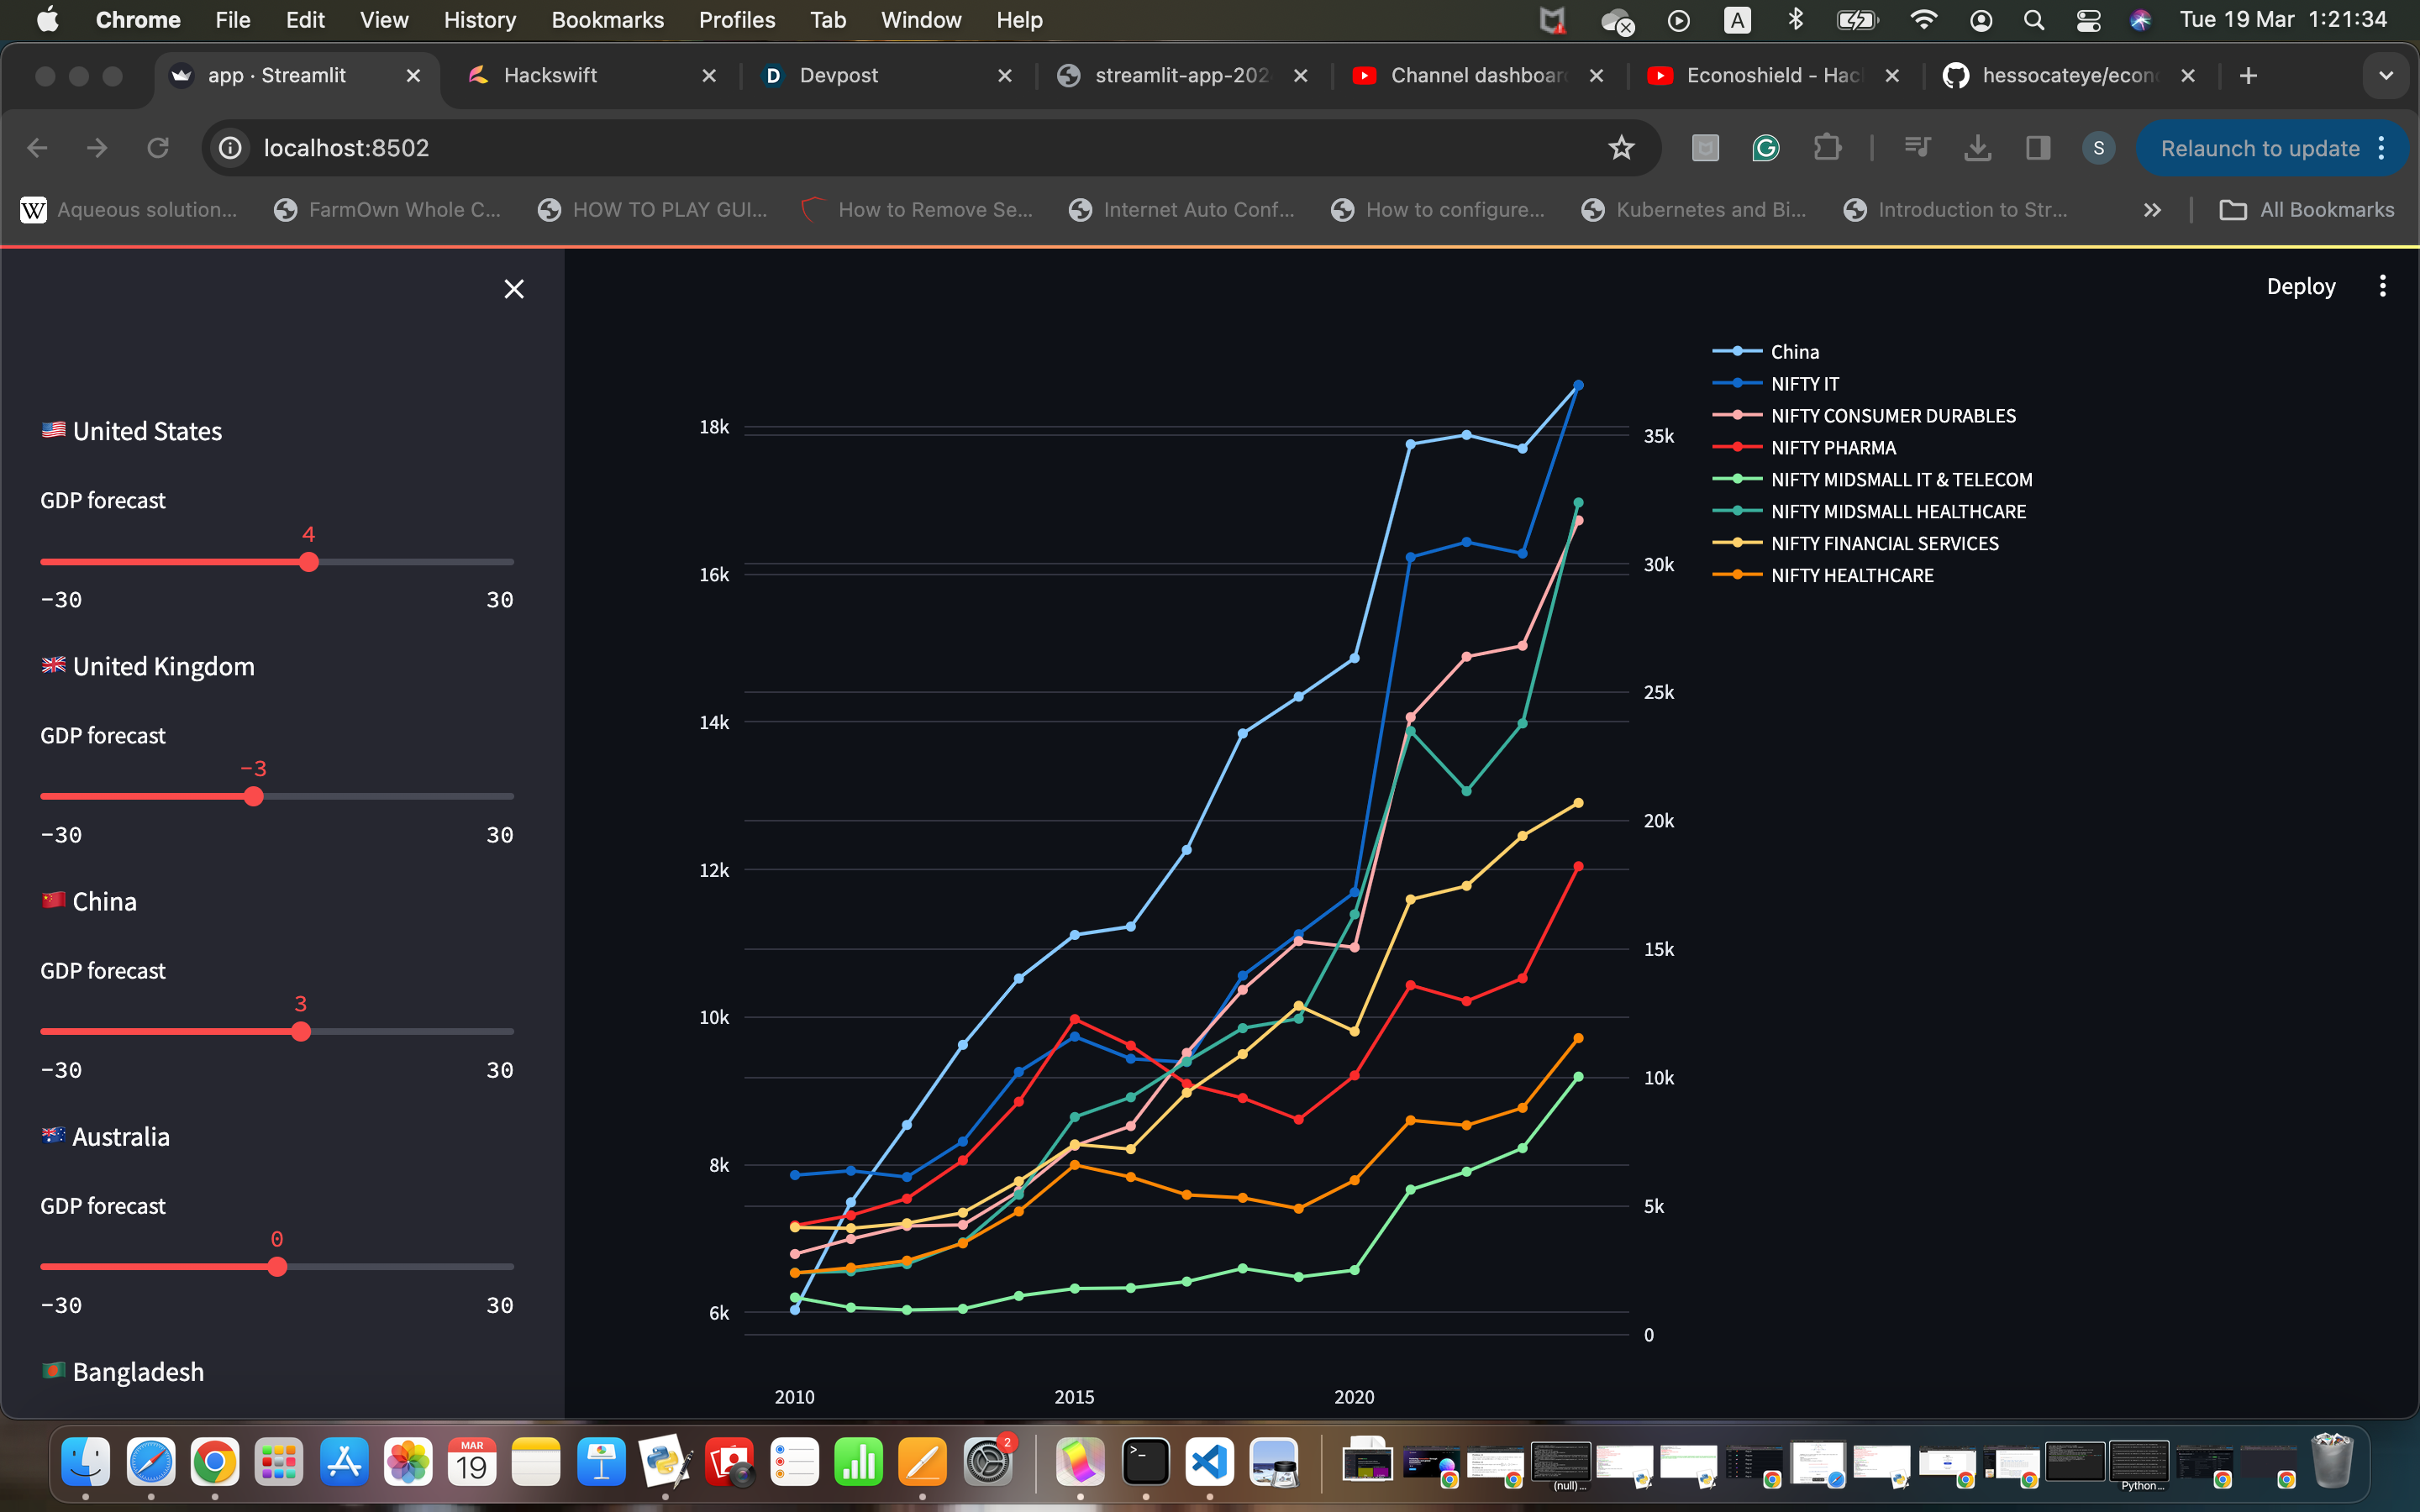
Curves of GDP and the affected Indian sectors over the years
Inspiration
The Russia-Ukraine war had negative impacts on investors worldwide, especially small investors. Such investors don't have a tool that helps them understand the impact of global events. So, I decided to make an app that helps them decide if they can invest money in a specific sector in the wake of hypothetical economic downturns.
What it does
Econo Shield is a tool that helps investors understand what sectors in India will be affected when GDP of other countries go downhill or uphill
How we built it
I first collected sector-wise performance data from India (based on broad-based indices) and regressed it with GDP of other countries that trade with India. I then developed a streamlit app to expose this intelligence in a user-friendly way that facilitates whatif analysis.
Challenges we ran into
- Data collection and cleaning was a major task. I first relied on 'Yahoo Finance' to programmatically fetch the data but it did not have all the sector indices that I desired. So, I had to manually download data from NIFTY indices website. This also had its fair share of problems but luckily I was able to download all the required data with a bit of patience.
- GDP is published only yearly by IMF. Quarterly GDP was not available. It would have been a lot better from a modeling perspective if Quarterly GDP data were available.
- Learning new technology is always an uphill task. However, streamlit was so easy to learn quickly.
Accomplishments that we're proud of
A user-friendly app that showcases the impact of GDP of trading partners on various Indian sectors is too difficult to achieve within a span of 3 days. I am proud that we managed to build it in such a short span of time. I am also very proud of being able to learn a new technology in such a short duration.
What we learned
Streamlit is a powerful tool for rapid web development esp. for data-related applications. I embarked on learning Streamlit just 3 days ago with some guidance from my dad. I can't believe I could create an app so fast. Plotly is a great library for plotting interactive graphs. Combining these two can create very powerful interactive what-if analysis tools.
What's next for Econo Shield
The current tool is just a prototype to show the vision. Modeling economic dependencies between countries can be a tough problem. So a deeper analysis with more fine-grained data can reveal more intelligence which would make the tool a lot better. Currently, I am relying on IMF for GDP data. One can also look at individual country's statistics bureau to download more fine-grained data. I also imagine creating a digital-twin that replicates the economy and allows us to run custom simulations. That would be a moonshot project. But I hope with increasing data awareness and collection, it may be achievable in near future.
Built With
- lasso
- python
- scikit-learn
- streamlit
- yahoofinance

Log in or sign up for Devpost to join the conversation.