-
-

Logo
-
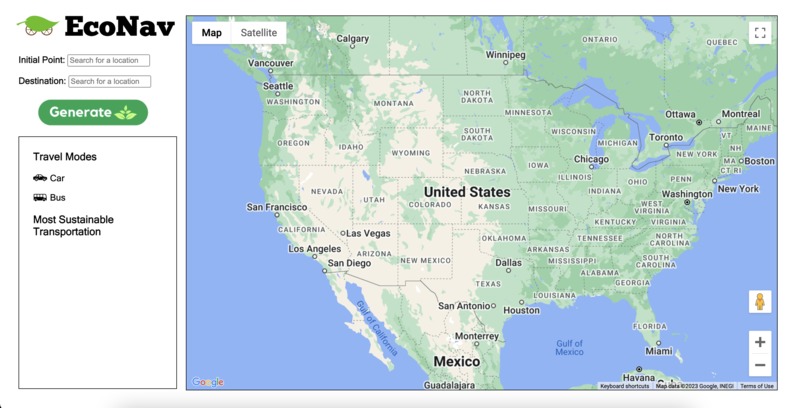
Default
-
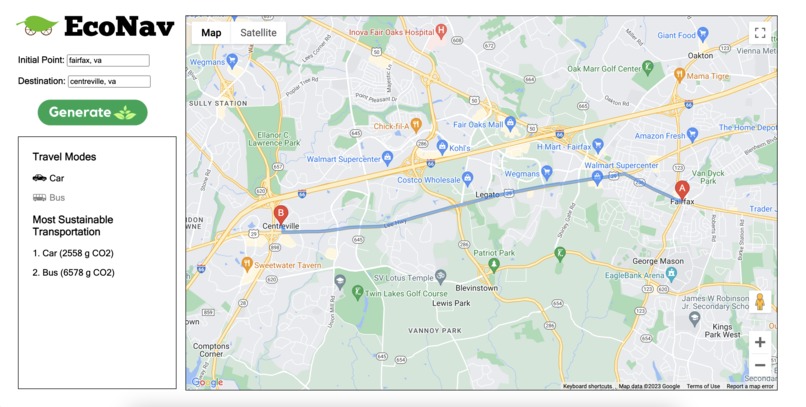
Example in Use


Inspiration
Carbon footprint has dramatically increased over the decade and impacts global issues today such as global warming and climate change. Because motor vehicles are one of the top contributors to greenhouse gas emissions, we wanted to create a solution to educate people on how to lower their carbon footprint through transportations.
What EcoNav does
It takes a route to and from destinations of the user’s choice and portrays the carbon emission (in grams) for the different types of transportations, those transportations being car or bus. By using the average carbon footprint per mile for each transportation type, we were able to calculate a rough estimate for the total carbon emission. The data is then displayed and shows the user which method of transportation emits the least amount of carbon emission while stating the rough estimate in parentheses. Because buses typically take longer routes while cars leave more carbon footprints per mile, there is a variety in the results as the starting point and destination differ.
How we built EcoNav
With HTML, CSS, Javascript, Google Maps API, Canva, and Flat Icons, we were able to build our website. We also used an article published on Feb. 11 2022 by Jake Blumgart on the Governing to find the average carbon footprint per mile for both buses and cars (Link to article: https://www.governing.com/next/are-trains-or-buses-better-for-the-environment#:~:text=Buses%20come%20in%20at%20299,generations%20of%20low%20emission%20travel).
Challenges we ran into
The major challenge we ran into was our limited options of transportation routes because the Google Map API only provided routes for cars and buses even though we wanted to expand to airplanes and boats. We also lacked data that covered the walking distance for the bus routes. In our carbon emissions data, the carbon footprint of the buses includes the walking distance when multiplied the average carbon emission per mile with our total distance. Another challenge we experienced was the difficulty of using Javascript. We almost switched over to Unity actually because we are more experienced with C#, but Unity was deprecated of the Google Map SDK just last year. Therefore, the dilemma was to either push through or try a new project.
Accomplishments that we're proud of
We were the most proud of being able to include the map and its routes, especially since it was very challenging. We were able to follow through though because we wanted the users to have a visual representation of their data. We are also proud of the UI design because we aren’t the best with graphic design and was satisfied with our layout. Lastly, we are proud of our use of containers because after establishing how to use them, we were free to mess around with our website's appearance (it also reminded me (Claire) about my Adv. Comsci project from last year).
What we learned
As programmers who are more experienced with backend applications, this project was a learning experience because it was more frontend based. We were able to learn how to use HTML, CSS, and Javascript as well as the Google Map API. The API was difficult to use because we’ve never tried using an API with Javascript. However, with thorough research and reading of the documentation (around 5 million times), we were able to do it successfully!
What's next for EcoNav:
In the future, we hope to include more modes of transportation by finding other APIs that could provide data for sea and air travel routes. Also, we hope that we can make the search bar more user-friendly so that users don't have to be too specific on the location. We could do this by implementing an autocomplete feature to give suggestions on the location based on what they have typed so far or give a list of potential locations below the search bar.
Built With
- canva
- css
- flat-icons
- google-maps
- html
- javascript

Log in or sign up for Devpost to join the conversation.