-
-

Dashboard
🔥 Inspiration
We walk through the same streets daily, but rarely “hear” their voices. Data on air, greenery, or waste is available, yet detached. We wanted to turn environmental data into personal stories people can connect with and act upon
🎯 Main Goal
To make climate awareness local, personal, and actionable by turning a simple street photo into an engaging, shareable eco-narrative.
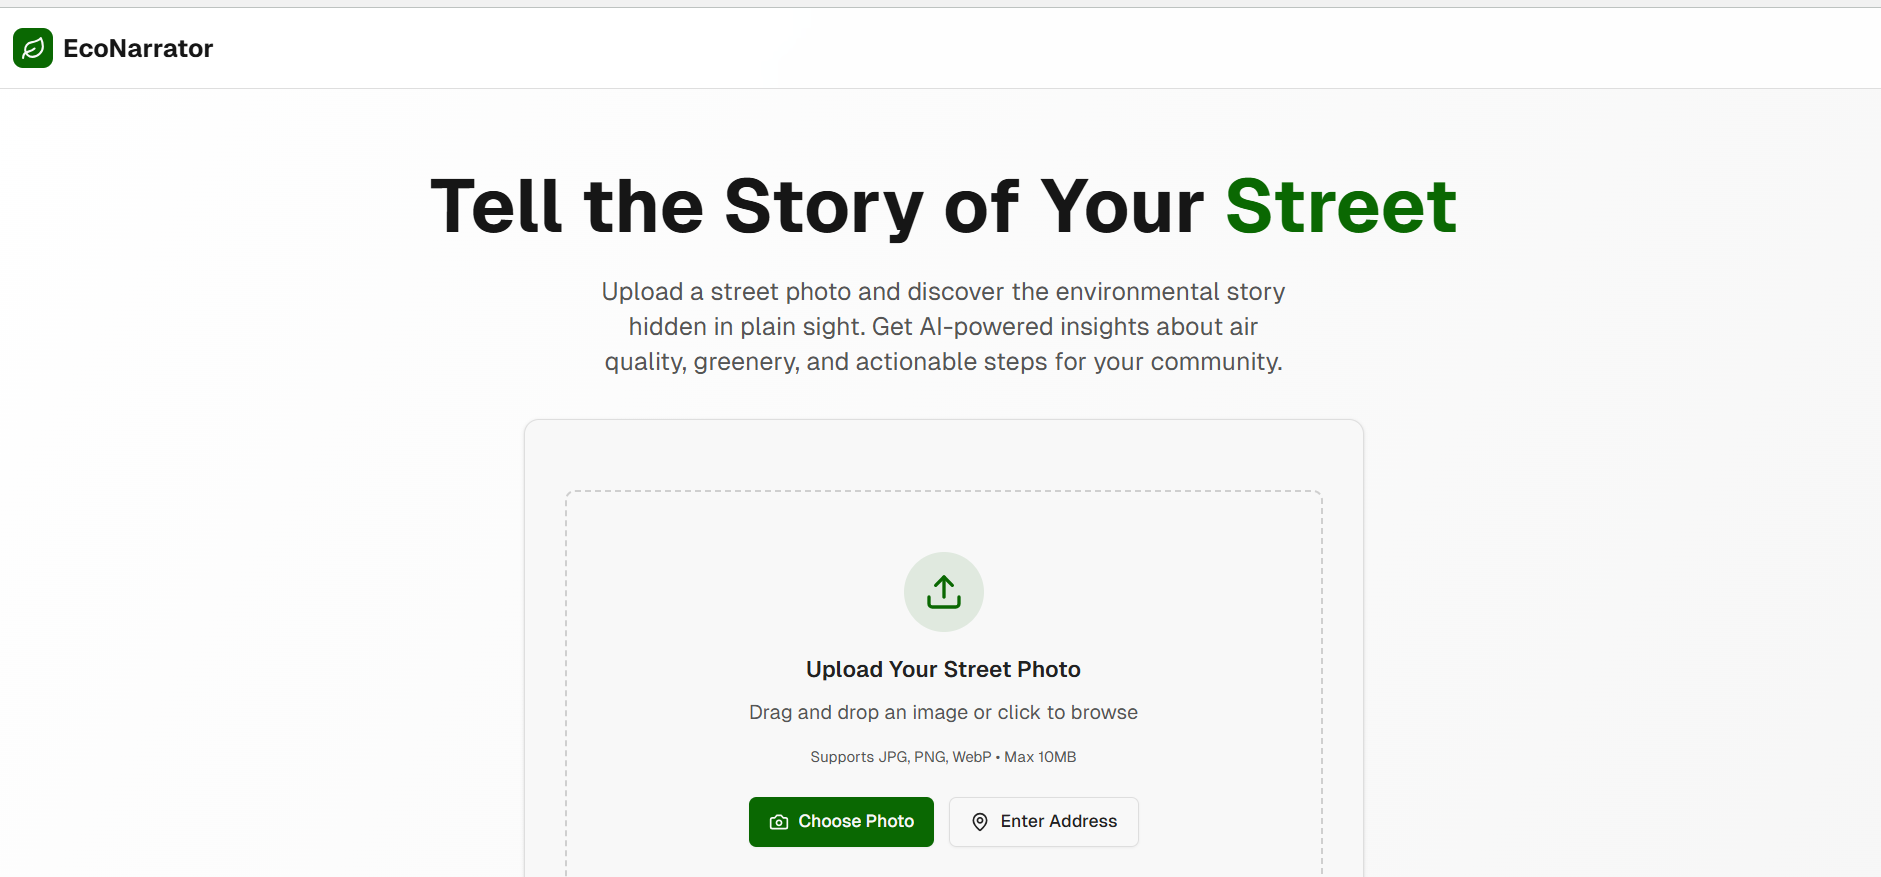
💡 What it Does
Users upload a photo or drop a location.
Our backend analyzes the image for greenery and litter, fetches local AQI + weather.
An AI model crafts a 3-paragraph story that describes the scene, highlights environmental health, and offers 3 practical actions.
Users see a story card, a GreenScore, and a map with their street’s data.
They can share the result as a postcard on social media.
⚙️ How We Built It
Frontend: React + TailwindCSS (clean, modern UI).
Backend: FastAPI (Python) to handle uploads, API calls, and AI integration.
AI Models:
Hugging Face segmentation model to detect greenery vs non-greenery.
Lightweight litter classifier to flag trash presence.
GPT-4 API to generate human-like eco-stories & action steps.
APIs & Data:
OpenAQ API for live air quality.
OpenWeatherMap API for weather data.
Mapbox for maps/geocoding.
Deployment: Vercel (frontend), Render (backend).
Database: MongoDB Atlas (store user uploads + analysis results).
Storage: Cloudinary for image storage.
🚧 Challenges We Ran Into
Integrating real-time data sources with image analysis outputs.
Balancing story length with meaningful data inside LLM prompts.
Optimizing CV models to run quickly in hackathon constraints.
Designing a UI that feels emotional yet data-driven.
🏆 Accomplishments We’re Proud Of
Built a working prototype in one weekend that combines CV, APIs, and storytelling.
Created a clean narrative format that anyone can understand in 20 seconds.
Designed a UI/UX that judges said “feels like a postcard from your own street.”
📖 What We Learned
How to integrate multiple AI models (CV + LLM) in a single user journey.
The importance of storytelling in tech numbers alone don’t drive action.
The value of simplicity: one photo, one story, one action = maximum impact.
🔮 What’s Next
Expand from photos to short video stories with voice narration.
Build community “eco-maps” where users can see stories layered citywide.
Partner with NGOs/schools to gamify eco-action with leaderboards.
Add multilingual story support for wider accessibility.
Example Code
from fastapi import FastAPI, UploadFile import requests from PIL import Image from transformers import pipeline import openai
app = FastAPI()
Load HuggingFace model for segmentation
seg_model = pipeline("image-segmentation", model="facebook/detr-resnet-50")
@app.post("/analyze") async def analyze(file: UploadFile): image = Image.open(file.file) seg_output = seg_model(image)
# Extract greenery percentage
greenery = sum([s['score'] for s in seg_output if s['label'] == 'tree'])

# Fetch air quality data
aq = requests.get("https://api.openaq.org/v2/latest?city=Delhi").json()

# Generate story with GPT
prompt = f"""
Write a 3-paragraph story about a street with {greenery*100:.1f}% greenery,
AQI={aq['results'][0]['measurements'][0]['value']}. Suggest 3 actions.
"""
openai.api_key = "YOUR_KEY"
story = openai.Completion.create(model="gpt-4", prompt=prompt, max_tokens=300)

return {"greenery": greenery, "aqi": aq, "story": story.choices[0].text}
Built With
- cloudinary
- fastapi
- github
- huggingface
- javascript
- mapbox
- mongodb
- openai
- openaq
- openweathermap
- python
- react
- render
- tailwindcss
- vercel


Log in or sign up for Devpost to join the conversation.