-
-
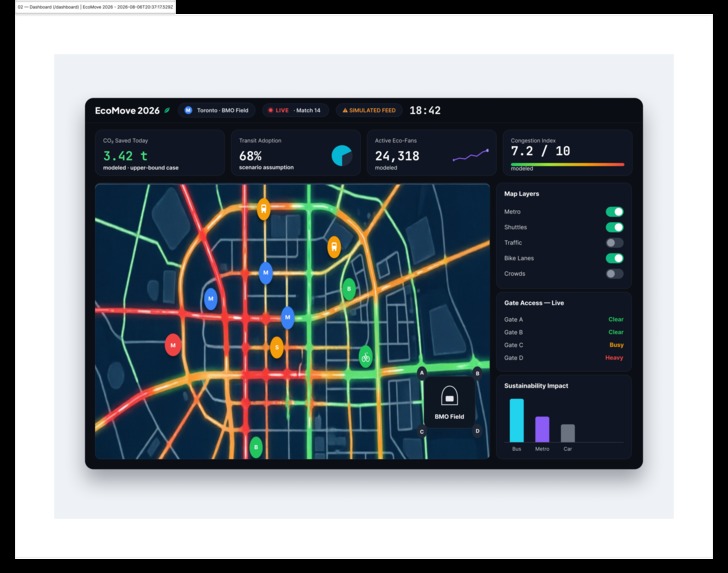
Dashboard of EcoMove
-
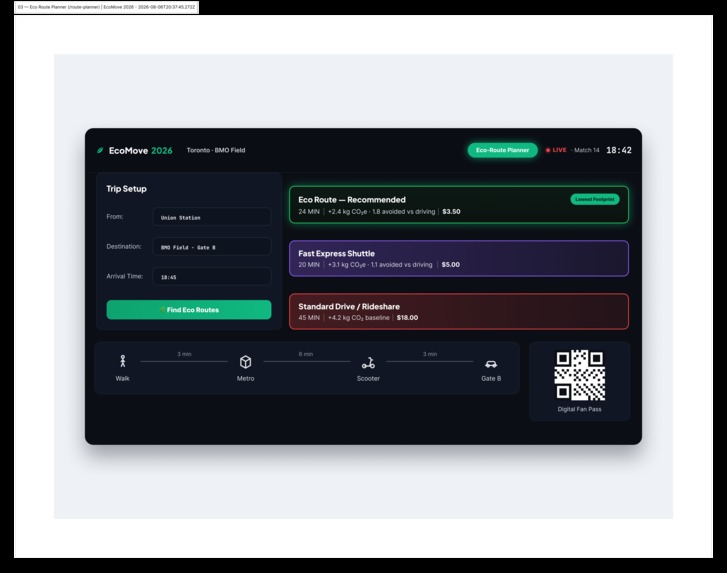
Eco_route Planner of EcoMove
-
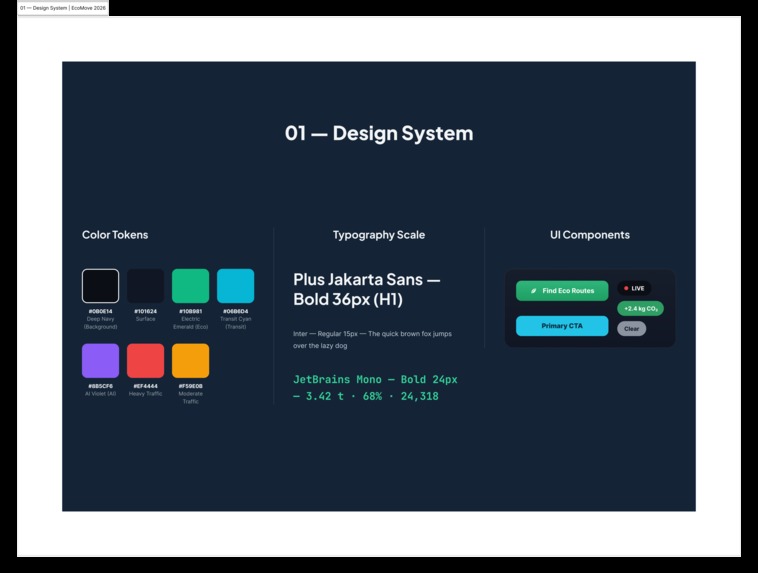
Design system of EcoMove
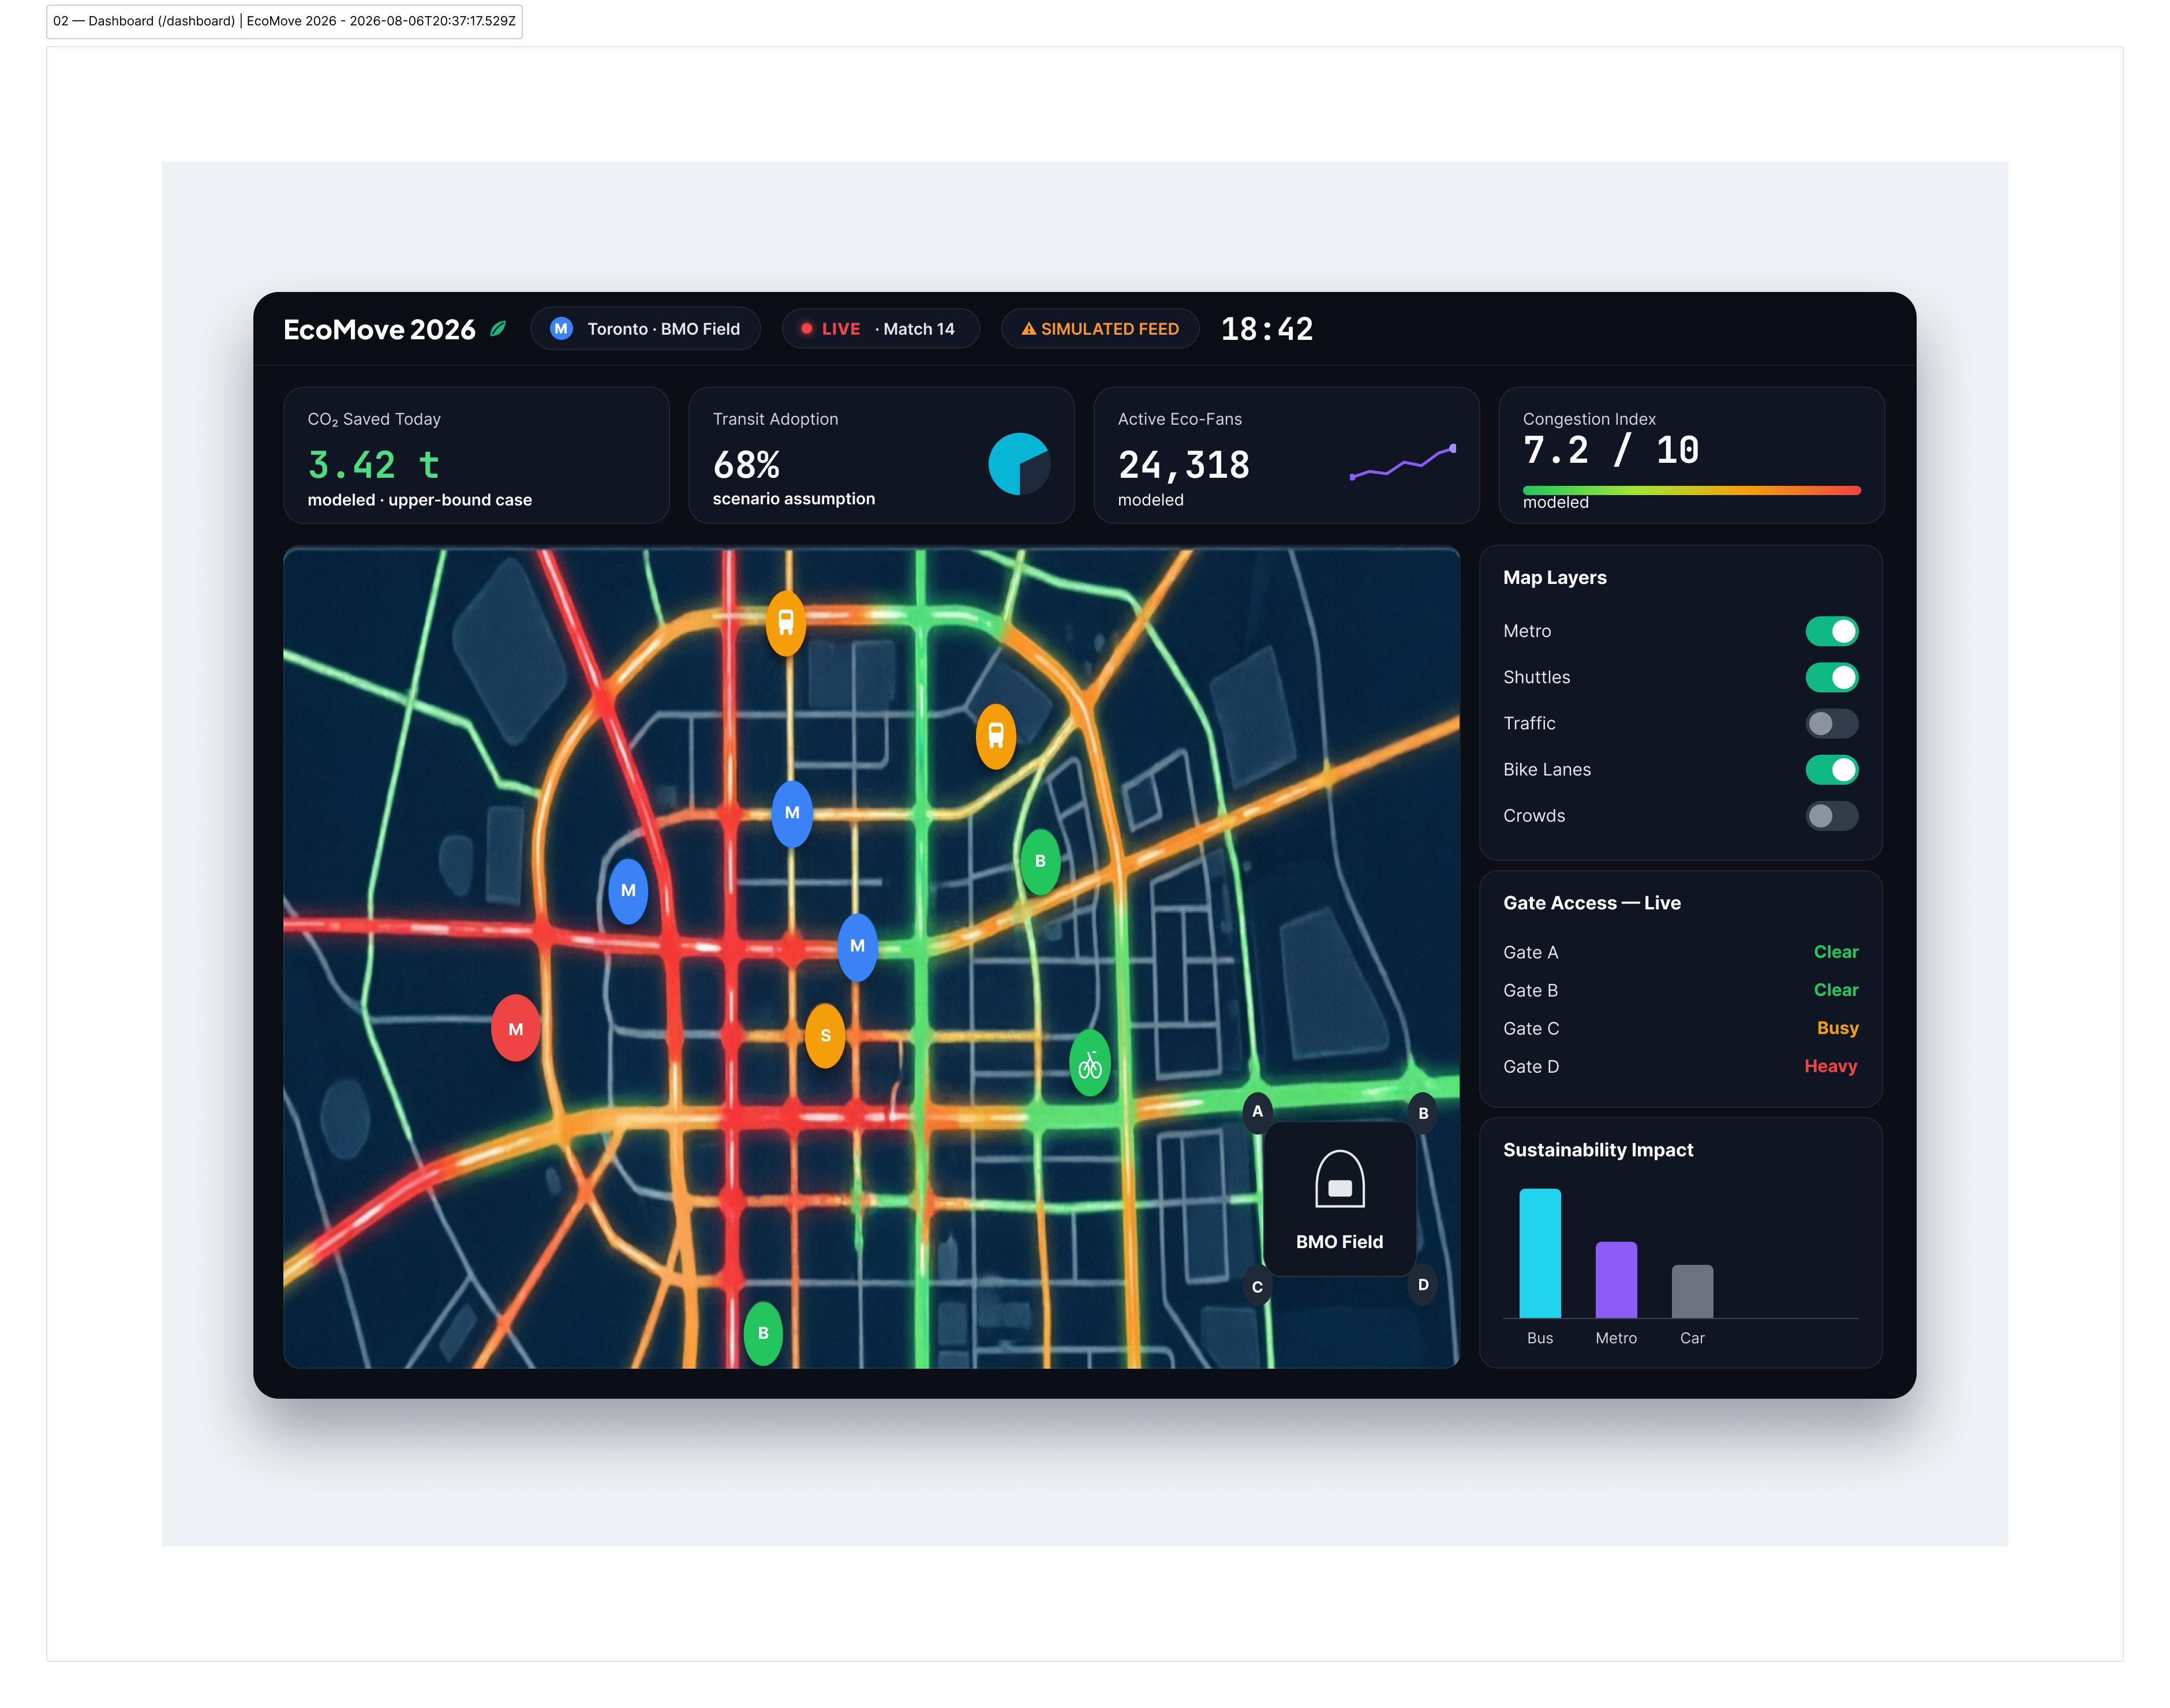
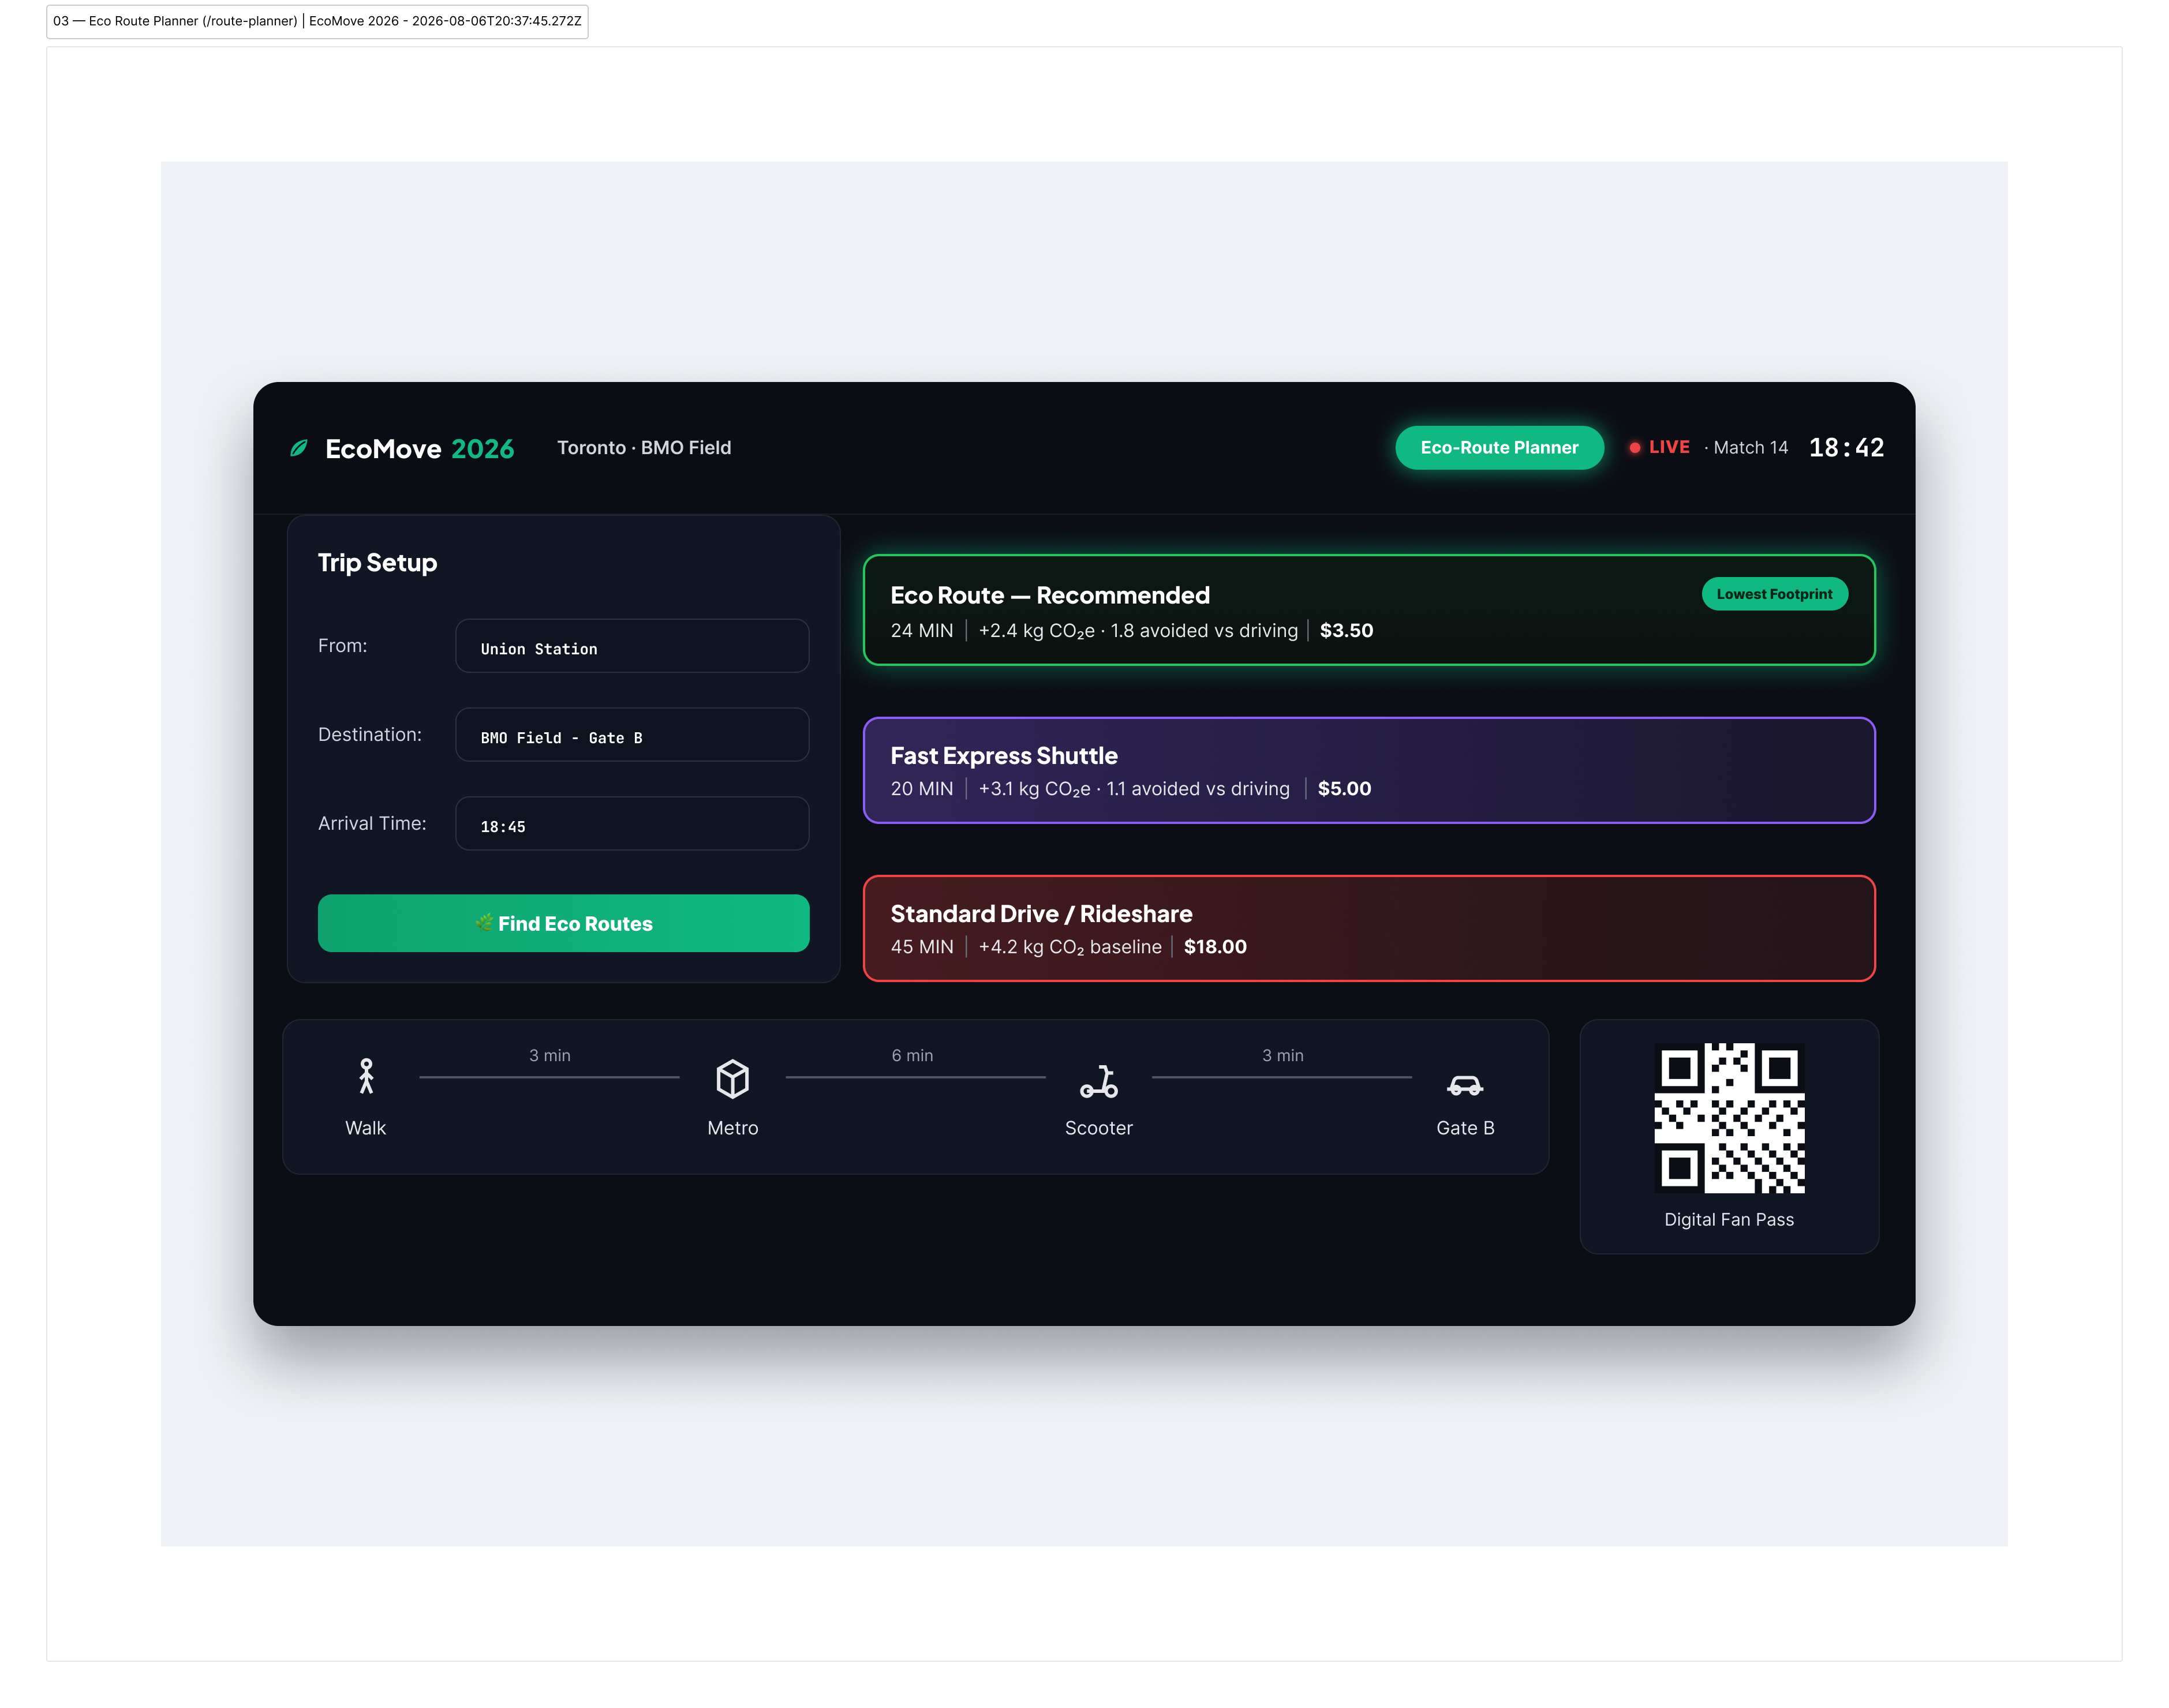
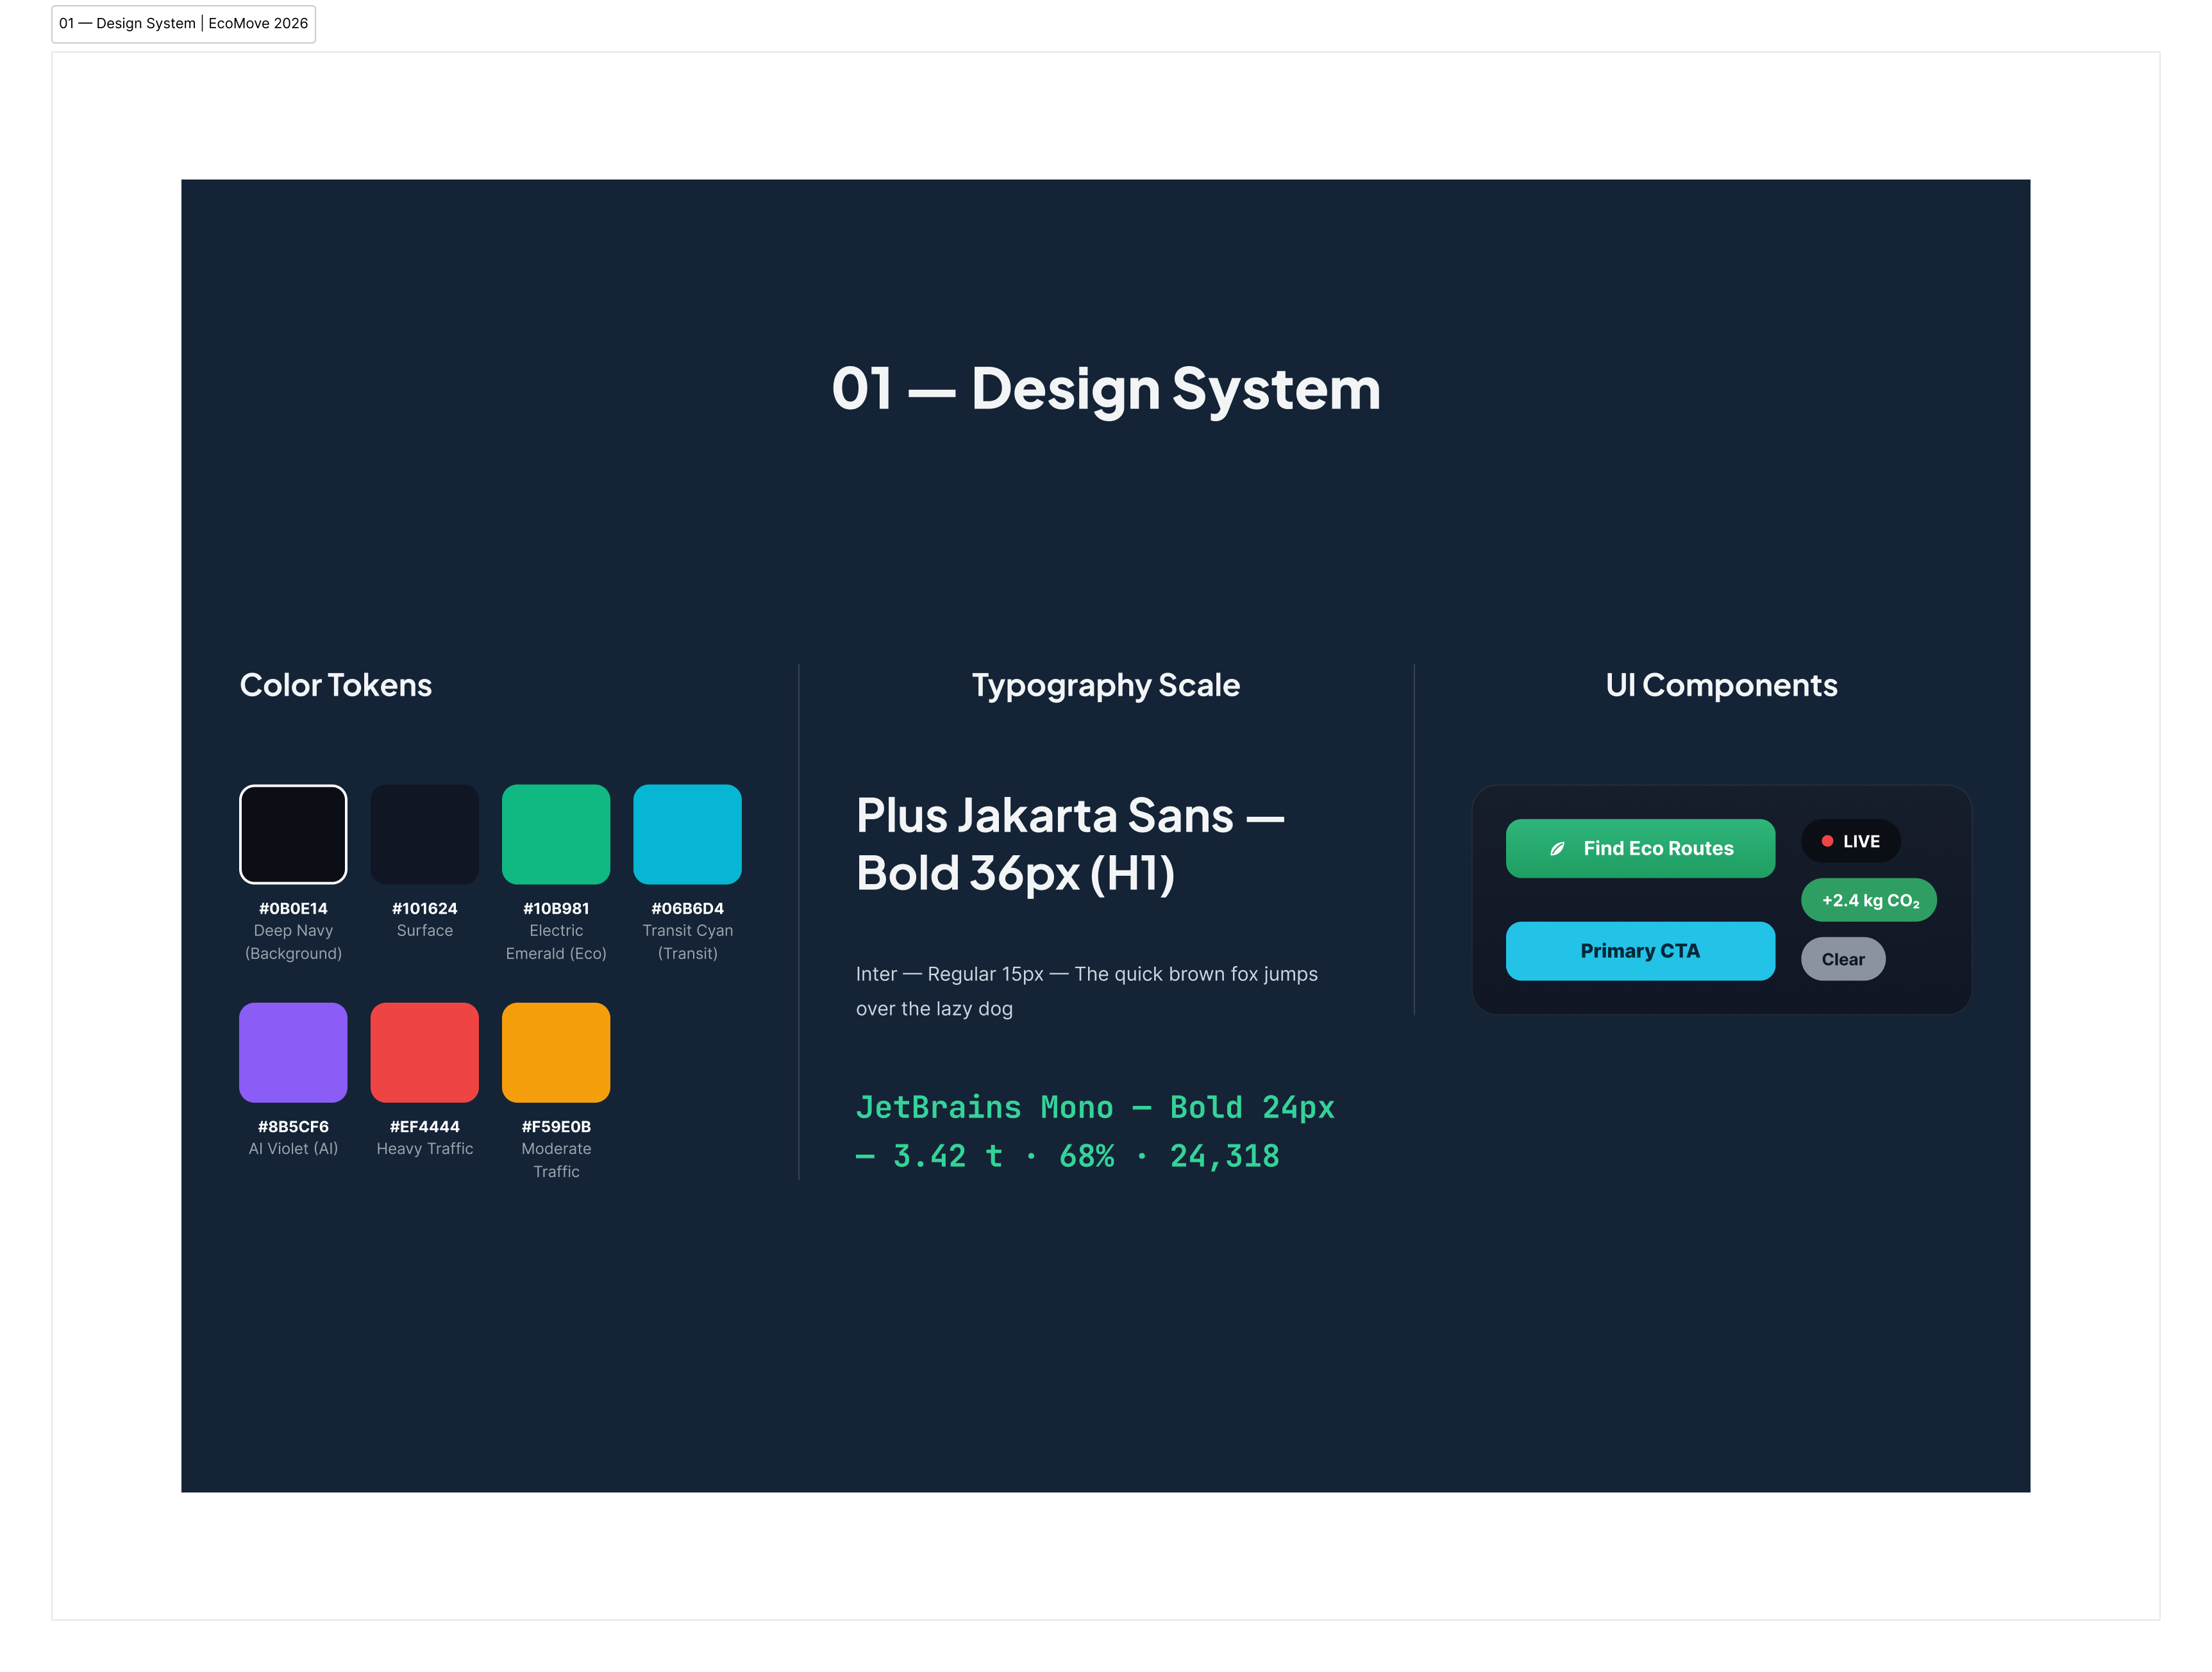
Inspiration This project was born at a hackathon, the Rice University Urban Sustainability Hackathon (World Cup 2026 HACK). The overall brief asked how cities hosting mega-events could optimize their sustainability, with the FIFA World Cup 2026 as the test case. There were several tracks, but the moment I read Track 1 Transportation & Access, I knew it was the one I'd pick. It asked for a mobility readiness platform for host cities: predict how visitors move, find the first/last-mile gaps, and recommend transit solutions that improve access, cut emissions and relieve traffic. Why did that excite me? A few honest reasons. First, the problem wasn't hypothetical, the World Cup is happening, on a known date, in real cities, and the brief even had a "lasting legacy" goal, meaning the work could outlive both the tournament and the hackathon weekend. I liked that. Second, it sat exactly at the intersection of the things I enjoy most: design, data visualization and sustainability. A dashboard that turns static transit data into something a city operator or a fan can actually act on is exactly the kind of thing I love making. And third, the first/last-mile problem felt personal. Anyone who has walked thirty minutes from a station because the "shuttle situation" was unclear knows precisely what that gap feels like. The brief framed it around U.S. host cities, but the underlying problem is the same across all 16 of them, so I chose Toronto and BMO Field as my case and followed one concrete scenario (Match 14) from the fan's first tap to the gate. Later I also ran the method against two U.S. venues, MetLife and Lumen Field, at a planning level, to make sure it actually transfers. EcoMove 2026 is my answer to Track 1. What it does Right now, it's two screens, plus a design system I built for myself along the way. The dashboard is the "city at a glance" view. At the top sit the four numbers I care about: CO₂ saved today (3.42 t, an upper-bound case), the share of fans using transit (68%, a scenario assumption), active eco-fans (24,318, modeled), and a congestion index (7.2/10). I gave each one its own little visual, a donut, a sparkline, a green-to-red bar, because a naked number on a dark background feels dead to me. And each one is labeled "modeled" right on the tile, because a number that pretends to be measured is worse than no number. Below that is the map with the glow effects. Every road is colored by its status, green if traffic is moving, red if it's not, and I added small text tags like "GARDINER EXPY · HEAVY" because I didn't want anyone squinting at colors and guessing. The little pins are transit (M), shuttle (S) and bike (B) spots, and once you pick a route, your last-mile legs show up as dashed lines that follow you all the way to your gate. The stadium sits in the corner with the current security wait for each gate, and those waits move as the match clock moves: statuses swing between CLEAR, MODERATE and HEAVY. And here's a decision I made early: the demo was not going to show a nice, quiet day. What would be the point of that? I set it at the peak arrival window, when everything is at its worst, all four gates read HEAVY, waits between 17 and 30 minutes, because honestly that's the exact moment people need help. When everything looks terrible, a map that just shrugs and says "yep, it's terrible" is useless. What's useful is comparing small differences: one gate moving a few minutes faster than the others, the Gardiner basically a parking lot, but the bike grid still moving, and the scooter leg saving you the worst part of the walk. Those small comparisons are the whole product, if anything. And on the side, there are toggles to switch map layers on and off (transit lines, shuttles, micro-mobility, fan zones, traffic heatmap), plus a little chart of how fans arrive: transit, shuttle, bike and scooter, walking, car. The route planner is where the fan actually decides. You enter where you're coming from (anywhere in the downtown core), where you need to be (BMO Field, Gate B) and when (18:45). It shows three honest options side by side, time, CO₂ and cost. The eco route comes in at 24 minutes and $3.50, avoiding 1.8 kg CO₂e versus driving. The shuttle is 4 minutes faster but costs about 43% more and avoids less. The car is 45 minutes, $18 and +4.2 kg. I didn't want it to feel preachy, so the car option isn't hidden, it's just shown with its real price for the planet and the wallet. Pick a route and it breaks into steps: transit 6 minutes to the nearest regional stop, walk 3, scooter 3 for the last mile, and you're at your gate. Those minutes are scenario parameters, not a timetable pull; I'd rather be honest about that than fake precision. Every fan also gets a Digital Fan Pass with a QR code, so tapping onto transit and entering the stadium is one motion. No paper tickets. Looking back, the two screens map almost directly onto what the hackathon asked for: the dashboard turns baseline data into action, and the planner attacks the first/last-mile gap head-on. And both screens read from the same match-clock state, so the fan and the operator are never looking at two different truths. How I built it UX/UI in Figma: designed from scratch as three frames, Dashboard, Route Planner and Design System, starting with a token-based system: 7 color tokens, a three-family type scale and reusable components. Development: translated the frames into dependency-free HTML/CSS, including a custom SVG traffic map with glowing congestion layers, using AI as a coding partner under my design direction. I wrote the specs, tokens and correction checklists, and every iteration had to match the design pixel-for-pixel. Published on GitHub Pages. The demo runs on a simulated data layer designed to behave like a real feed, and I documented the endpoints a real backend would replace. Challenges I ran into The biggest one was being solo with a real clock. Design and code usually take turns waiting for each other, and doing both at the same time means you're arguing with yourself in two directions at once. I had to cut scope hard: sixteen host cities became one city, one stadium, one match. And honestly, that made the project better. The map was the other big fight. My first version looked like a Christmas tree, every road glowing, every color screaming, nothing readable. I rewrote it a few times before I calmed the glow down, dimmed the base grid, and added plain text tags like "GARDINER EXPY · HEAVY." Turns out color alone doesn't carry information, and I didn't want anyone squinting and guessing. Then there was the data problem. There is no real live feed for a match that hasn't happened yet, so I had to simulate one. But simulated data is dangerously comfortable, it looks like whatever you feel like showing. I had to force it to behave like the real thing, including the ugly parts, like all four gates reading HEAVY at the same time during the peak arrival window. It was very tempting to demo a sunny day where everything works. I'm glad I didn't. And I kept the time model and the carbon model as two separate layers and said so on the page; merging them would have faked a precision I don't have. Accomplishments that I am proud of That I shipped a complete, coherent thing instead of a slide deck: a design system, two working screens, and a live prototype on GitHub Pages, built solo during the hackathon. That I demoed the worst case on purpose. Most demos pick the sunny path; EcoMove shows the peak arrival window with every gate at HEAVY, because that's the moment the product exists for. When the map is at its scariest and people still start comparing small differences, "oh, that gate is a bit faster," you can feel the design doing its job. That the route comparison stays honest. The car option sits right there with its real time, cost and emissions, not hidden to make the eco answer look easy. That was a deliberate bet: honesty is what makes people trust the numbers everywhere else in the app. And that I put the word "modeled" on every figure before anyone had to ask. I'd rather lose a little shine than lose the trust. What I learned A dashboard is not a wall of numbers; it's a place where decisions get made. The map only became useful, instead of just pretty, when it started showing small differences, one gate a couple of minutes faster, the bike grid still moving. Designing for the worst case changes what you build. A calm-day demo would have needed half the features; the peak window made every panel earn its place on the screen. A design system is not overhead, it's speed. By the second screen I wasn't choosing colors or type anymore, I was just assembling, and during a hackathon that's the difference between finishing and not. Art-directing the build down to the SVG map, writing the specs and correcting every iteration until it matched the design, taught me details a framework would have hidden from me. And I learned that inclusive, step-free routing should have been a baseline constraint from day one, not a future feature. That one's going straight into the next iteration. What's next for EcoMove 2026 First, real data: GTFS-Realtime and open city APIs, so the map shows what's actually happening. And a proper transferability pass across the U.S. host cities. I've started with planning-level checks for MetLife and Lumen Field, and I'd like to pilot with one of them. Second, prediction instead of reaction. I'd love a model that says, "Gate C will be a problem in half an hour," so operators can add shuttles before the crowd builds, not after. And the walk out: post-match egress is usually the harder half, and I didn't model it. That's next, together with accessibility-aware routing and non-scooter alternatives for people who can't or don't want to ride one. And third, because the brief asked for a lasting legacy, I want the same tools to keep working after 2026 for concerts, festivals and conferences, plus a phone version with the Fan Pass in your wallet and your personal CO₂ savings tracked. Maybe even a city-wide leaderboard, because people change behavior faster when it's a little bit of a game.
Built With
- css3
- data-visualization
- design-system
- figma
- github
- html5
- javascript
- sustainability
- svg
- ui-design
- user-experience
