🧠 Exploratory Data Analysis (EDA) – E-Commerce Sales Analysis
📋 Description
This project performs an Exploratory Data Analysis (EDA) on the Online Retail Dataset to understand its structure, discover patterns, detect anomalies, and extract insights.
The analysis includes:
- Data cleaning and preprocessing
- Statistical summary and visualization
- Key insights and observations
📂 Repository Structure
├── data/
│   ├── raw/
│   │   └── e-commerce_data.csv    # Original raw dataset
│   └── cleaned_data.csv           # Cleaned and processed dataset
│
├── notebooks/                      # Jupyter notebooks with analysis
│
├── results/                        # Output figures or reports
│
├── environment.yml                 # Conda environment file
│
└── README.md                       # Project documentation
⚙️ Installation & Setup
Option 1 — Using Conda
conda env create -f environment.yml
conda activate ecommerce-eda
🧾 Dataset Information
- Dataset Name: Online Retail
- Source: https://www.kaggle.com/datasets/carrie1/ecommerce-data
- Format: CSV
- Rows & Columns: 541909 rows and 8 columns
- Description: This dataset contains all the transactions ocurring between 01/12/2010 and 09/12/2011 for a UK-based and registered non-store online retail.
📊 Analysis Overview
- 1️⃣ Data Cleaning: Handling nulls, duplicates, and data types
- 2️⃣ Exploratory Data Analysis: Distributions, histograms, RFM segmentation and descriptive stats
- 3️⃣ Visualizations: Key plots and insights
- 5️⃣ Conclusions: Summary of findings and implications
🖼️ Example Visualization

🚀 How to Run
After activating the environment, launch Jupyter Notebook:
jupyter notebook notebooks/01_data_prep_cleaning.ipynb
Then open the notebook and run all cells in order.
Notebooks in /notebooks must be run in this order:
01_data_prep_cleaning.ipynb02_eda.ipynb
This project was developed using Visual Studio Code with a Jupyter Notebook.
📚 Tools & Libraries
- Python 3.11
- Pandas
- NumPy
- Matplotlib
- Seaborn
- Jupyter Notebook
🧩 Key Findings
💵 Sales Overview
- Sales have increased over time, with a significant rise in October 2011.
- The period from September to December has the highest revenue, while January, February and April have the lowest.
- Tuesday is the day with the lowest sales, whereas Wednesday has the highest.
- The United Kingdom is the country with the most sales, followed by the Netherlands, Ireland and Germany.
- The average sale on the lowest sales day, Tuesday, is $20 USD, while on the highest, Wednesday, it is $32 USD.
- The 13th day of the month has the lowest average sales ($24 USD), whereas the 14th has the highest average ($38 USD).
📦 Product Performance
- The Top 10 Best-Selling Products come from the following categories: Kitchen, Home Decor, Party Supplies and Bags. The best-selling product is a cake stand.
- The Top 10 Most Cancelled Products belong to the categories: Crafts & DIY, Kitchen, Home, Toys, Party Supplies. The most cancelled product is a paper craft.
- The following products appear in both the Top 10 Best Sellers and the Top 10 Most Cancelled: Regency Cakestand 3 Tier and White Hanging Heart Tlight Holder.
- The best sales month for each of the Top 10 Best-Selling Products is:
- Jumbo Bag Red Retrospot: November
- Party Bunting: May
- Rabbit Night Light: November
- Regency Cakestand 3 Tier: December
- White Hanging Heart Tlight Holder: January
- Assorted Colour Bird Ornament: August
- Chilli Lights: November
- Jumbo Bag Pink Polkadot: October
- Paper Chain Kit 50s Christmas: November
- Spotty Bunting: August
🧍♂️Customer Behavior & Segmentation
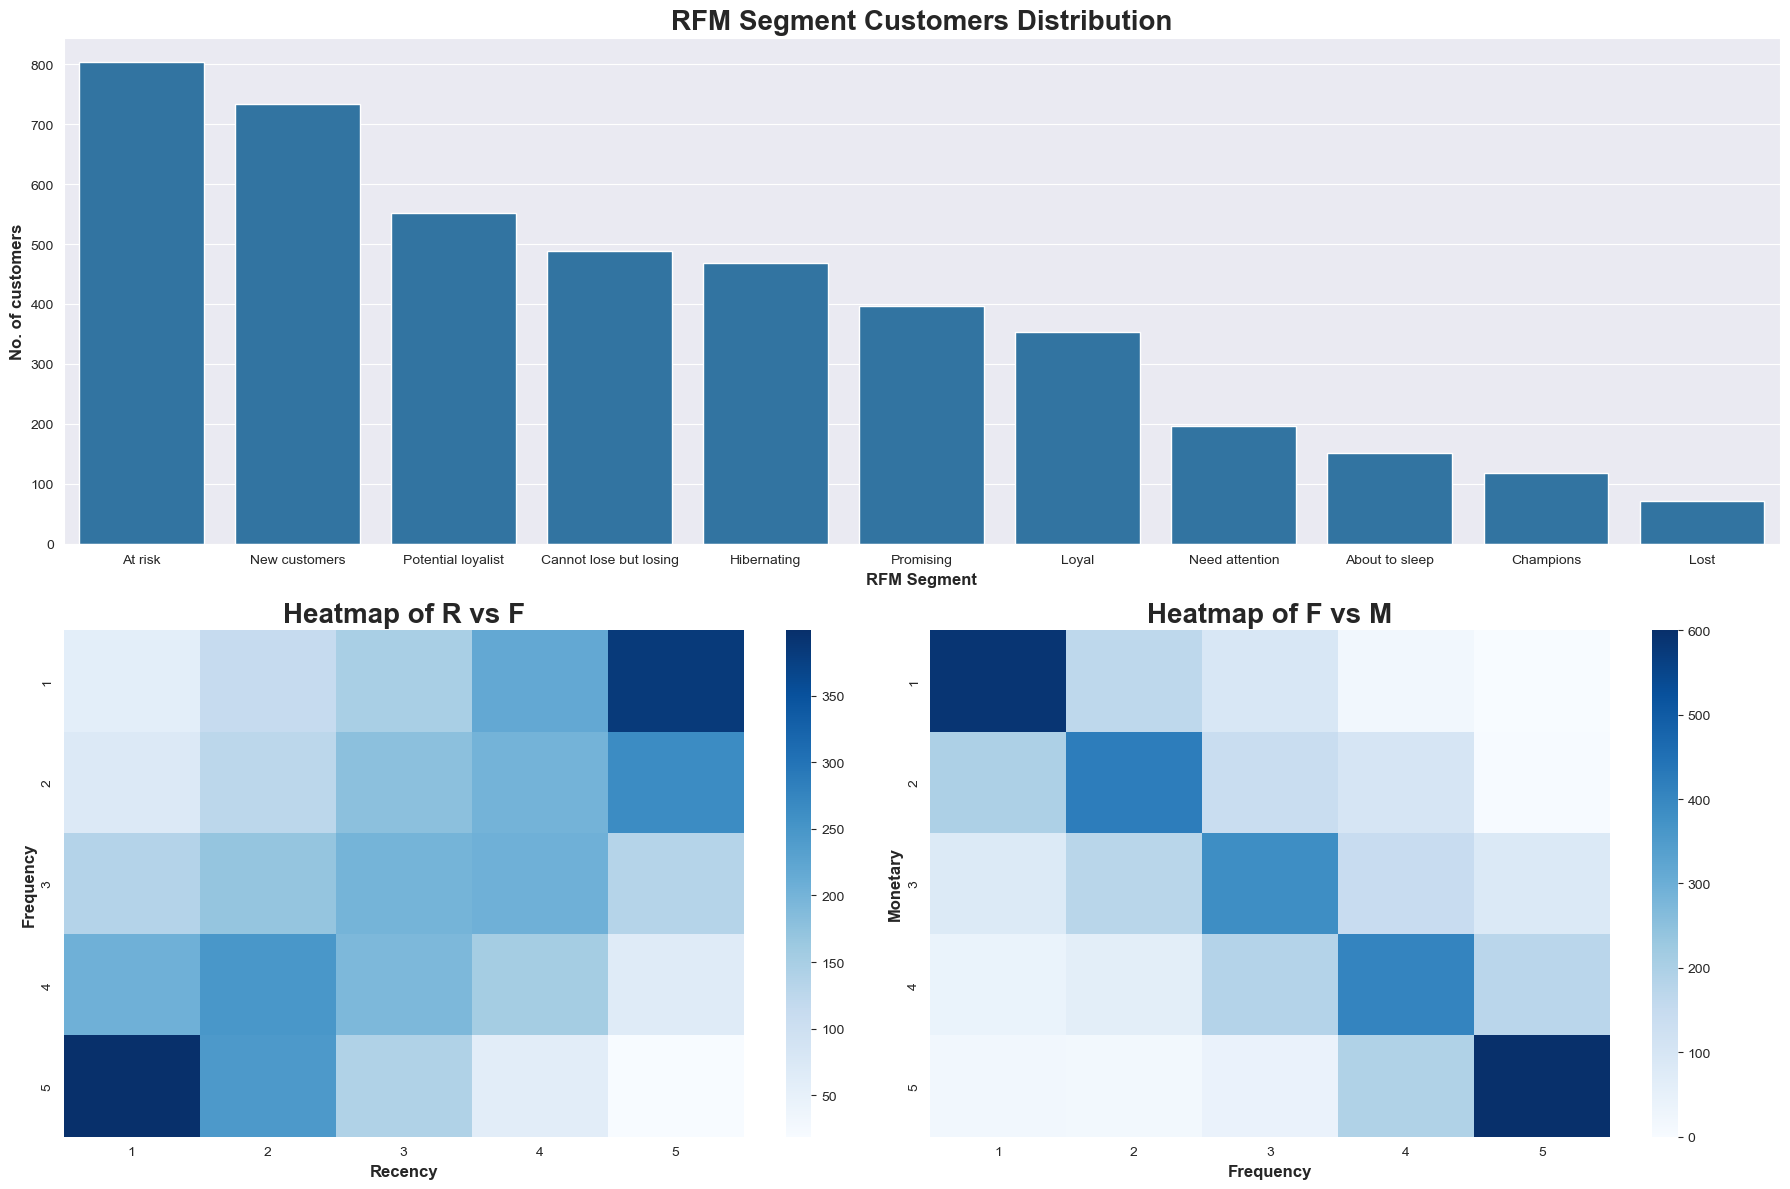
- From the RFM Segmentation:
- Most of the customers fall into the following segments: At risk, New customers and Potential loyalist.
- The least common segments are: About to sleep, Champions and Lost.
- Revenue per customer is highly right-skewed, with a median of approximately $1,053 USD.
- Although there are many new customers (according to the RFM Segmentation), the number of new customers per month has decreased over time.
- The returning customer rate (customers with more than one transaction) is 98%.
- The average time between orders is approximately 50 days, excluding same-day orders, which are the most common.
🛒 Purchase Patterns
- The basket size tipically ranges from 1 to 12 items.
- Most transactions have a basket value between $1 and $30 USD.
- Tuesday and Wednesday are the days with the highest number of transactions.
- The busiest time period is from 12:00 to 15:00.
⚙️ Operational Efficiency
- Cancellation rate is low, with a maximum of 2.0%, decreasing to 1.3% in November 2011.
- Most customers have a low cancellation rate, ranging from 0% to 20%.
👤 Author
- Name: Dylan Hernandez Rojas
- GitHub: https://github.com/dylanhrojas
- Email: dy_hr@outlook.com
🪪 License
This project is released under the MIT License.

Log in or sign up for Devpost to join the conversation.