Inspiration
Most sustainability apps are either hard to use or do not show real, measurable impact. We wanted to build a simple product that feels practical for everyday users, while still using a real cloud data platform for analytics.
What it does
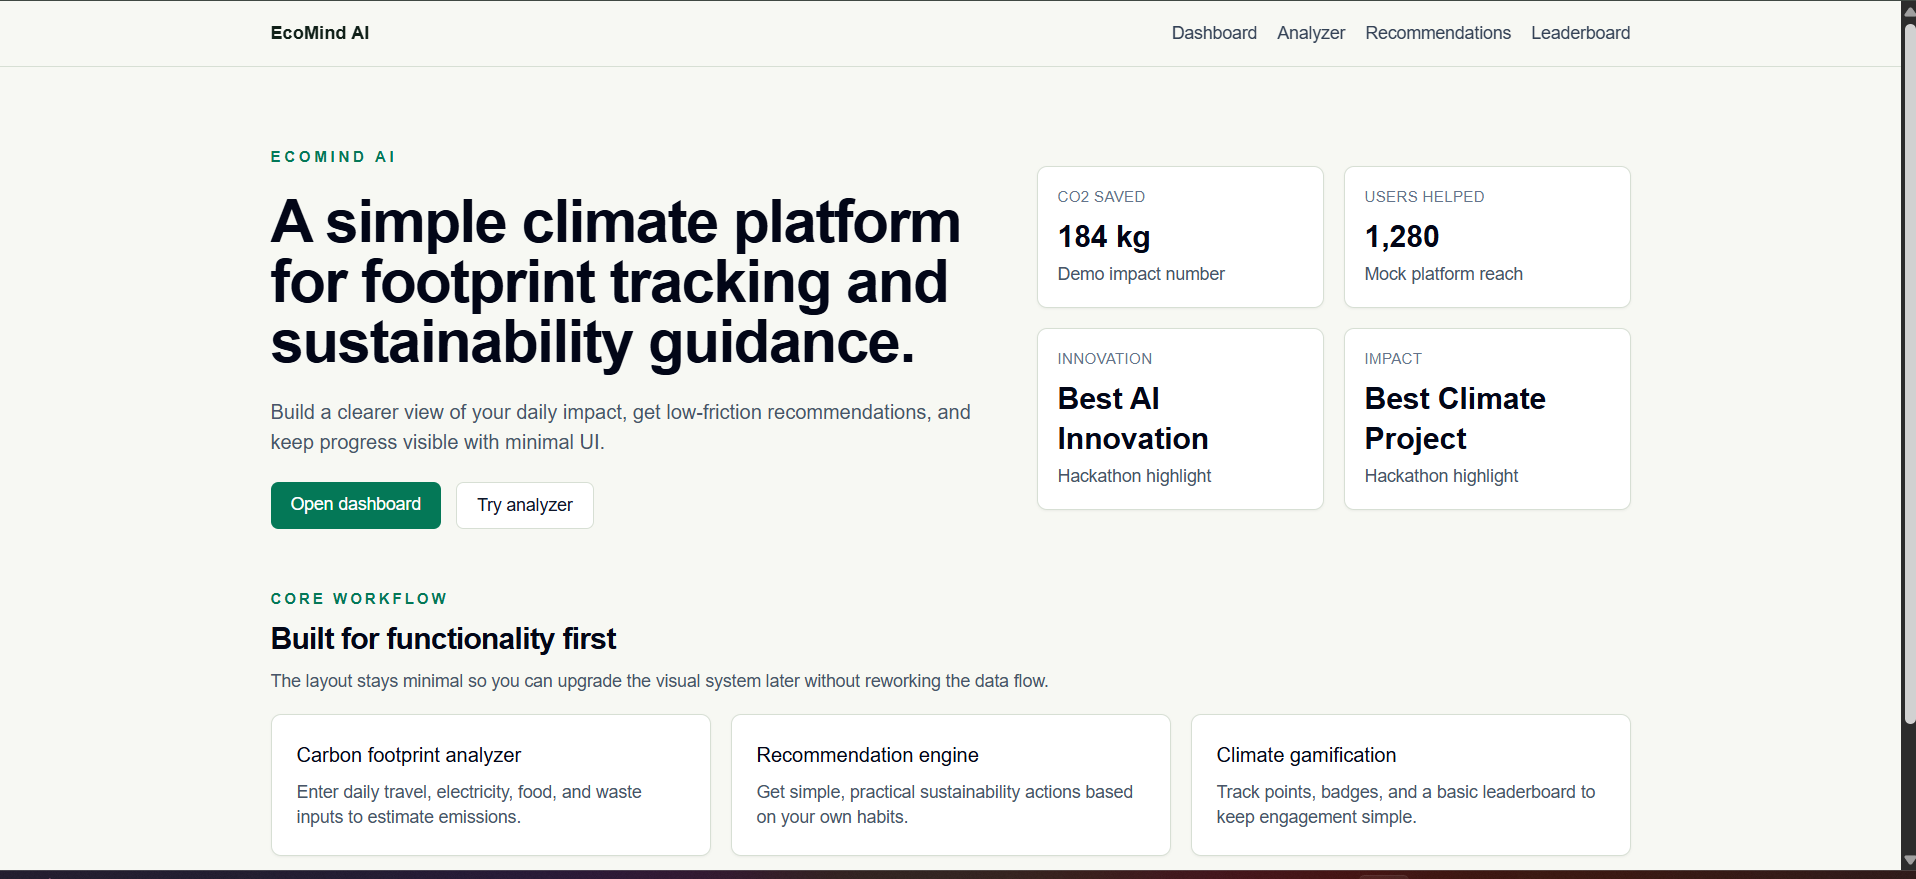
EcoMind AI helps users:
- Estimate carbon footprint from everyday habits (travel, electricity, food, waste)
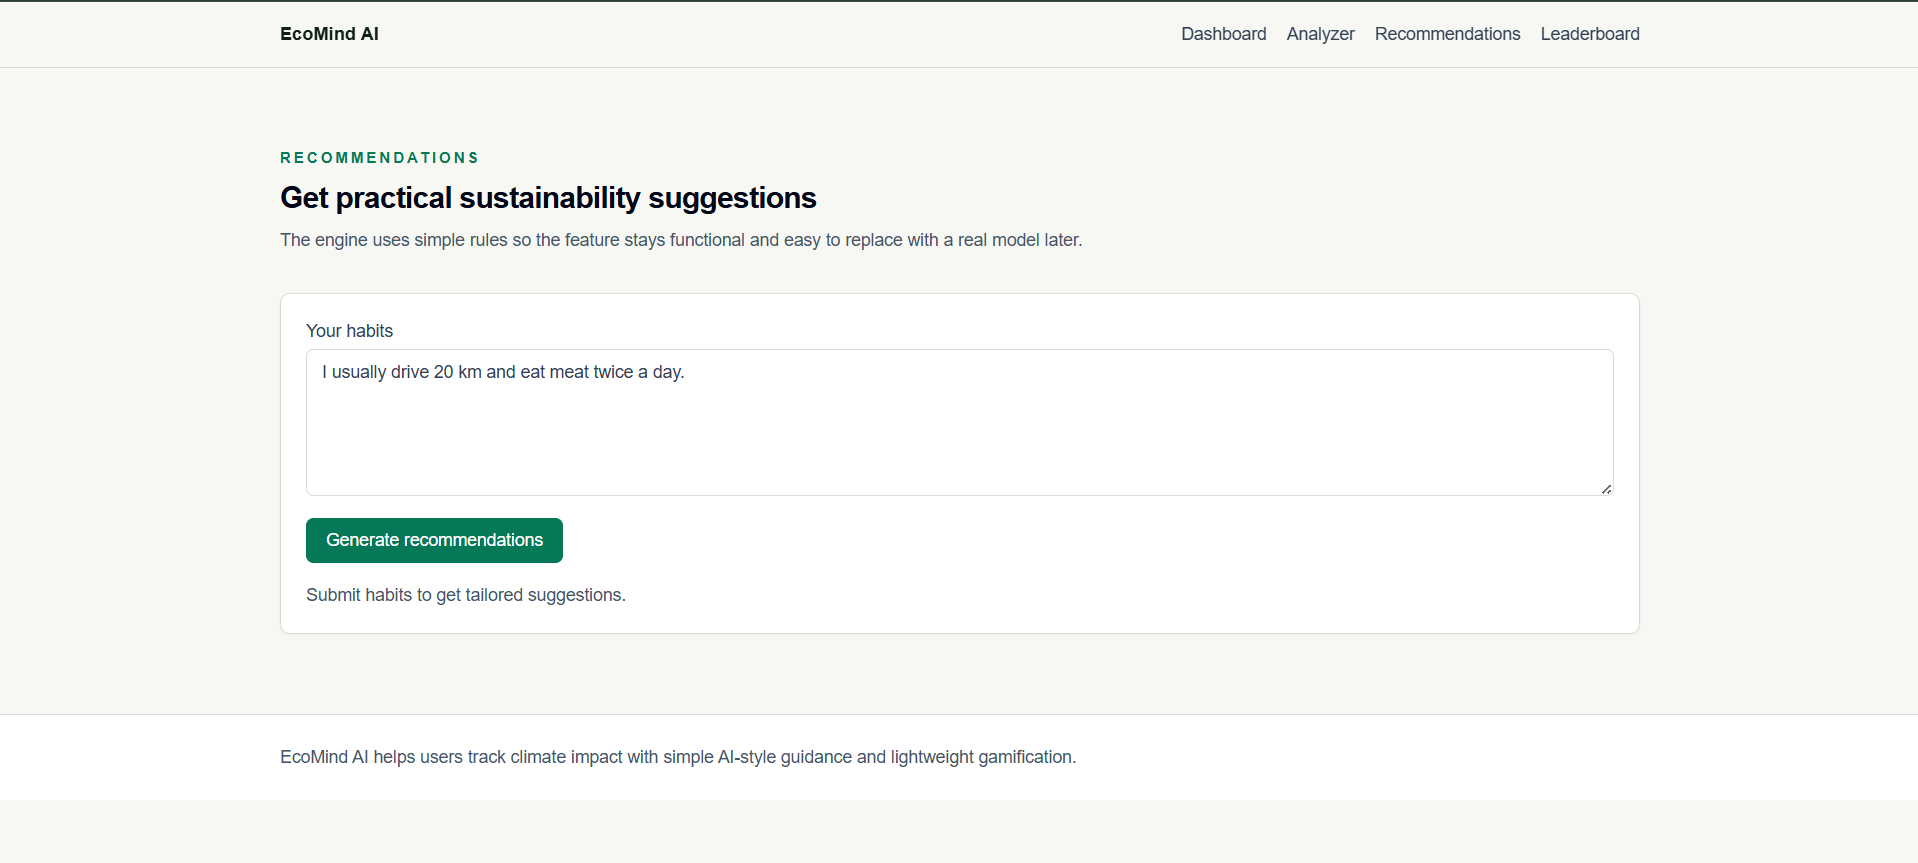
- Get personalized sustainability recommendations
- Classify waste with a simple upload flow (mock classifier)
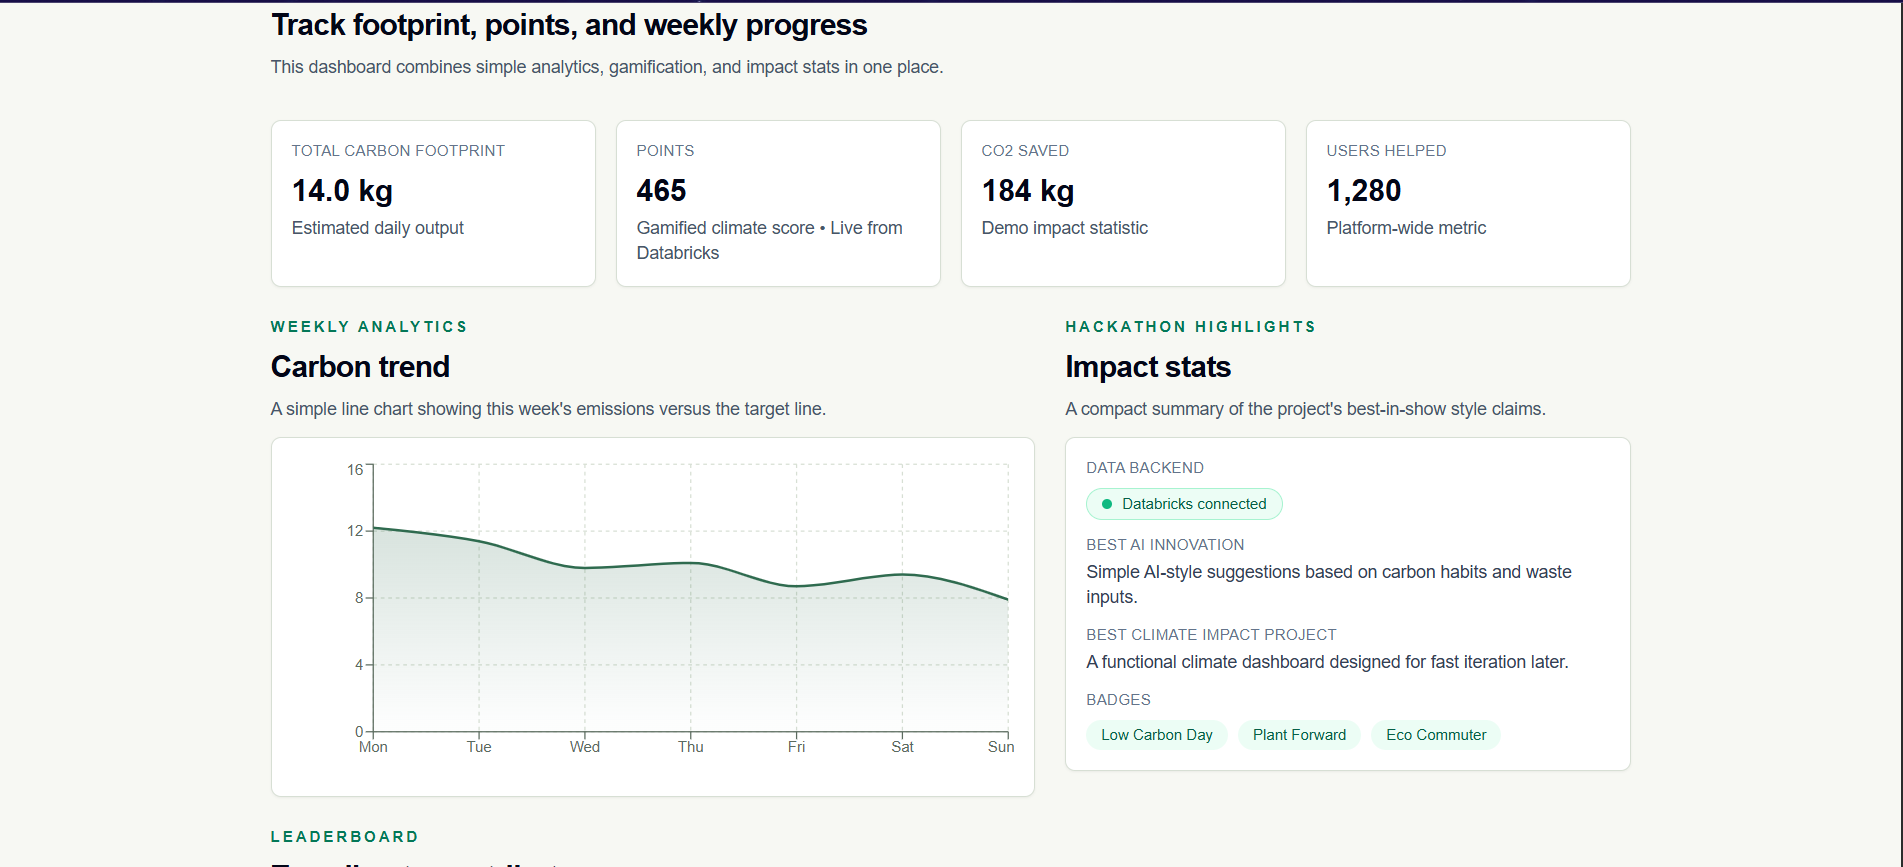
- Track impact through a climate dashboard with analytics
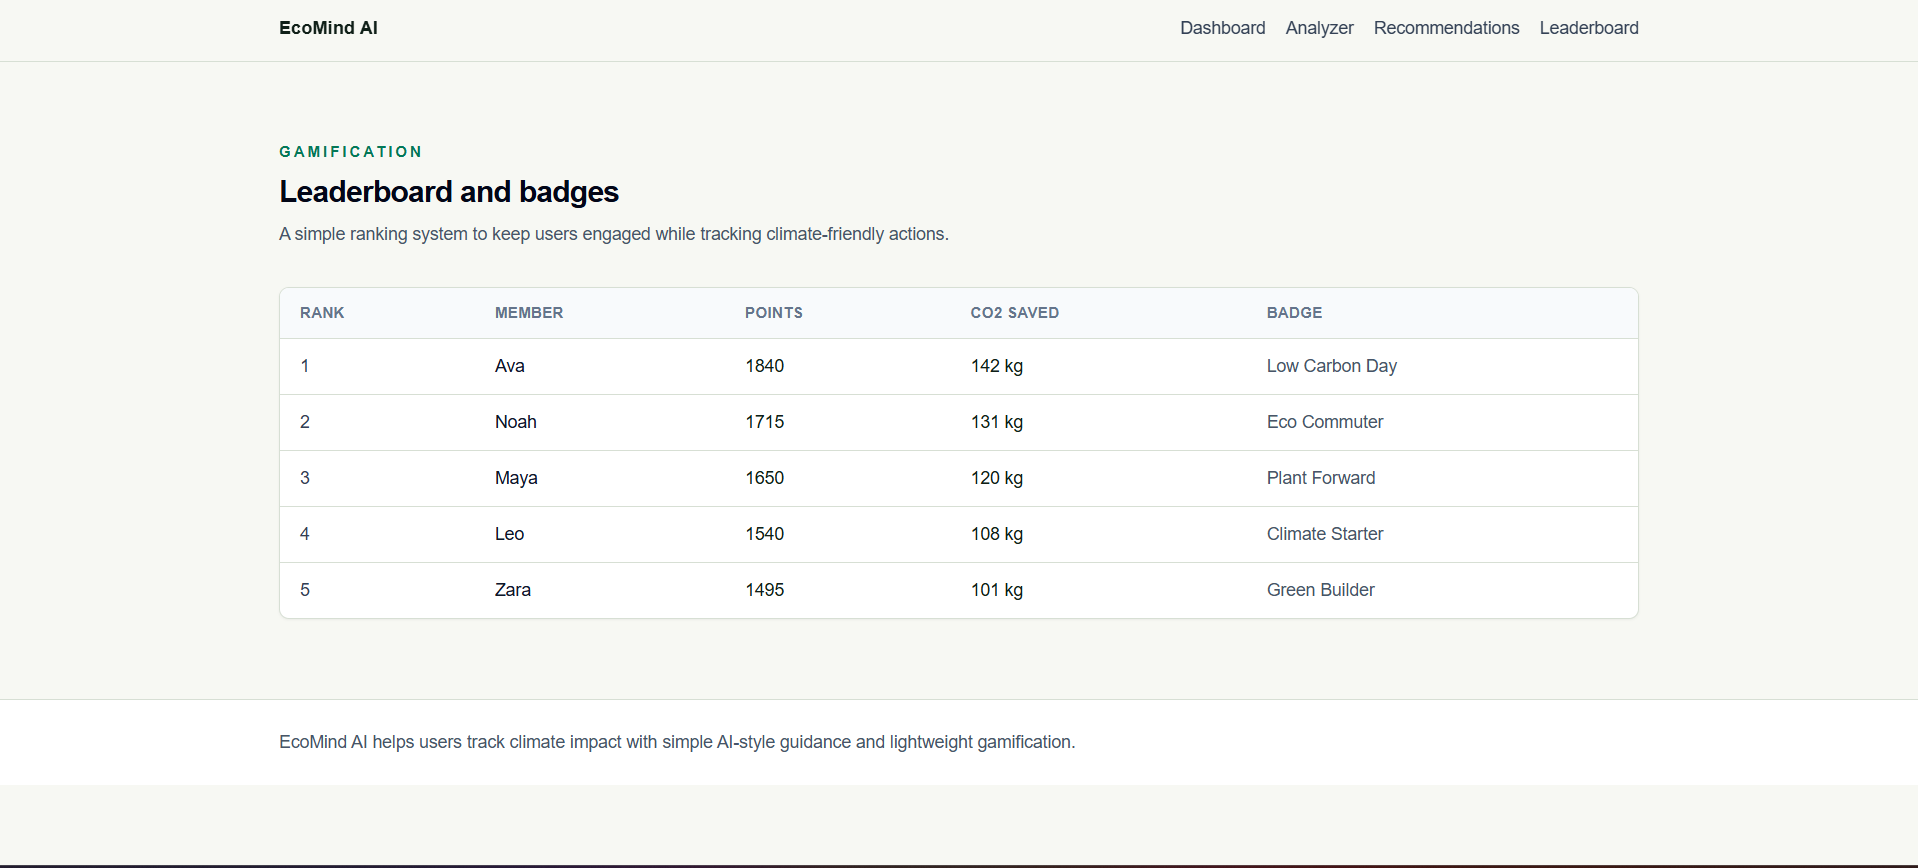
- Stay engaged using points, badges, and a leaderboard
Databricks-powered functionality in this version:
- Stores hackathon sample event data in a Databricks table
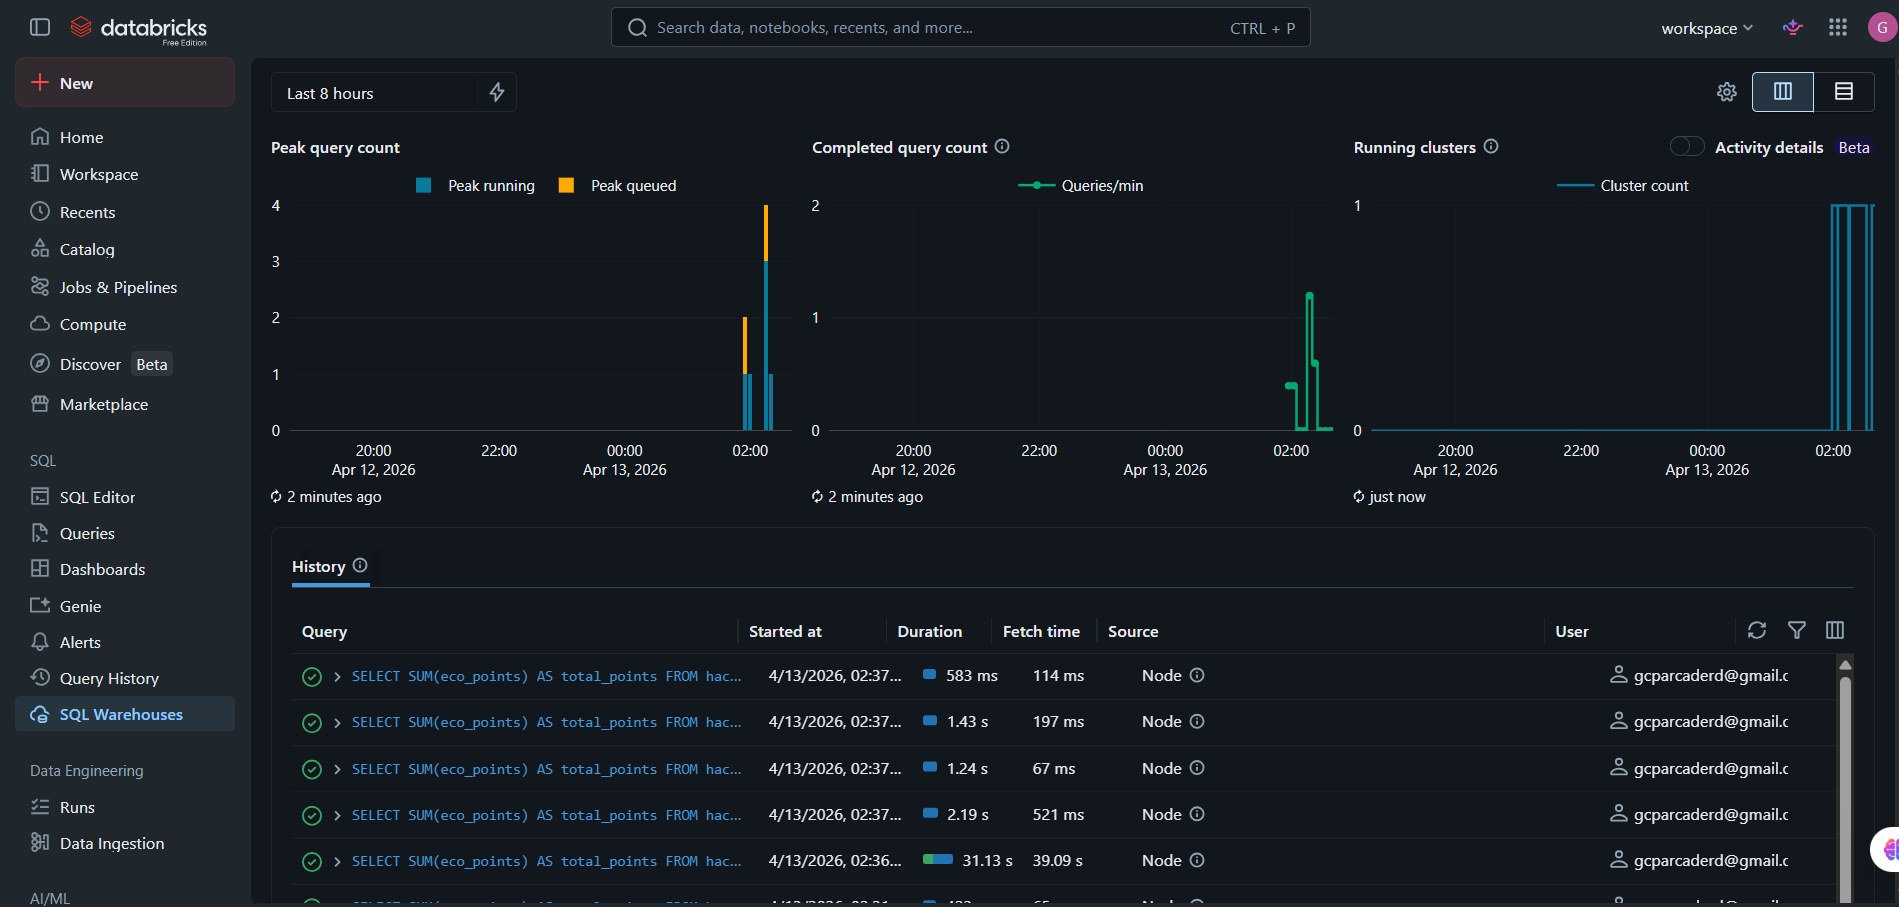
- Runs SQL aggregation on Databricks SQL Warehouse
- Fetches live total points through a server-side API route
- Displays live Databricks values directly in the dashboard with source labeling
How we built it
We built EcoMind AI using:
- Next.js (App Router) + TypeScript
- Tailwind CSS for a clean, minimal UI
- Framer Motion for lightweight transitions
- Recharts for simple analytics visualizations
- Databricks Free Edition (SQL Warehouse + SQL Statements API)
Architecture highlights:
- Modular reusable components
- Local logic for analysis and recommendations for fast prototyping
- Clear separation of concerns across app pages, components, and lib utilities
How Databricks is used end-to-end:
- We created a schema and table for eco events in Databricks
- We inserted sample user points rows for the demo
- We added a server route in the app to execute SQL via Databricks SQL Statements API
- The dashboard requests this route and updates the Points card with live Databricks totals
- We added a visual indicator in UI to show the data source is Databricks
Databricks-Specific Details
Where Databricks is used:
- Data storage:
hackathon.eco_eventstable in Databricks - Analytics: SQL aggregation (total eco points) executed on Databricks SQL Warehouse
- App integration: server-side Next.js API route calls Databricks SQL Statements API
- UI integration: dashboard Points card and status indicator show live Databricks-backed values
What worked great with Databricks:
- Fast setup on Free Edition for a hackathon timeline
- Simple SQL workflow for creating tables and running aggregations
- SQL Statements API made backend integration straightforward
- Good fit for showing real cloud-backed analytics instead of only static mock data
What was frustrating / challenging:
- Initial environment variable setup and token handling required careful backend-only configuration
- Minor trial-and-error around endpoint wiring and local dev verification
- Free-tier/runtime constraints mean we optimized for a small, focused live metric
Challenges we ran into
- Connecting Databricks securely from a Next.js app without exposing tokens on the client
- Managing environment variables correctly so local development and API routes could read credentials
- Handling package/runtime compatibility issues while keeping the dashboard stable
- Balancing fast hackathon delivery with clear architecture and clean code
Accomplishments that we're proud of
- Delivered a full end-to-end working product with multiple climate features
- Kept architecture scalable and clean for future upgrades
- Successfully integrated Databricks Free Edition into the live dashboard flow
- Added visible proof of live cloud data usage in the product UI
- Completed integration with minimal complexity suitable for rapid hackathon execution
What we learned
- Strong modular architecture speeds up feature delivery and debugging
- Simple rule-based AI logic can still provide clear user value in early versions
- Databricks SQL APIs are quick to integrate for real-time analytics use cases
- Secure server-side integration patterns are critical, even for demos
- Build and environment reliability are as important as feature implementation
What's next for EcoMind ai
- Expand Databricks usage from one live metric to full dashboard pipelines
- Add scheduled ETL jobs on Databricks for daily/weekly sustainability summaries
- Introduce user-level history tables and cohort analysis in Databricks
- Integrate Databricks notebooks and model serving for richer recommendations
- Add authenticated user accounts and long-term progress tracking
- Improve waste classification with a real computer vision model and feedback loop
- Launch team-based challenges and organization-level climate goals
External Frameworks, APIs, and Tools Used
- Databricks Free Edition
- Databricks SQL Warehouse
- Databricks SQL Statements API
- Next.js
- React
- TypeScript
- Tailwind CSS
- Recharts
- Framer Motion
- GitHub
- Netlify
Built With
- databricks
- javascript
- next
- typescript

Log in or sign up for Devpost to join the conversation.