-
-

The result of a search using EcoMaps
-

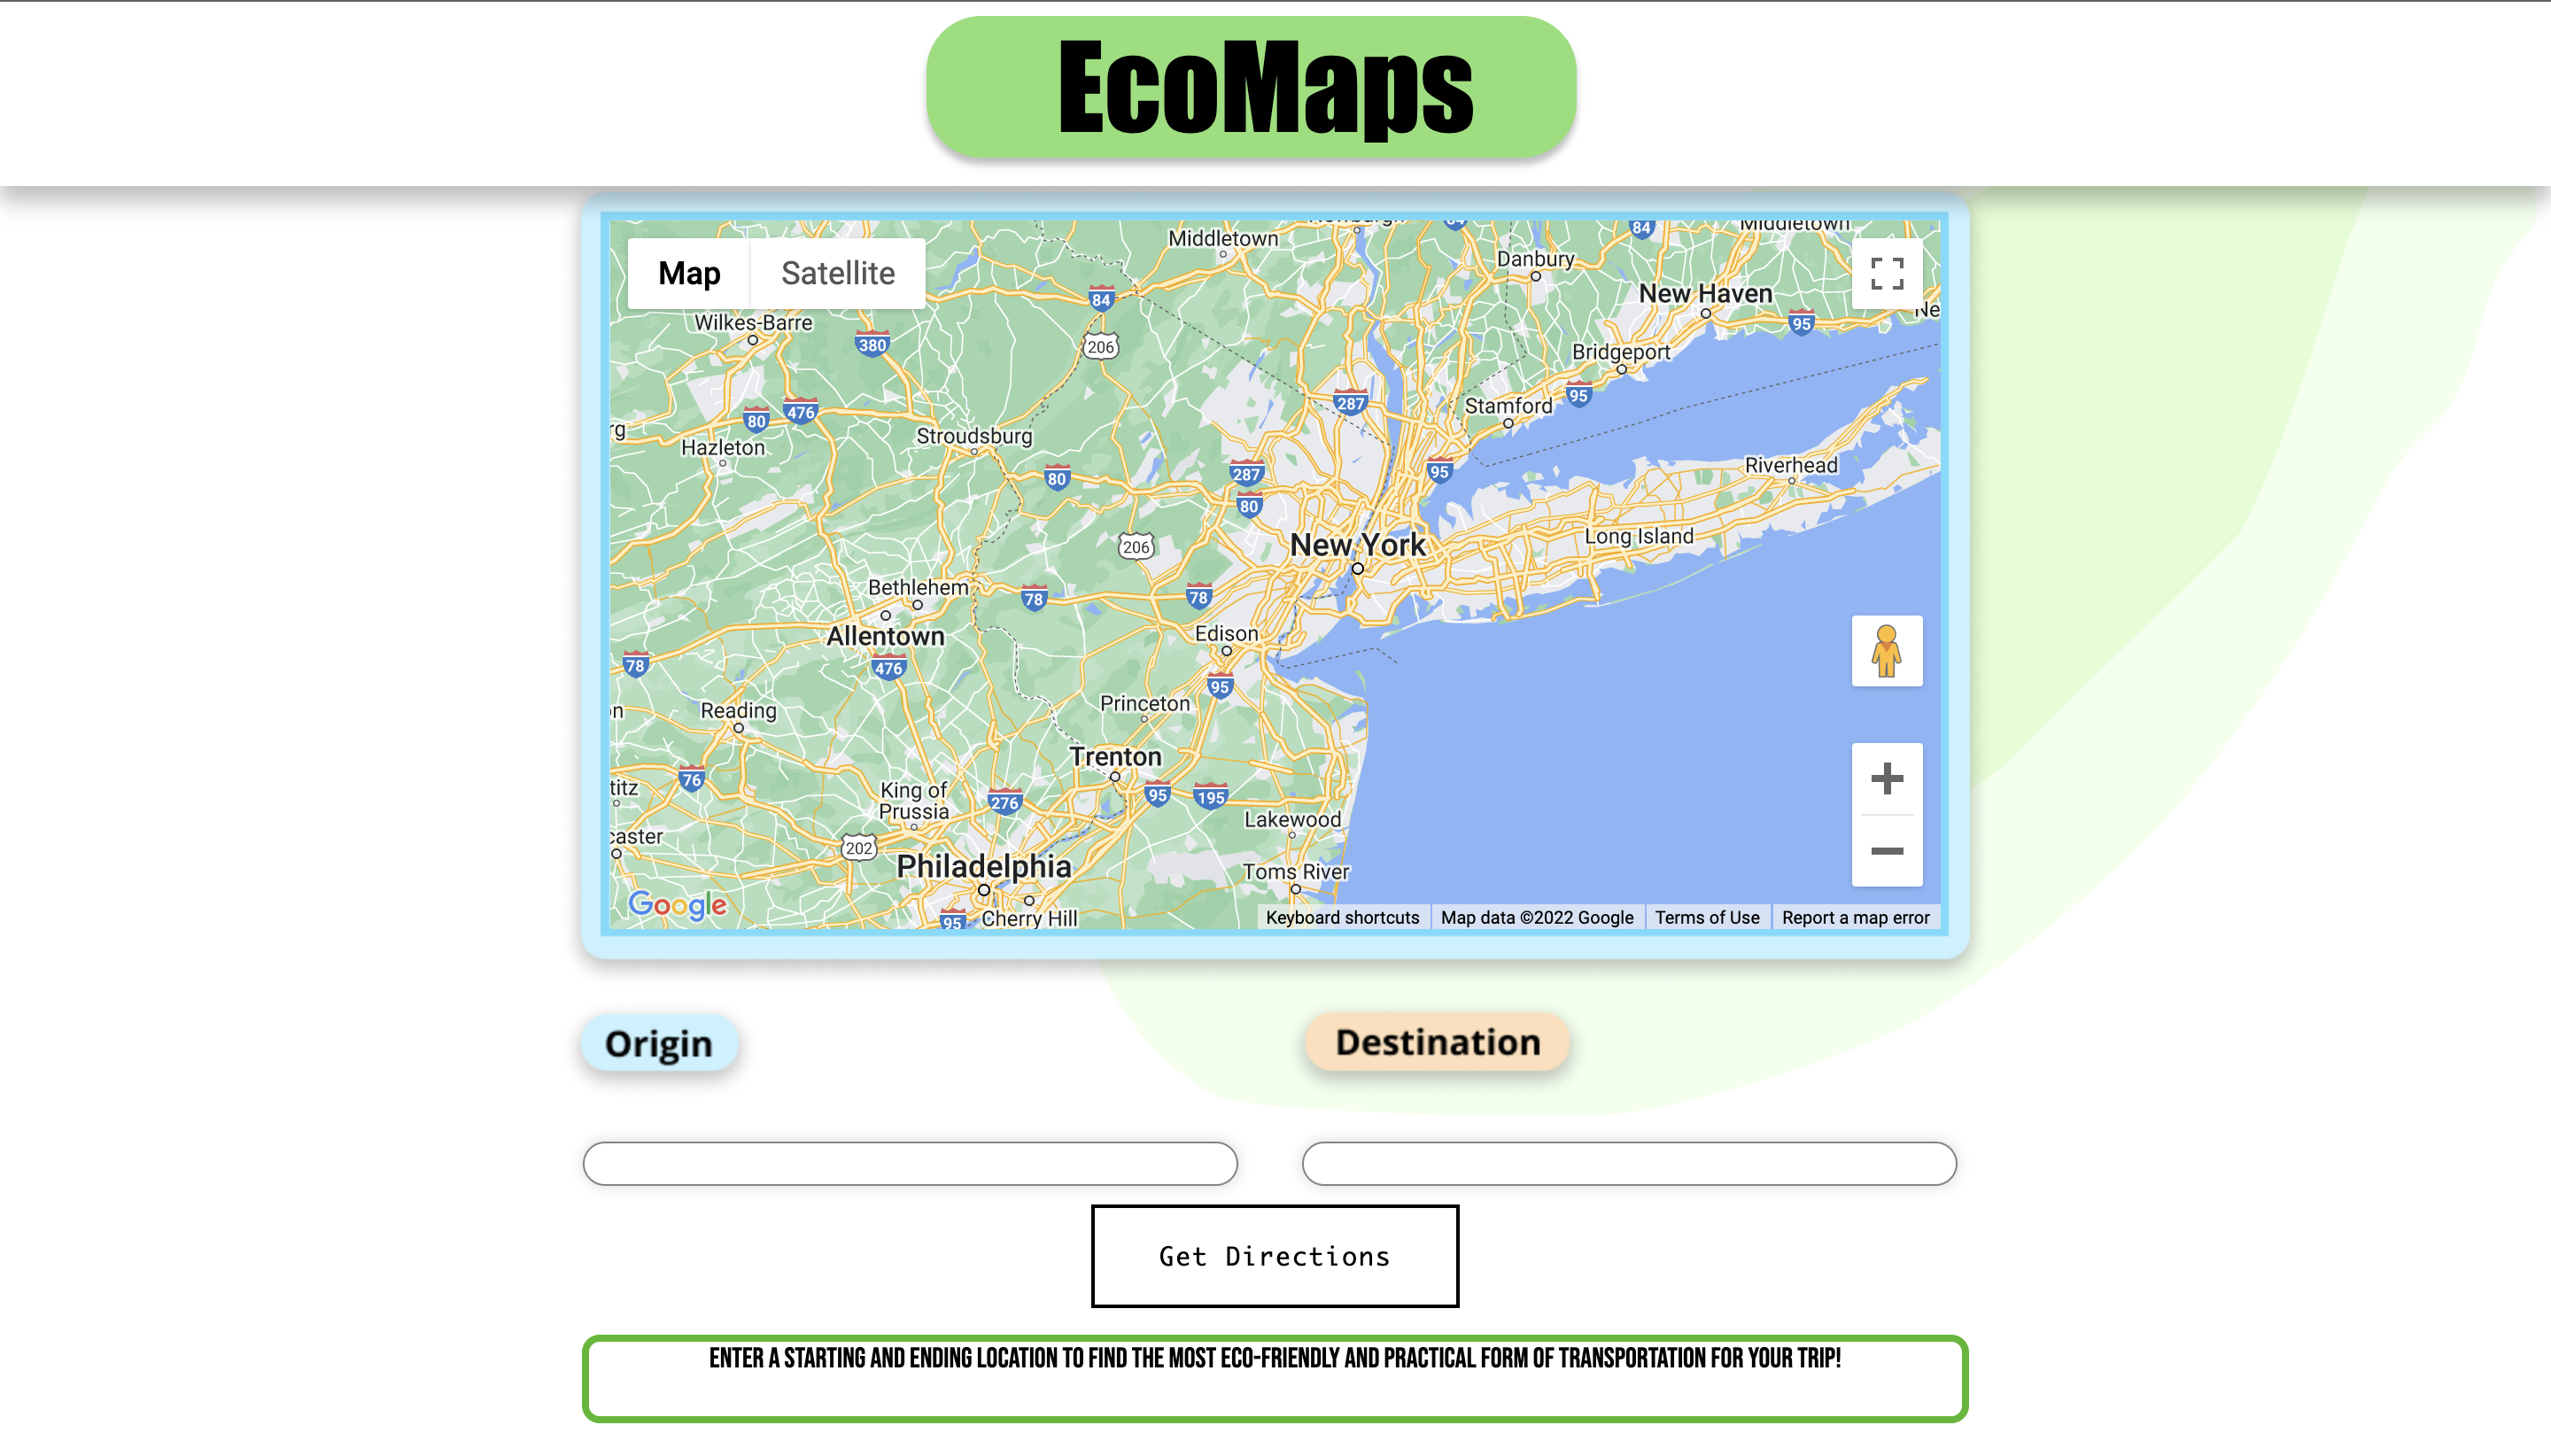
EcoMaps landing page

Inspiration
The other day when we were taking the train to get from New Jersey to New York City we started to talk about how much energy we are saving by taking the train rather than driving, and slowly we realized that a lot of people always default to driving as their only mode of transit. We realized that because of this there is a significant amount of CO2 emissions entering our atmosphere. We already have many map apps and websites out there, but none of them take eco-friendliness into account, EcoMaps on the other hand does.
What it does
EcoMaps allows users to input an origin and destination and then gives them the most eco-friendly way to get from their origin to destination. It uses Google Maps API in order to get the directions for the 4 different ways of travel (walking, biking, public transportation, and driving). From those 4 ways of travel it then chooses what would be the most convenient and most eco friendly way to get from point A to point B. Additionally it tells users how to get to their destination. If the best form of transportation is not driving, EcoMaps tells the user how much carbon emissions they are saving, but if driving is the best form of transportation it will tell them approximately how much carbon emissions they are putting out into our atmosphere. Our website also gives users a random fun fact about going green!
How we built it
We started this project by importing the Google Maps API into javascript and learning the basics of how the basics worked such as getting a map on screen and going to certain positions. After this, Dan was able to encode the API’s direction function by converting the text strings entered by users into latitude and longitude coordinates through a built-in function. Once the directions started working, Dan built another function which extracted the time it takes to go from one place to another based on all 4 of our different transportation options: walking, biking, driving, and using public transit. Dan then used all of the times and availability of certain methods to determine the optimal method which users should use to help reduce emissions. Obviously, walking or biking is always the optimal option for this, however, the algorithm took into account that many trips are far too long to walk or bike. In other words, it combines both logic and sustainability of our environment. While Dan worked on the backend Rumi created the user interface using Figma and then used HTML and CSS to create a website design based off of the Figma design. Once this was all done, Dan worked on ensuring that the integration of his code and Rumi’s front end display integrated properly.
Challenges we ran into
One problem we ran into during our project was the fact that Javascript is a single-threaded language. This means that it can only process one thing at a time, which especially came into play when getting data on 4 different trips varying by travel method. This caused the problem of the code skipping certain functions as opposed to waiting and then proceeding. In order to solve this, we learned about the asynchronous option which Javascript allows for in order to await for certain functions to finish before progressing forward in the code. This process of learning included both a quick Stack Overflow question as well as some quick google scans.
Another problem that we faced was dealing with different screen sizes for our website. Throughout our testing, we were solely using devices of the same monitor size, so once we switched to testing on a larger screen all of the proportions were off. At first, we were very confused as to why this was the case, but we soon realized that it was due to our CSS being specific to only our initial screen size. We then had to go through all of our HTML and CSS and adjust the properties so that it was based on percentages of whichever screen size the user had. Although it was a painstaking process, it was worth it in our end product!
Accomplishments that we're proud of
We are proud of coming up with a website that gives users the most eco-friendly way to travel. This will push individuals to be more conscious of their travel and what form of transportation they end up taking. This is also our second ever hackathon and we are happily surprised by the fact that we were able to make a functioning product in such a short time. EcoMaps also functions in real time meaning that it updates according to variables such as traffic, stations closing, and transit lines closing. This makes EcoMaps more useful in the real world as we all function in real time as well.
What we learned
Throughout the creation of EcoMaps we learned a host of new skills and information. We learned just how much traveling via car actually pollutes the environment around us, and just how convenient other forms of transportation can be. On the more technical side, we learned how to use Figma to create a website design and then how to create a website with HTML, CSS, and JavaScript based on this framework. We also learned how to implement Google Maps API in our software, and just how useful it can be. Most importantly we learned how to effectively combine our expertise in frontend and backend to create our now functional website, EcoMaps!
What's next for EcoMaps
In the future we hope to make the app take weather into account and how that may impact the different travel options that are available. Turning EcoMaps into an app that is supported by mobile devices is a major future goal of ours, as most people primarily use their phones to navigate.


Log in or sign up for Devpost to join the conversation.