-
-

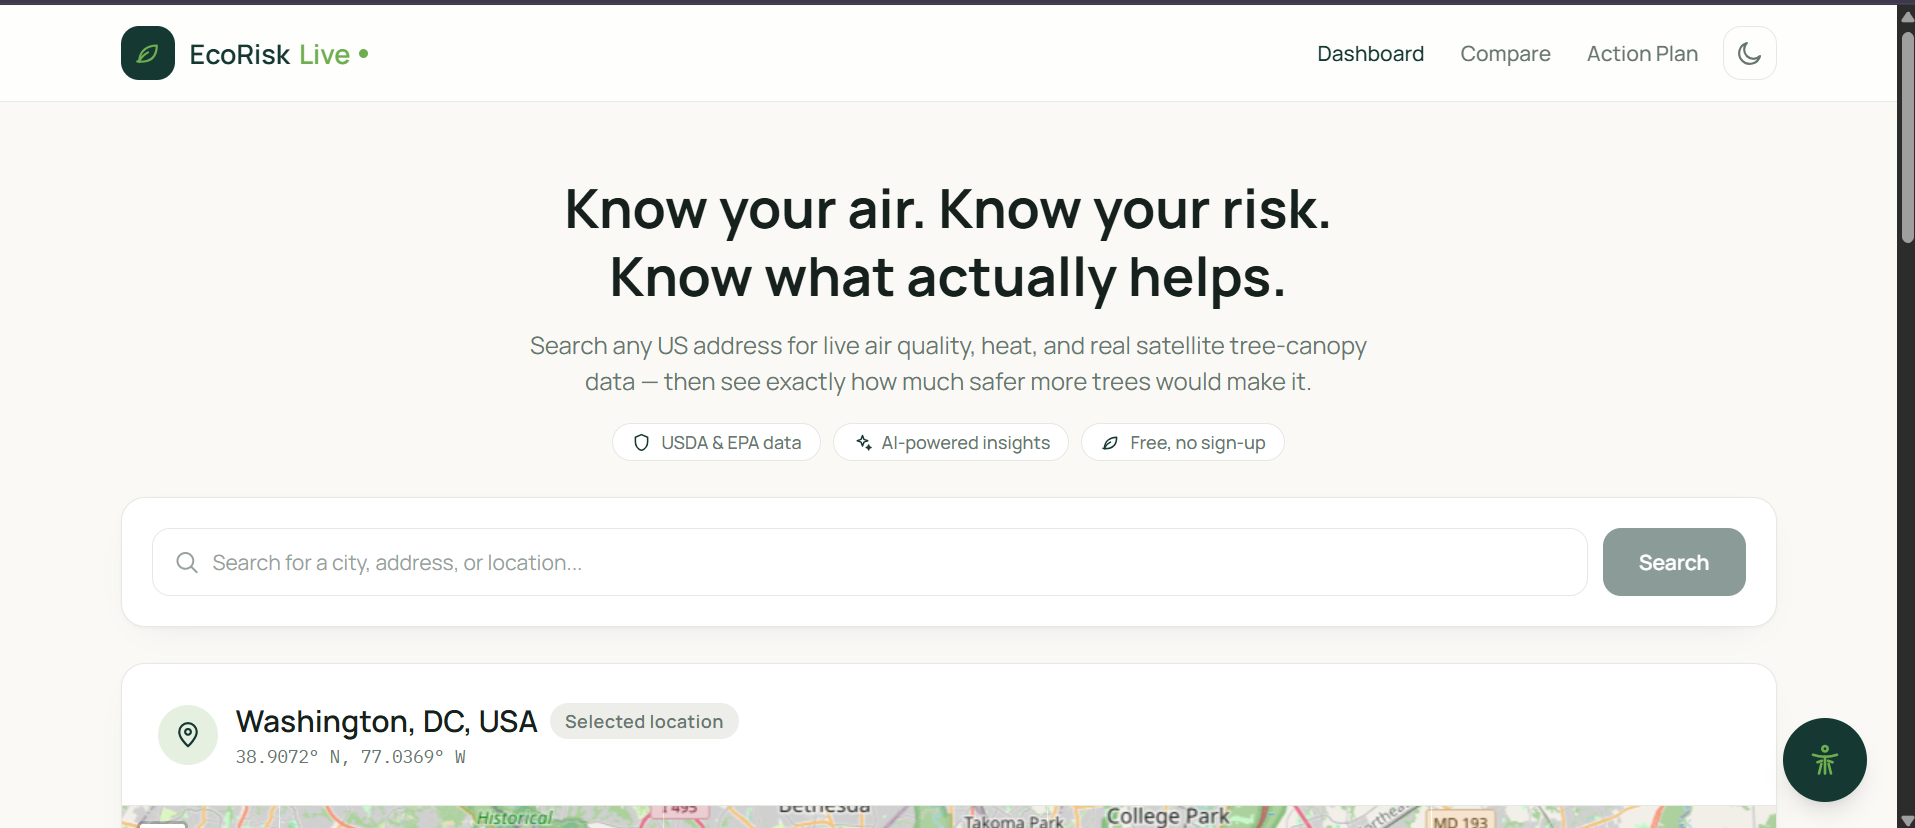
This is the EcoRisk live logo
-
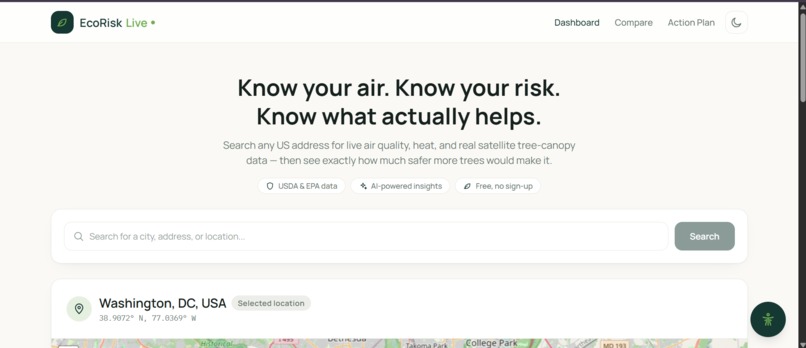
This is the dashboard + location search
-
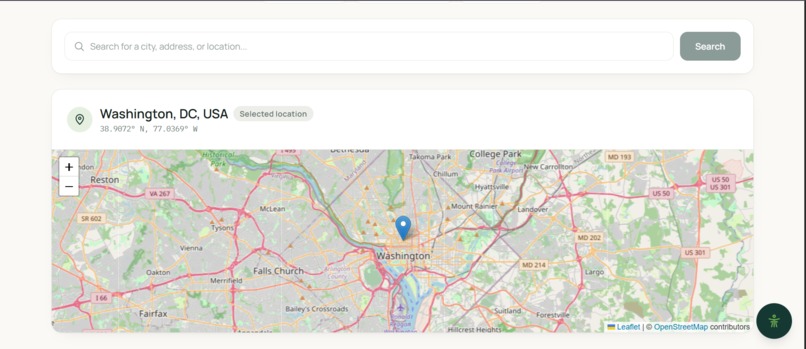
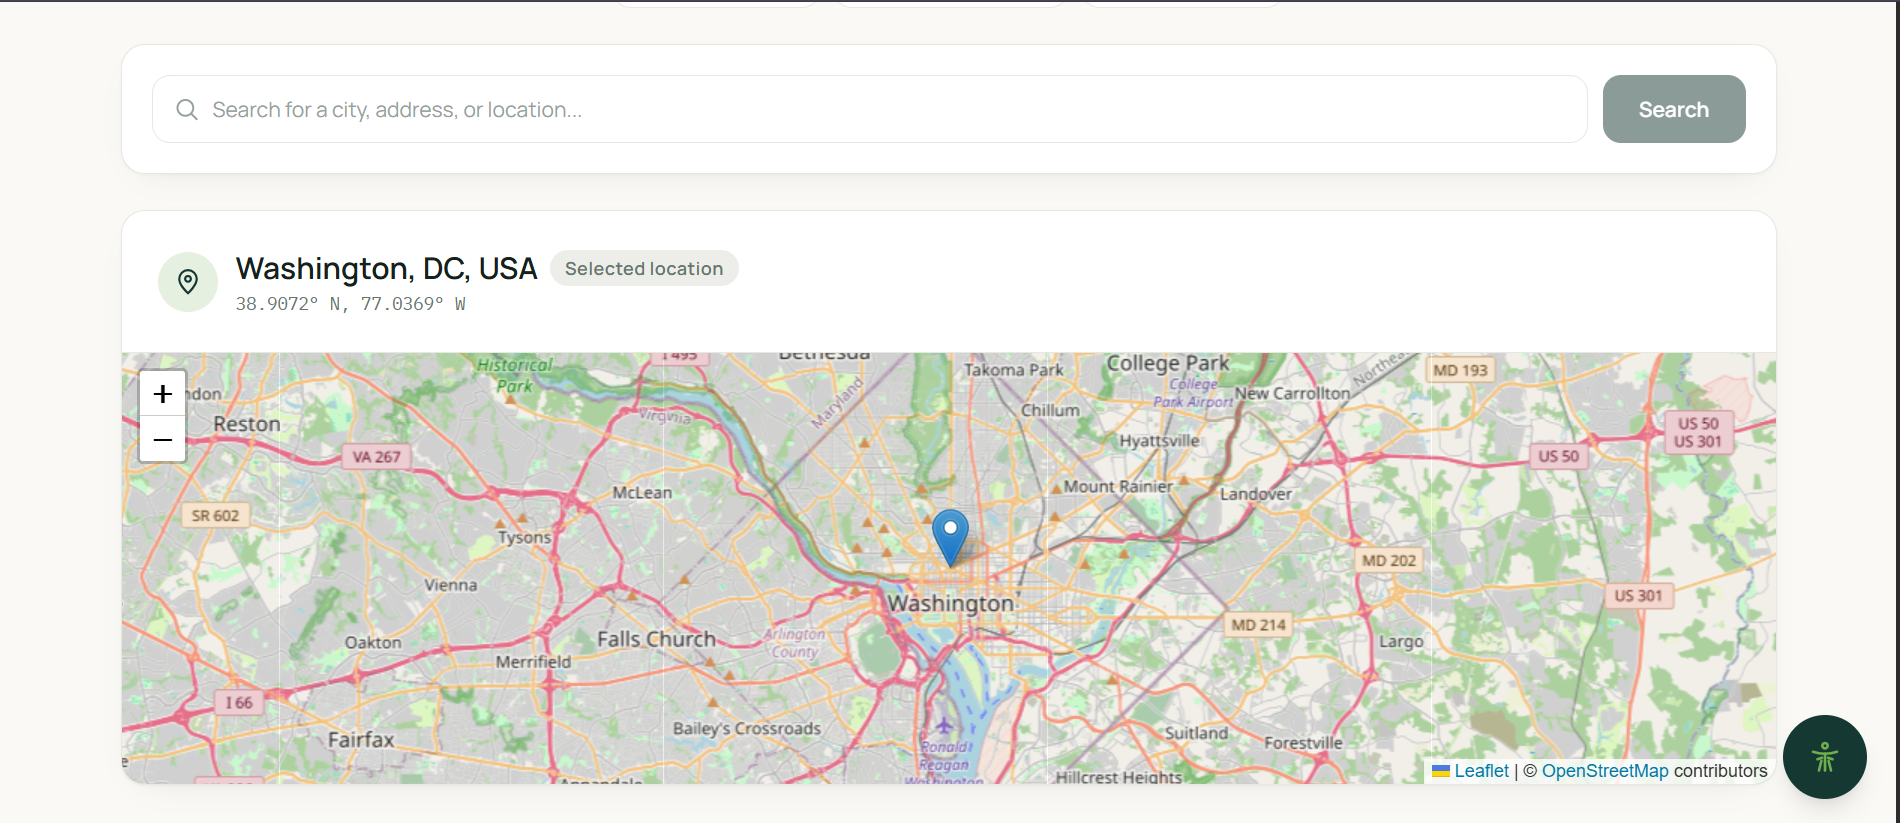
this is the map
-
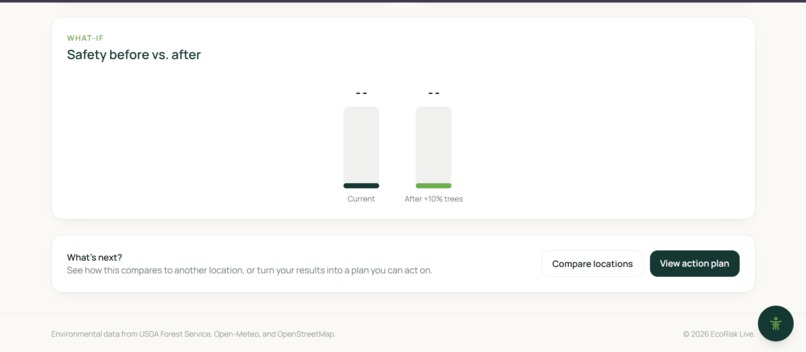
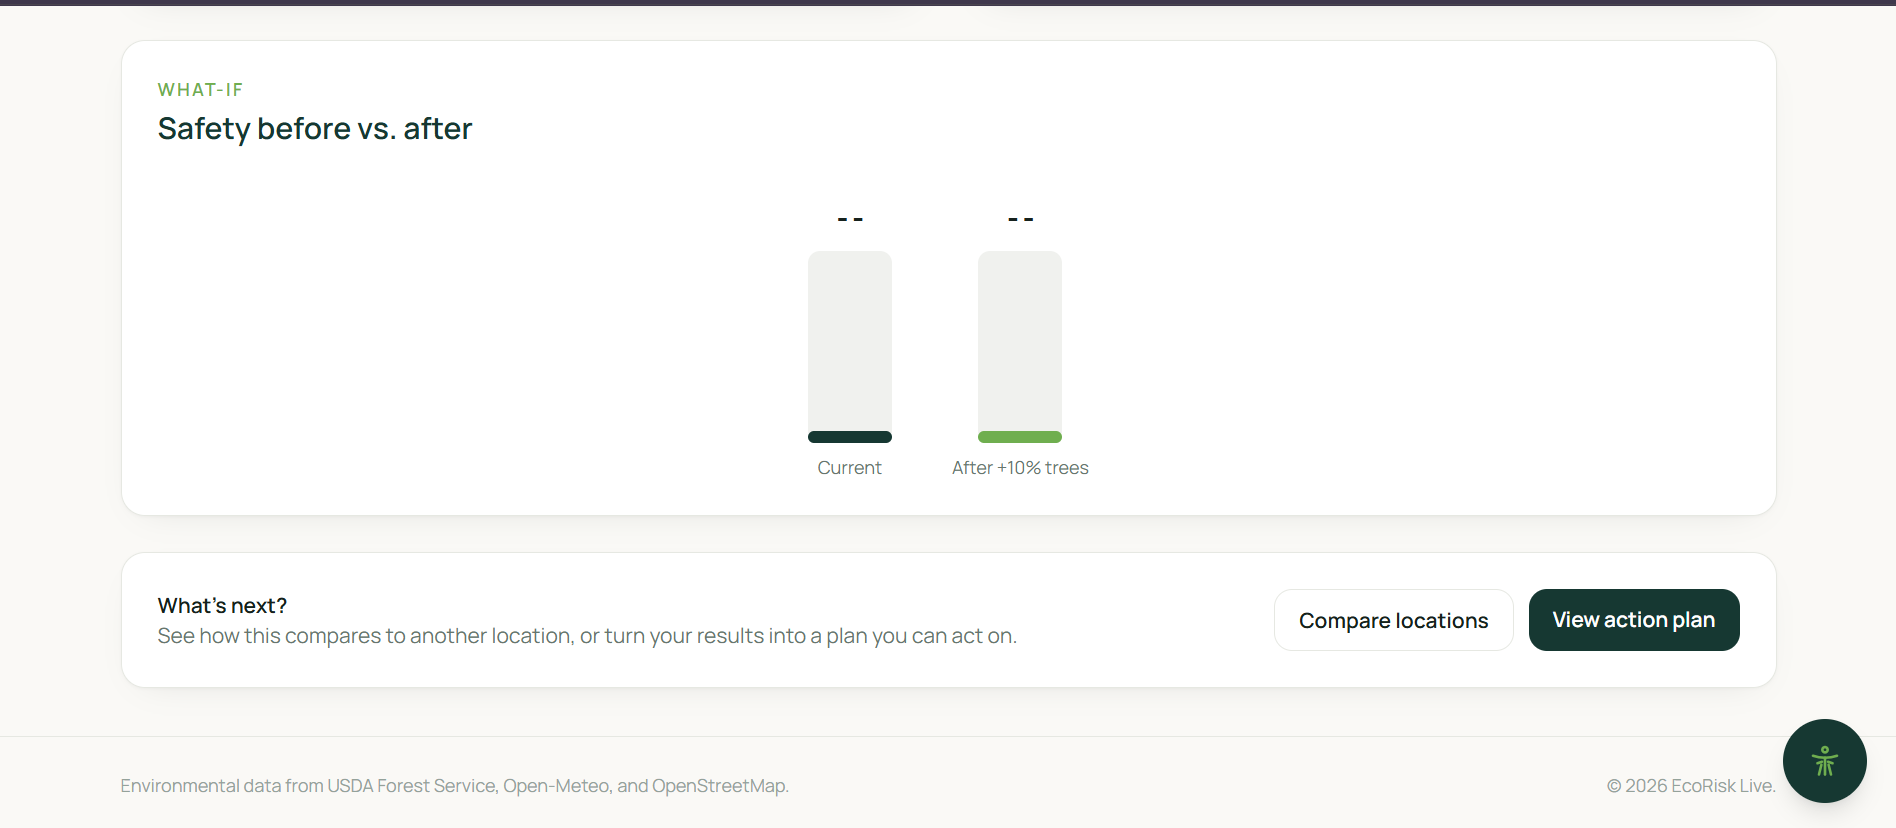
this is the before and after
-
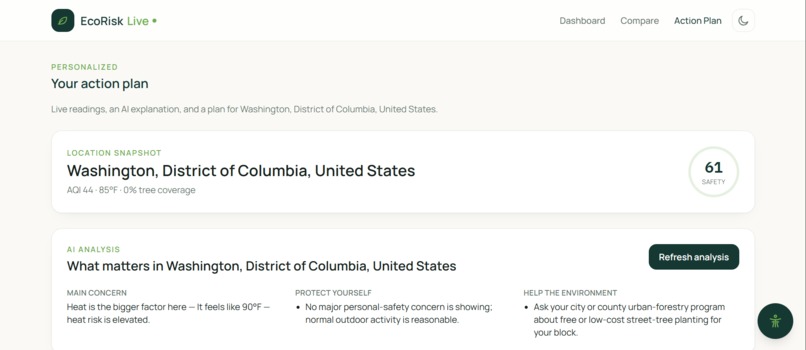
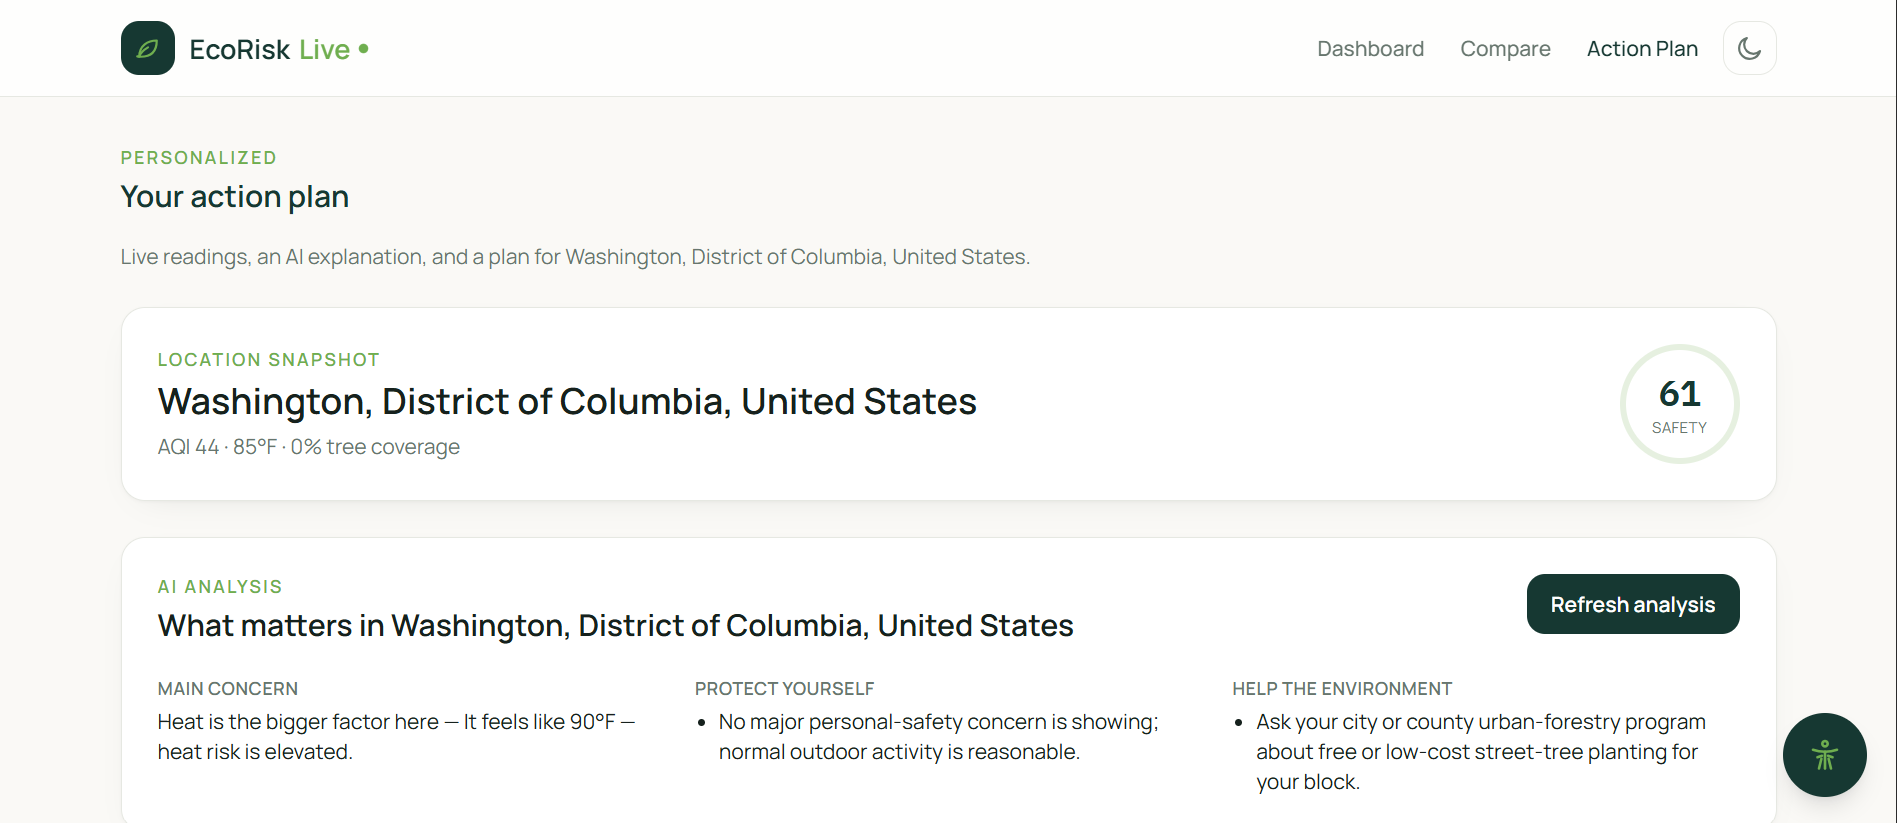
This is the action plan + ai analysis
-
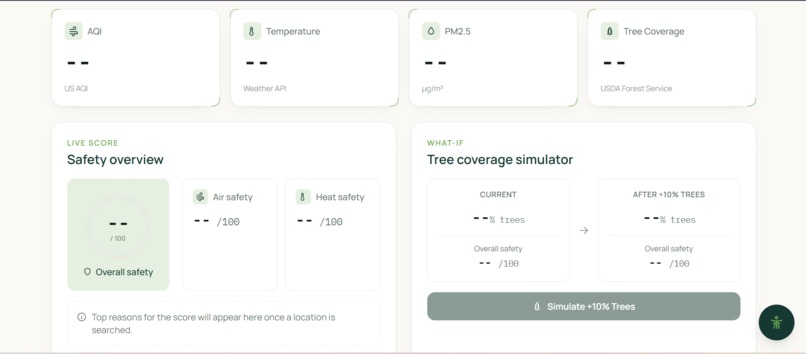
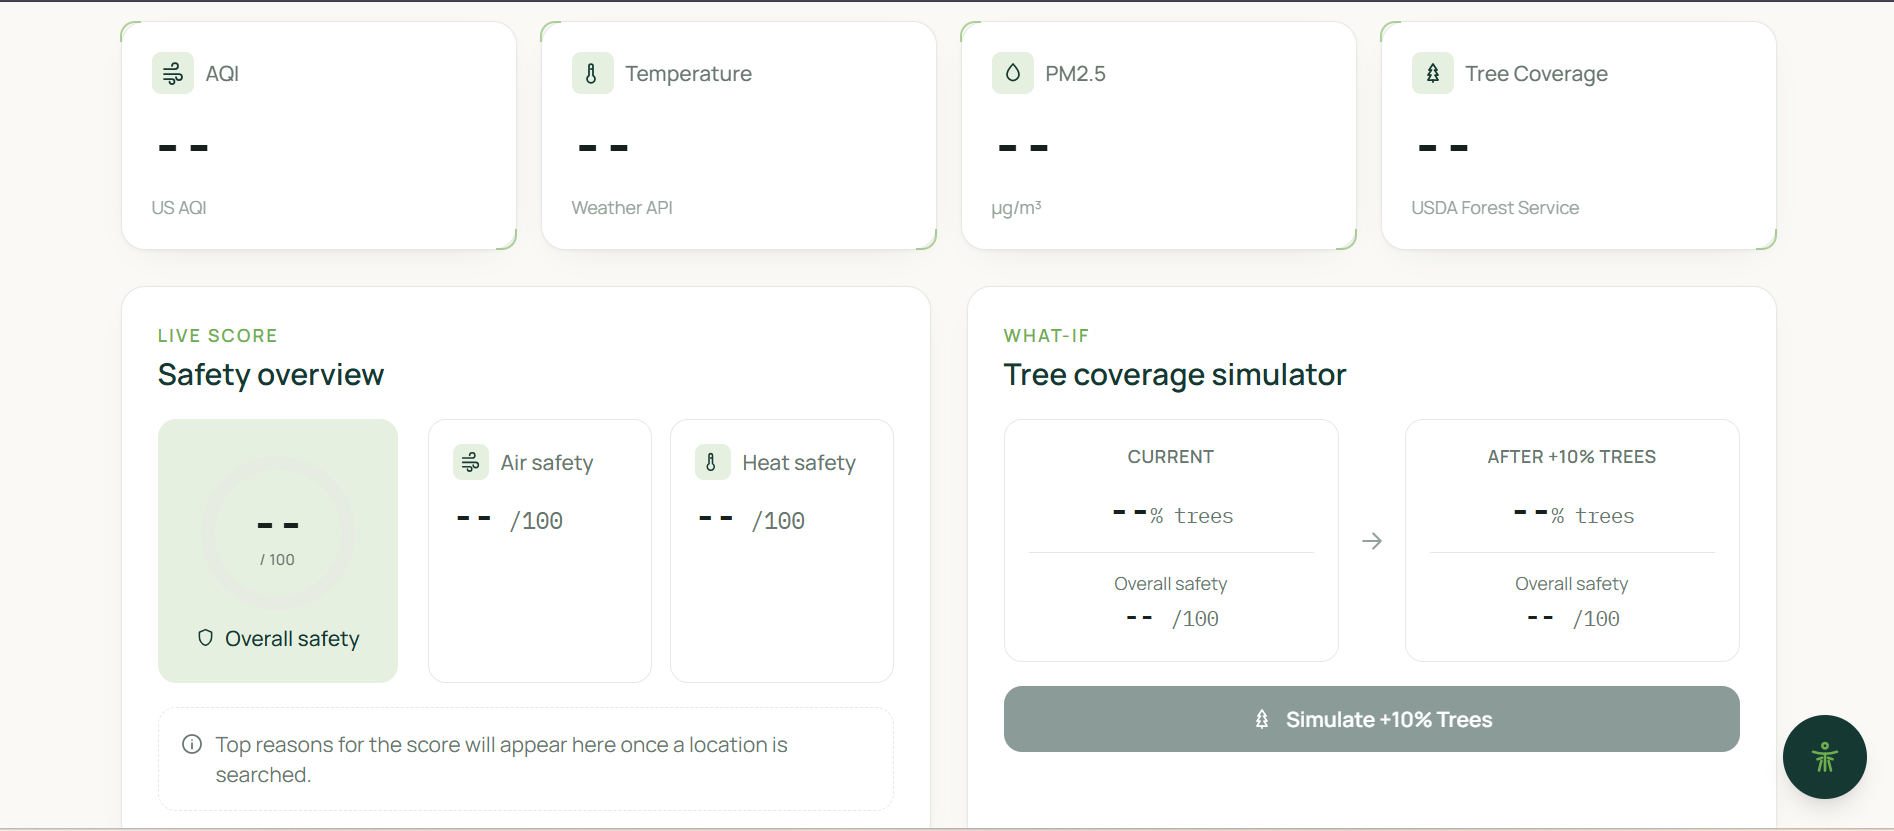
This is the information + risk engine + tree simulation
-
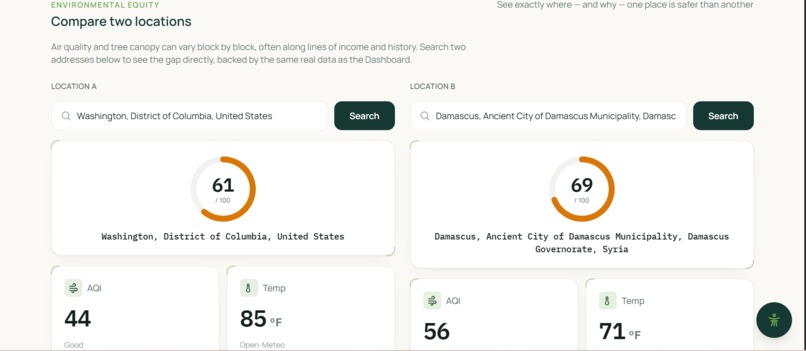
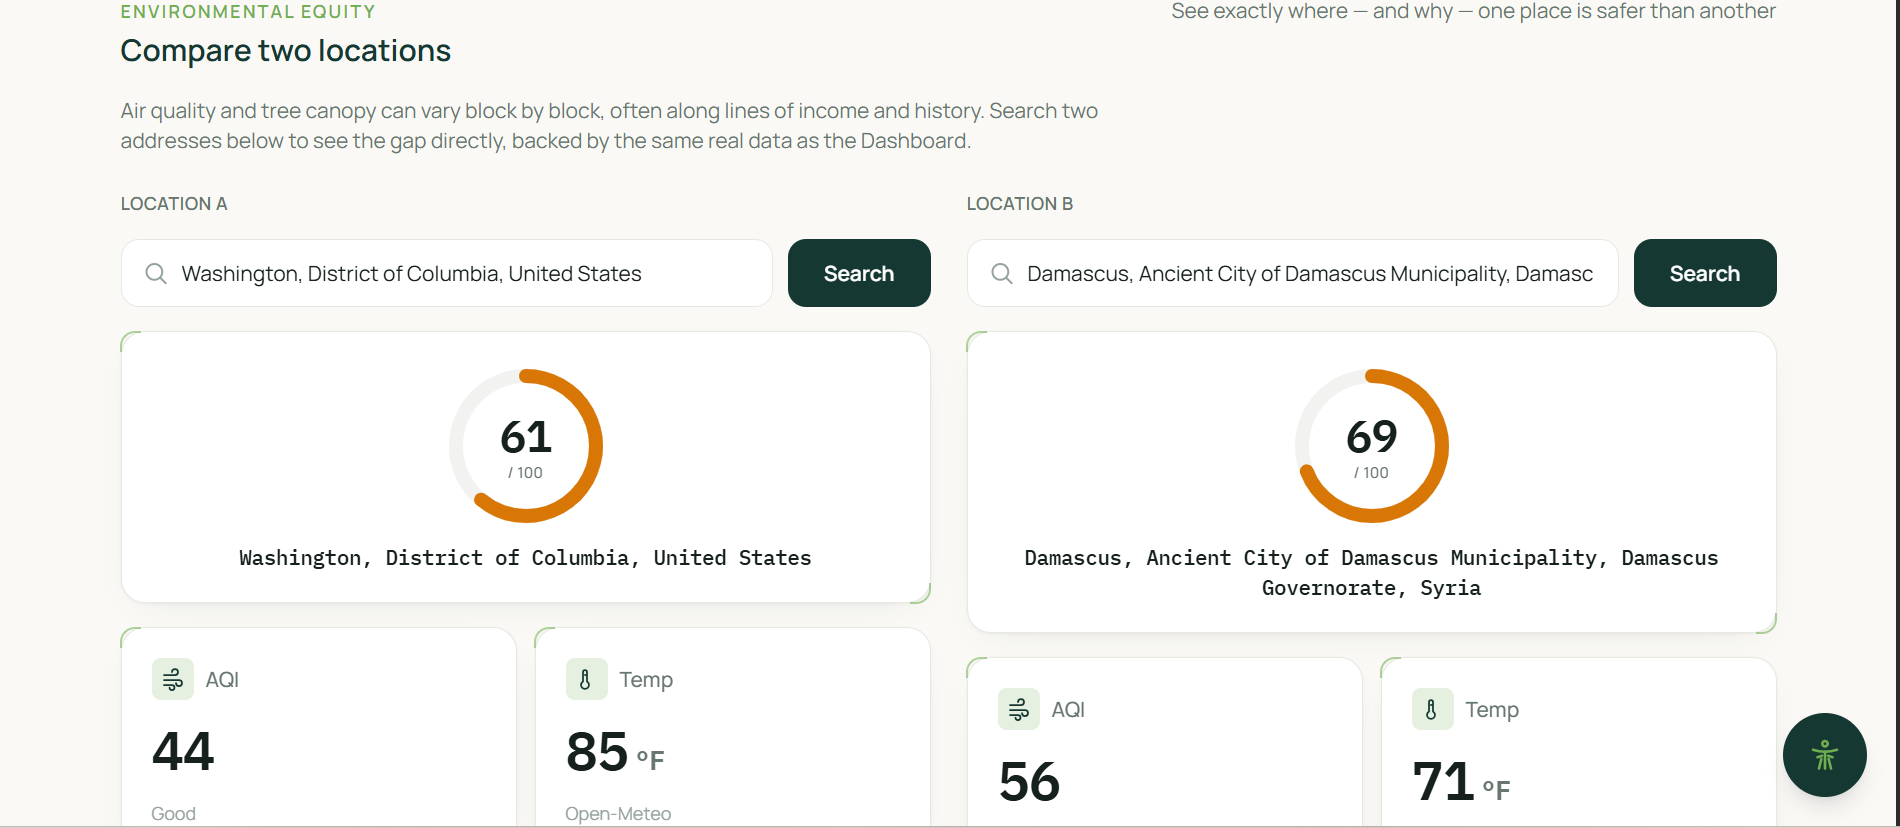
This is the compare locations

EcoRisk Live
Inspiration
The inspiration for EcoRisk Live came from seeing environmental challenges firsthand and recognizing the real impact those conditions can have on people's everyday lives. Environmental issues are often discussed through statistics, charts, and reports, but behind those numbers are communities and individuals who have to experience the effects directly.
What stood out to us was not only the challenges people face in areas with poor environmental conditions, but also the determination of people and organizations working to improve those conditions. We wanted to create something that could contribute to that effort by making environmental information easier to understand and more actionable.
We noticed that environmental information is often separated into individual measurements. A person may be able to find the air quality for a location, look up its temperature, and find information about tree coverage, but those numbers do not necessarily provide a simple picture of the overall environmental conditions of that place. Someone without a technical or environmental background may see several statistics without knowing which ones matter most, how they relate to each other, or what changes could potentially improve the situation.
That led us to ask a simple question: What if environmental data could be brought together into one clear experience that not only shows people what is happening, but helps them understand why it is happening and explore what could change?
That question became the foundation of EcoRisk Live.
Our goal was not to simply build another environmental dashboard. We wanted to create an interactive platform where users could search a location, view multiple environmental factors at once, receive an easy-to-understand safety score, compare different locations, simulate potential environmental changes, and receive explanations and recommendations based on the data.
How We Built It
We began the development process using Visual Studio Code for our initial programming and development. Our project uses React and Vite for the frontend, along with HTML and JavaScript to create the structure and functionality of the application. We also used Leaflet to create the interactive map experience.
One of the most important parts of EcoRisk Live was finding ways to combine information from multiple public data sources into one consistent application. Rather than relying on a single source, we connected several services so that different environmental factors could be represented together.
For location search, we used Photon, an open geocoder built on OpenStreetMap data. This allows users to search for a specific location and have EcoRisk Live identify the corresponding geographic information.
For temperature information, we used the Open-Meteo Forecast API. We also used the Open-Meteo Air Quality API to obtain air-quality information, including AQI and PM2.5.
For tree coverage, we used USDA Forest Service satellite-derived Tree Canopy Cover data for locations within the continental United States. Because that dataset does not cover every possible location, our application provides an estimate for locations outside its available coverage.
For the map itself, we used OpenStreetMap contributors through Leaflet to provide the geographic visualization users interact with.
Bringing all of these sources together required more than simply connecting APIs. We had to figure out how to process data coming from different systems, organize the information into a consistent format, and present it in a way that made sense to someone using the application for the first time.
We then built our own risk engine to turn the collected environmental measurements into comparable scores. Rather than leaving users with several unrelated values, the system combines those environmental factors into air, heat, and overall safety scores. We also created a simulation that allows users to explore a “what if?” scenario by increasing tree coverage and observing how the calculated conditions can change.
Beyond the core dashboard, we built tools for comparing locations and created an Action Plan that translates environmental information into plain-language insights and practical recommendations. We also began developing an AI chat feature intended to let users interact with their environmental data through follow-up questions.
Throughout the development process, our team worked across different parts of the project and continuously integrated our work together. This allowed us to build a project that combines frontend development, data integration, environmental analysis, mapping, simulations, and AI into one platform.
What We Learned
One of the biggest lessons we learned from this project was that building an application that feels close to production-ready is much more difficult than simply writing code that works.
Before this experience, it was easy for us to think of programming as the primary part of building an app. However, as we worked through EcoRisk Live, we learned that development involves many other parts: research, planning, design, testing, communication, problem-solving, and collaboration.
We strengthened our knowledge of the programming technologies we were already using by researching documentation, exploring different websites and resources, troubleshooting problems, and learning how different tools could work together. We also learned a significant amount from one another. Each person on our team brought different strengths and approaches to the project, and working together allowed us to learn techniques and concepts that we may not have discovered on our own.
We also learned more about the environmental problems we were trying to represent. Researching environmental data made us think beyond the numbers on the dashboard. We learned more about the challenges faced by communities experiencing poor environmental conditions and about different approaches that can potentially help address those challenges.
This changed how we thought about the purpose of our project. The goal was no longer simply to make a technically impressive application. We wanted the information to have meaning for the people using it.
Perhaps one of the most important lessons was realizing that building an app is not just programming. It also involves understanding the problem, researching the subject, deciding what information is useful, designing an experience that people can understand, and working together to turn an idea into something functional.
Challenges We Faced
Our team faced several challenges throughout the development process.
One of the biggest was the distance between our team members. Working remotely made communication and coordination more difficult. We could not always work together in the same physical space, which meant that sharing updates, explaining problems, and coordinating changes required additional communication and planning.
We also had challenges when it came to deciding who would be responsible for each part of the project. Determining roles, dividing features, and making sure responsibilities were balanced required discussion and compromise. At times, we had different ideas about what we should build or how we should approach a feature, and reaching decisions took time.
Another challenge was designing a consistent format and structure for the application. We had to figure out how different features should look and feel while still making the application easy to understand. It was not enough for each individual feature to work; they also had to feel like parts of the same product.
We also struggled with the amount of research required to make the project meaningful. We had to research data sources, understand what the environmental measurements represented, determine how they could be combined, and think carefully about how to communicate those results to users.
These challenges taught us that collaboration itself is a skill. A strong project is not created simply because each person finishes their individual task. The team has to communicate, adapt, solve disagreements, integrate different pieces of work, and keep moving toward the same goal.
What's Next
Although this competition gave us the opportunity to create EcoRisk Live, we do not see the project as something that ends with the competition.
One of our immediate goals is to continue developing the AI chat feature so users can interact more directly with their environmental information and ask questions about what they are seeing. We want this feature to become a useful extension of the Action Plan rather than simply another chatbot.
We also hope to continue expanding the data used by EcoRisk Live. Right now, some of our environmental information has geographic limitations, such as the USDA Forest Service tree-canopy dataset being available for the continental United States. In the future, we would like to research additional data sources that could allow us to provide tree-coverage information and other environmental measurements for locations outside the current coverage area.
More broadly, we do not want EcoRisk Live to remain limited to only air quality and temperature. There are many other environmental factors that could be explored, and we would like to continue researching ways to incorporate additional information into the platform.
We are also considering the possibility of publishing EcoRisk Live in the future so that it can become something people can actually use beyond this competition.
Most importantly, we want to continue learning.
This competition gave us an idea, but it also gave us something even more valuable: a reason to push ourselves beyond what we already knew. We learned new programming concepts, explored unfamiliar technologies, researched environmental challenges, and experienced the difficulties of building a project as a team.
EcoRisk Live is not the end of that process. It is the beginning.
We do not want to limit ourselves to what the project currently can do. We want to continue improving the platform, exploring new environmental data, developing new tools, and expanding our understanding of both technology and the environmental problems we are trying to help solve.
The sky is the limit for EcoRisk Live.


Log in or sign up for Devpost to join the conversation.