Inspiration
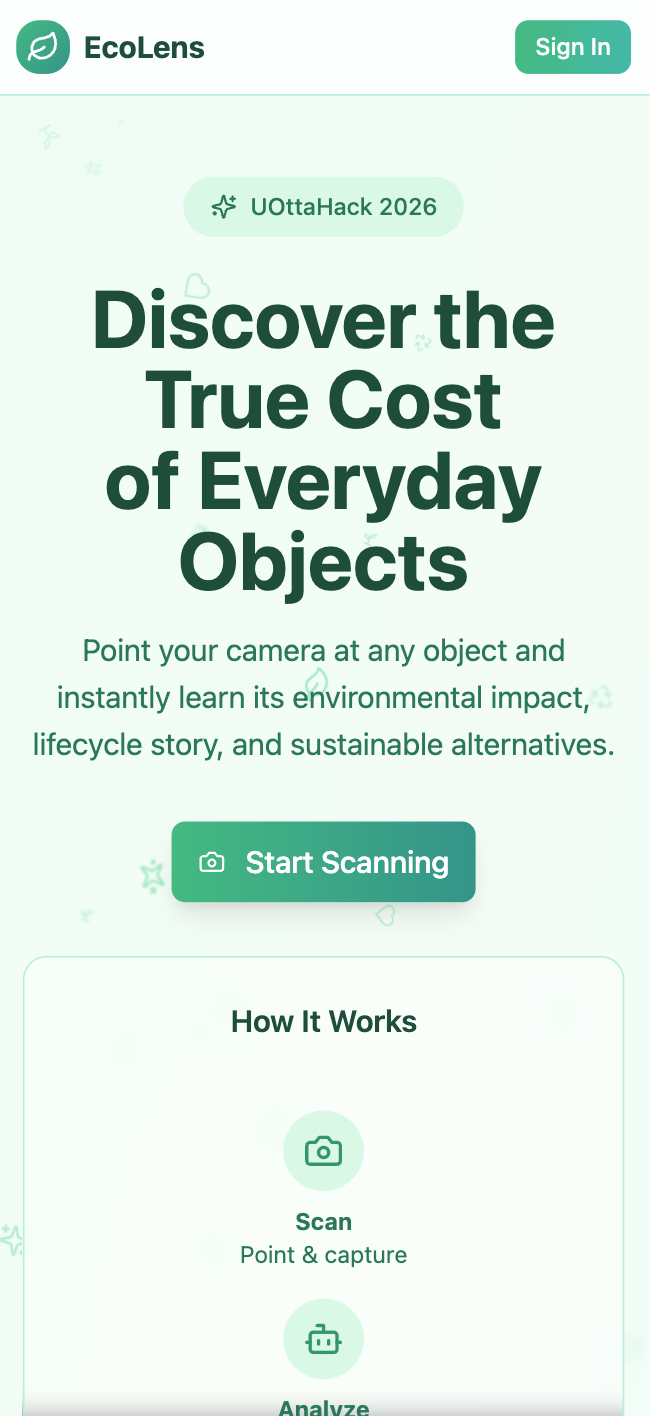
EcoLens was born from a simple drive: putting into perspective the environmental costs correlated with our everyday items. We wanted to make carbon footprint data accessible and meaningful to the average consumer who might not understand what $2.5 \text{ kg CO}_2$ actually means.
What We Learned
We learned a lot throughout this process:
- Experimenting with different AI models (ultimately landing on Google Gemini 2.5 Flash for image analysis)
- Working with React and TypeScript to build a responsive mobile-first experience
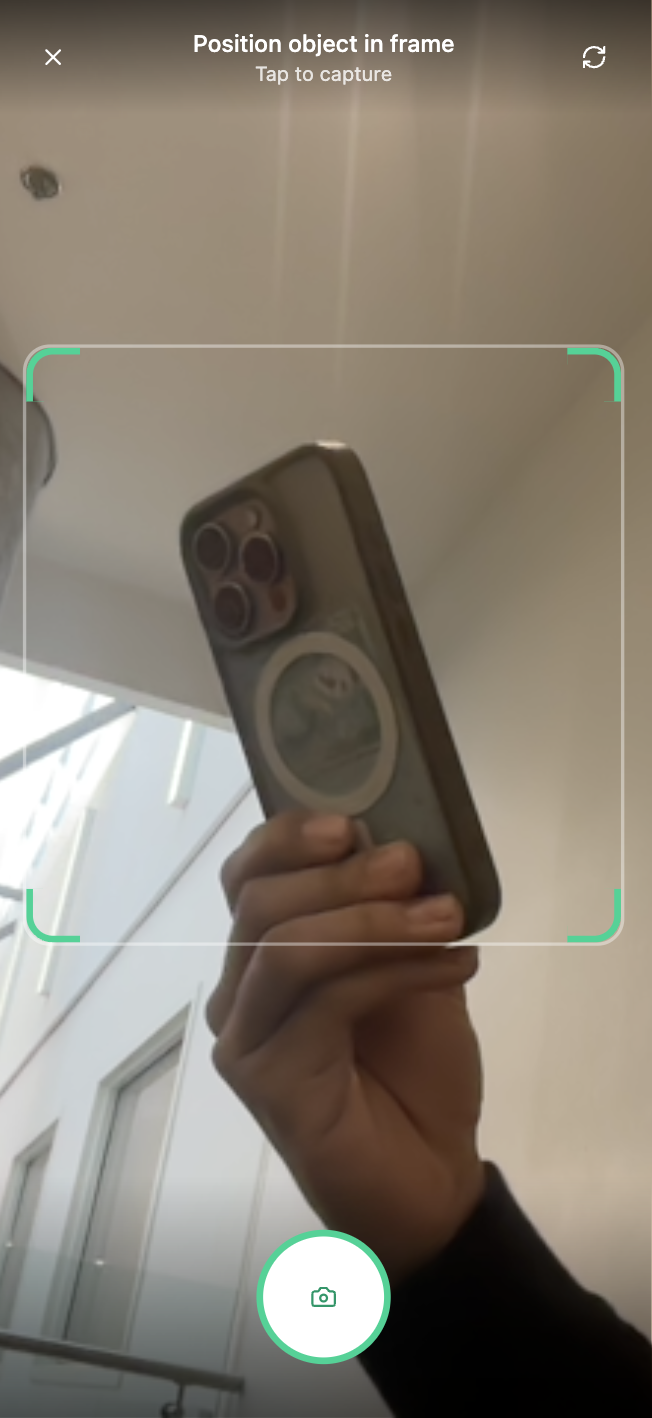
- Integrating hardware capabilities like the camera module to deliver a seamless scanning experience
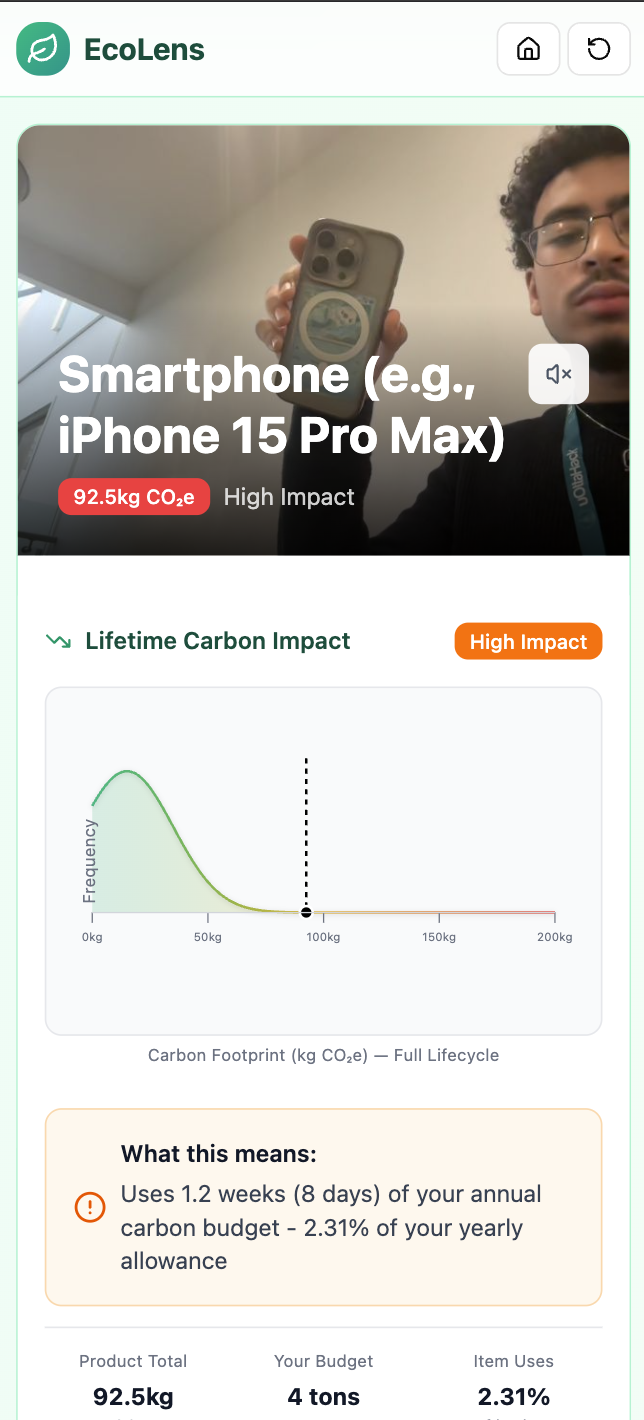
- Understanding how to translate complex environmental data into relatable comparisons
How We Built It
We built EcoLens using:
- Frontend: React, TypeScript, Vite, and Tailwind CSS
- Backend: Node.js with Express
- Database: MongoDB Atlas
- AI: Google Gemini 2.5 Flash for product image analysis
- Voice: ElevenLabs for text-to-speech narration of eco-tips
Challenges We Faced
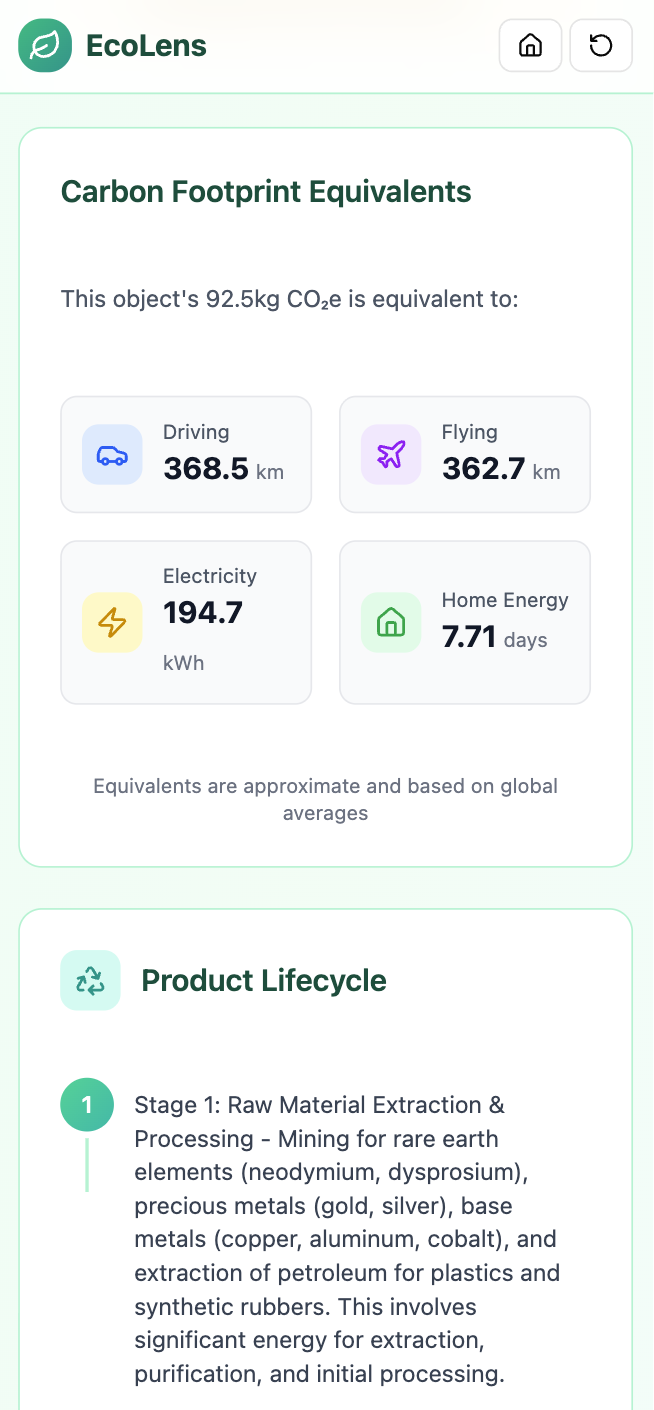
Our biggest challenge was figuring out how to make environmental impact relatable to the average user. Raw numbers like $5 \text{ kg CO}_2$ don't resonate with most people.
We spent a lot of time brainstorming before landing on two key solutions:
- Carbon Comparisons — translating emissions into equivalents using formulas like:
$$\text{Miles Driven} = \frac{\text{CO}_2 \text{ (kg)}}{0.21}$$
$$\text{Trees Needed} = \frac{\text{CO}_2 \text{ (kg)}}{21} \times 12 \text{ months}$$
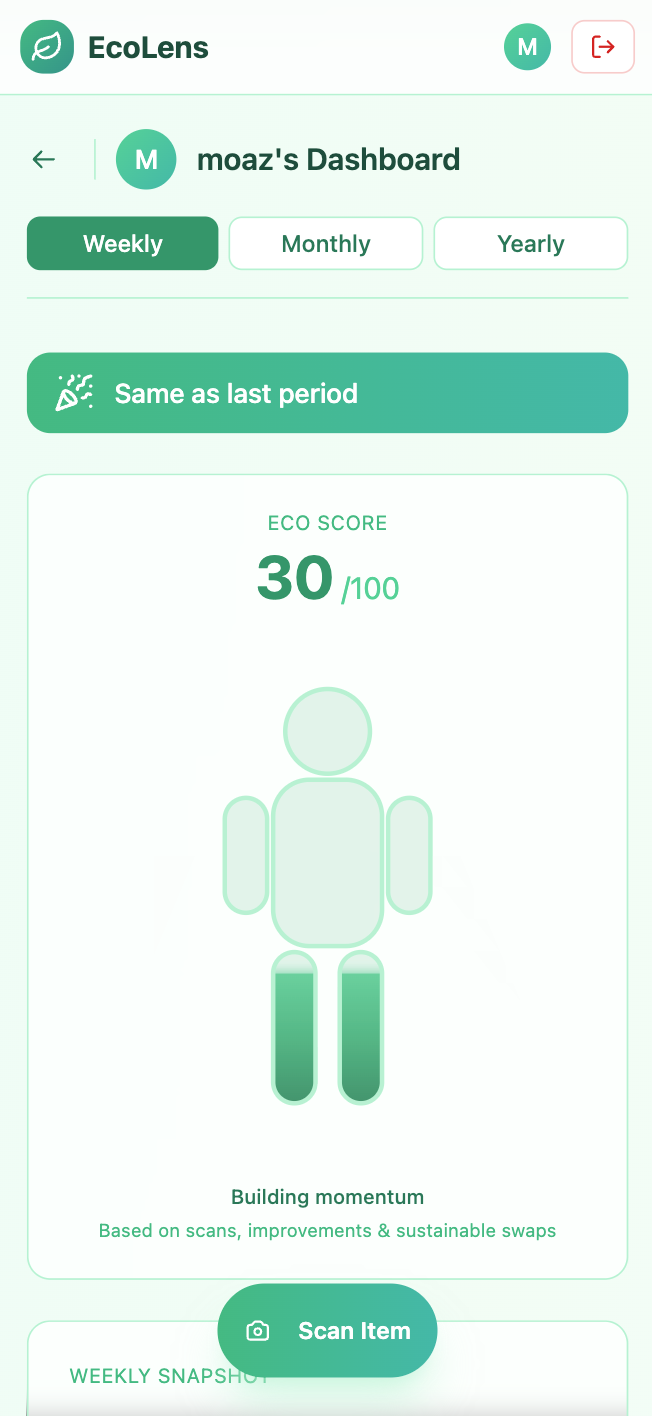
- The Profile Page — delivering a personalized experience that tracks your scanned products and calculates your cumulative impact:
$$\text{Total Footprint} = \sum_{i=1}^{n} \text{CO}_2^{(i)}$$
We believe this personalized approach is what makes EcoLens stand out — it's not just about individual products, it's about understanding your environmental footprint.
Built With
- elevenlabs
- express.js
- gemini
- mongodb
- node.js
- react
- react-native
- tailwind

Log in or sign up for Devpost to join the conversation.