-
-
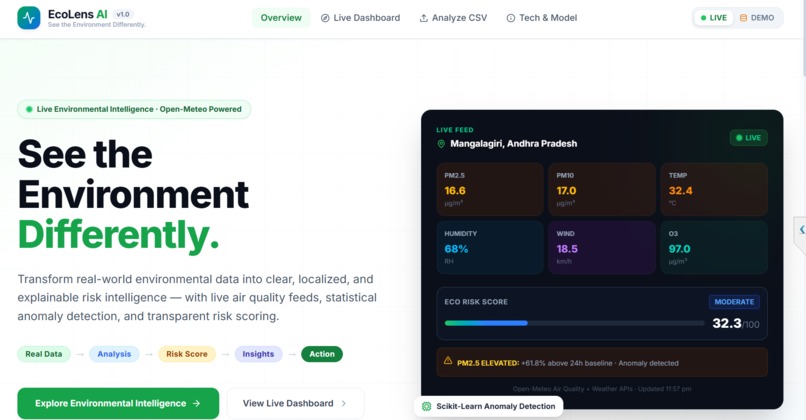
landing_page
-
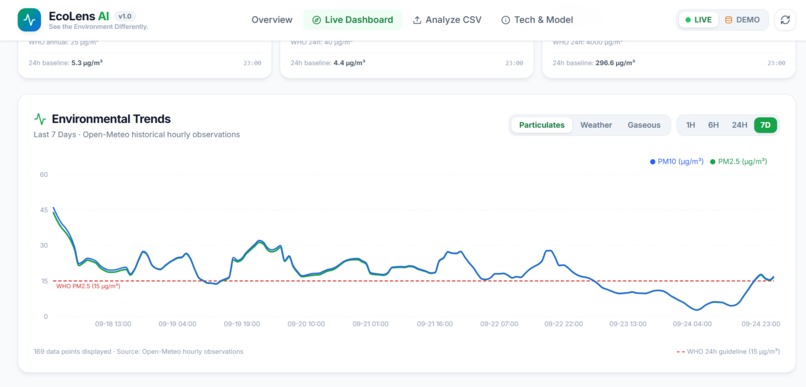
live_dashboard
-
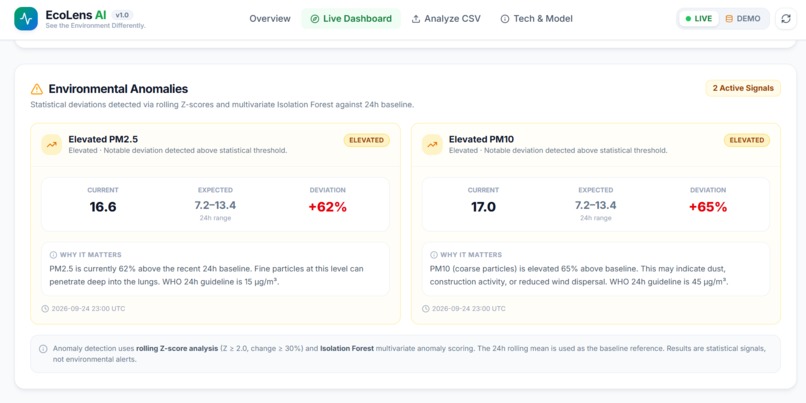
Eco factors, temp
-
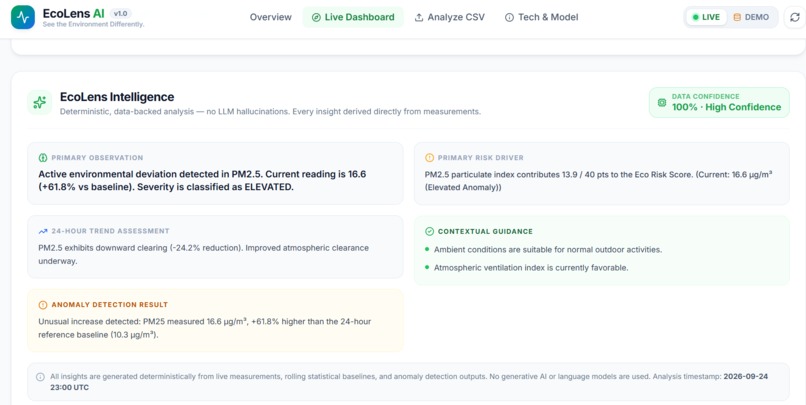
CSV Analysis / Data Intelligence
-
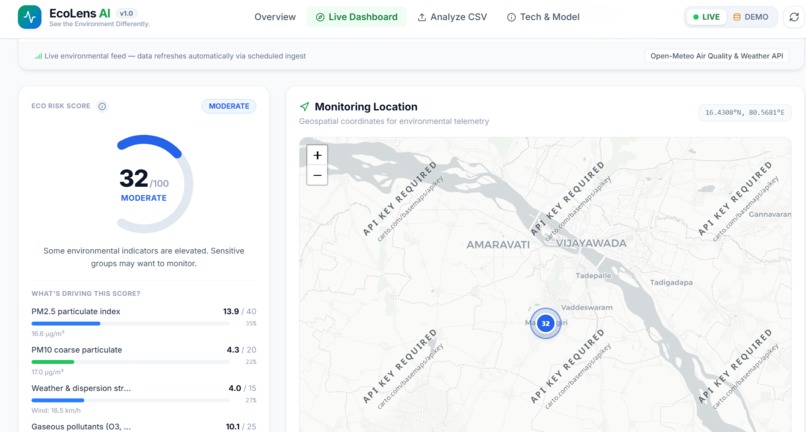
eco risk score
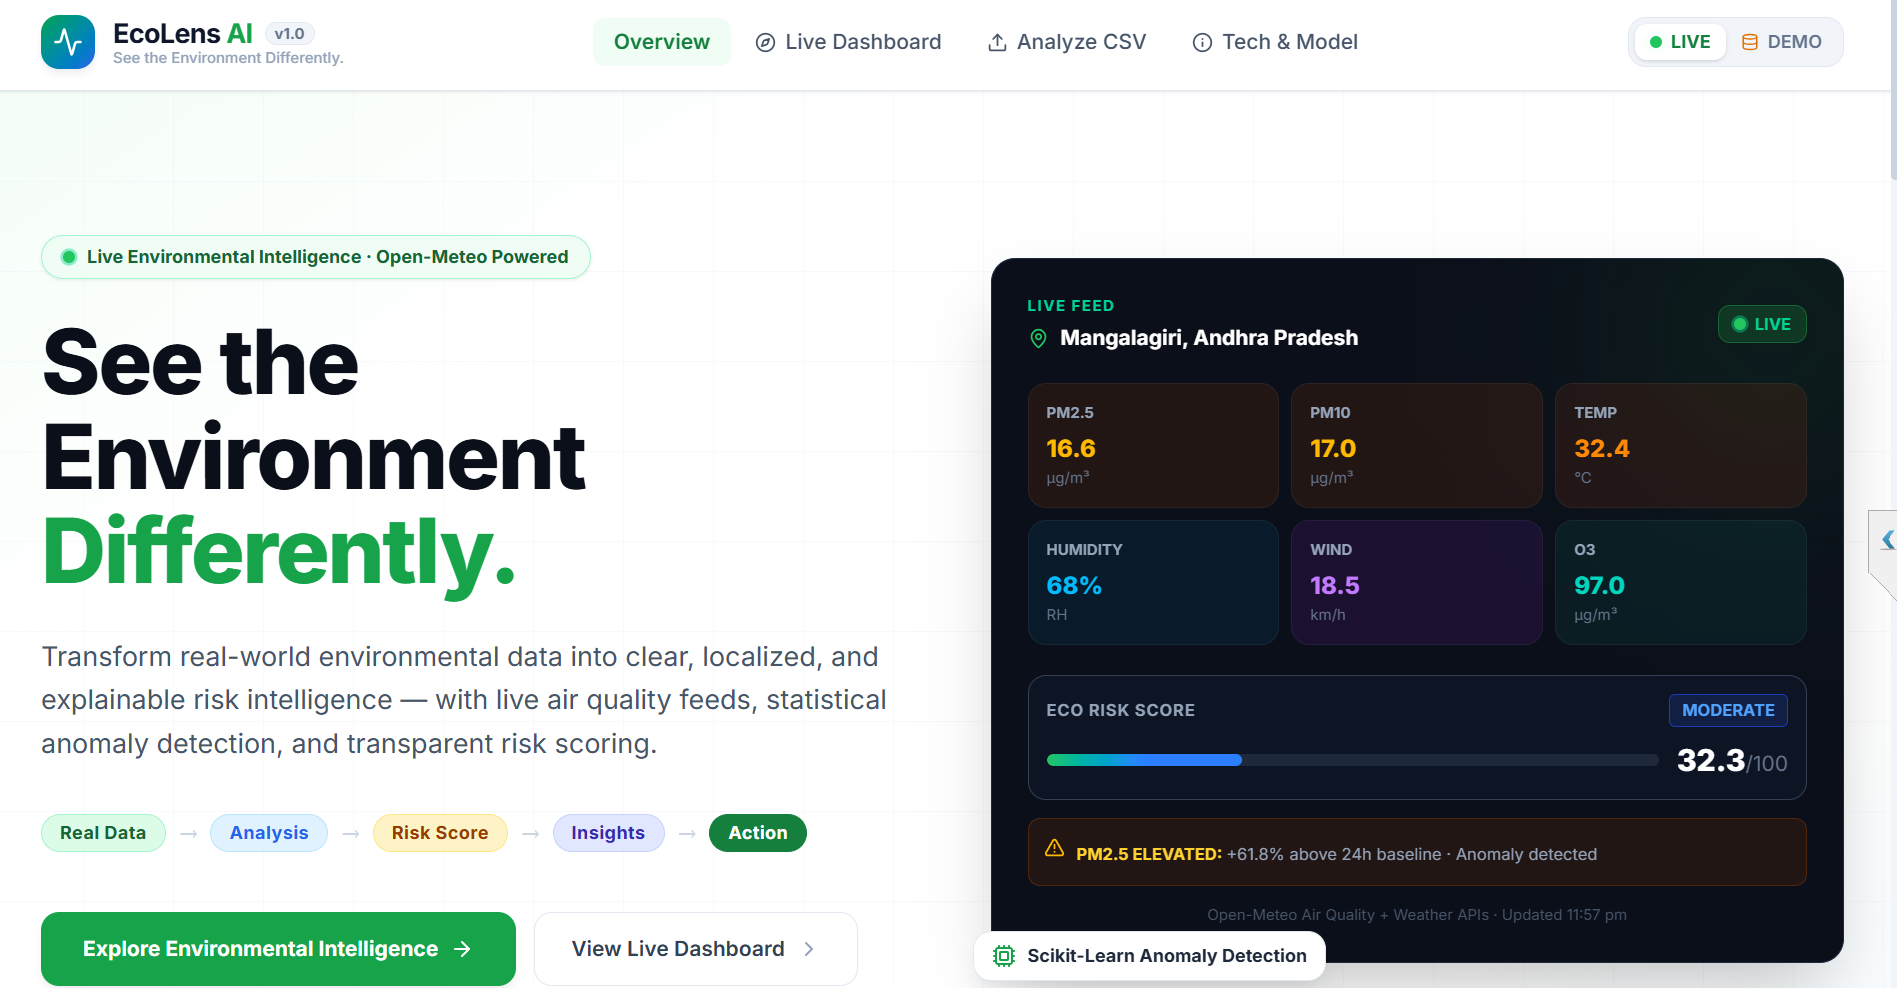
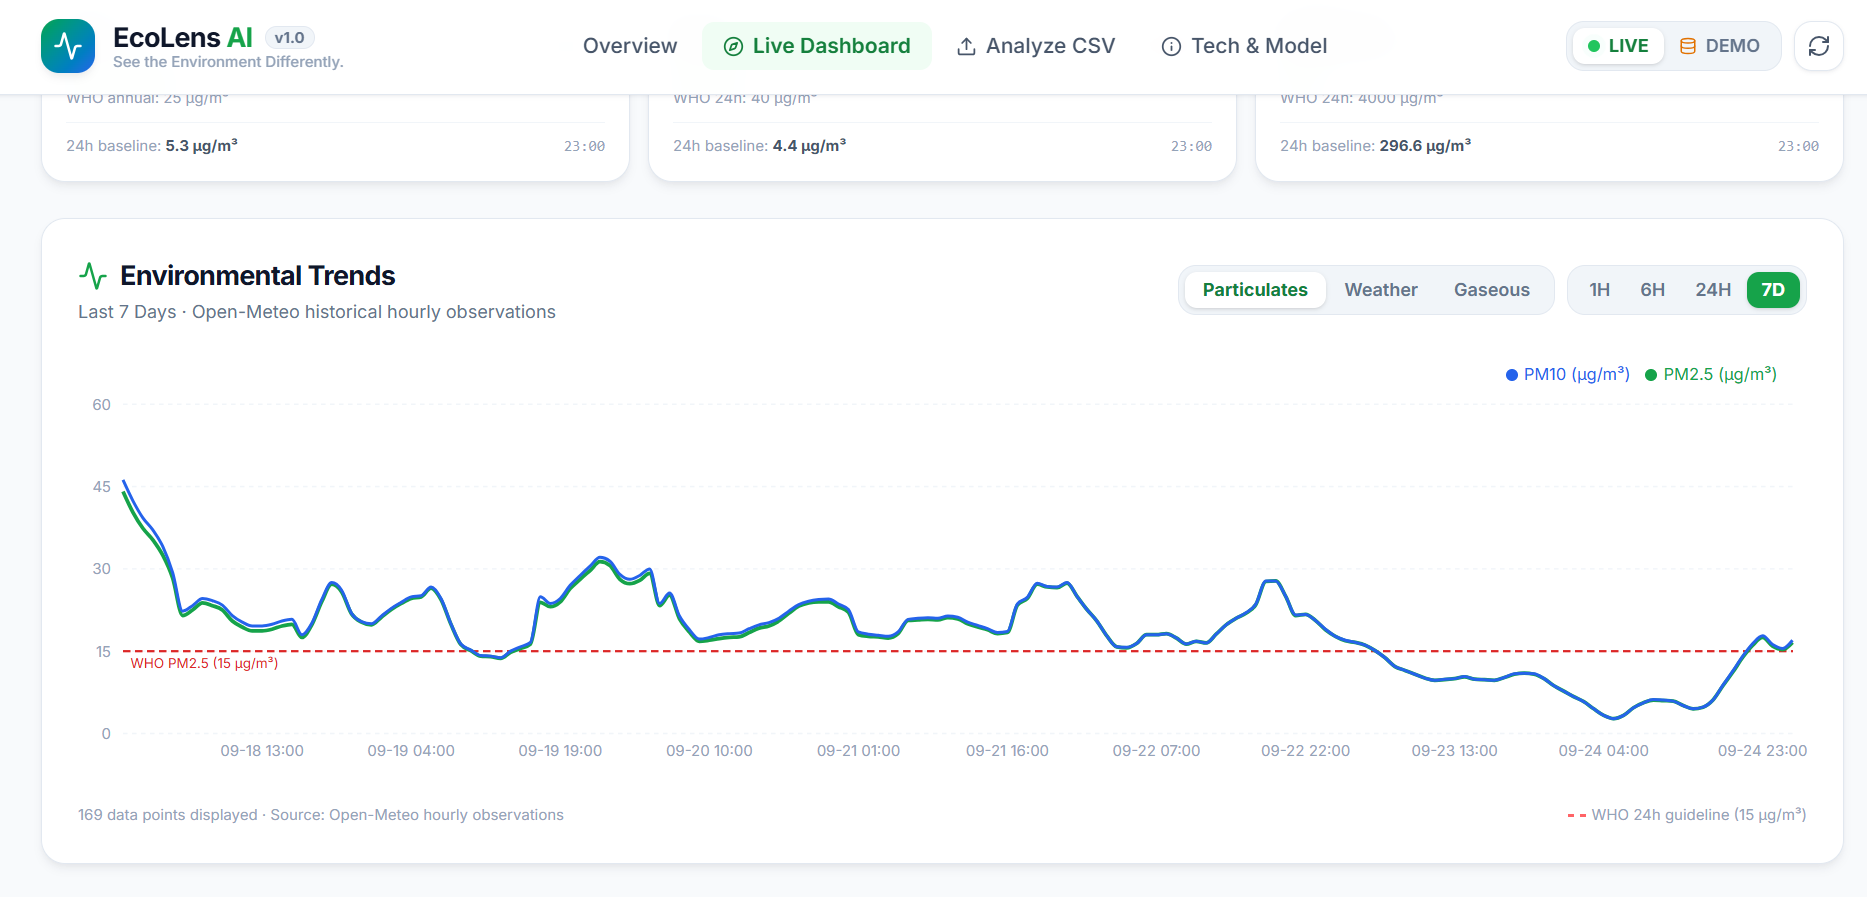
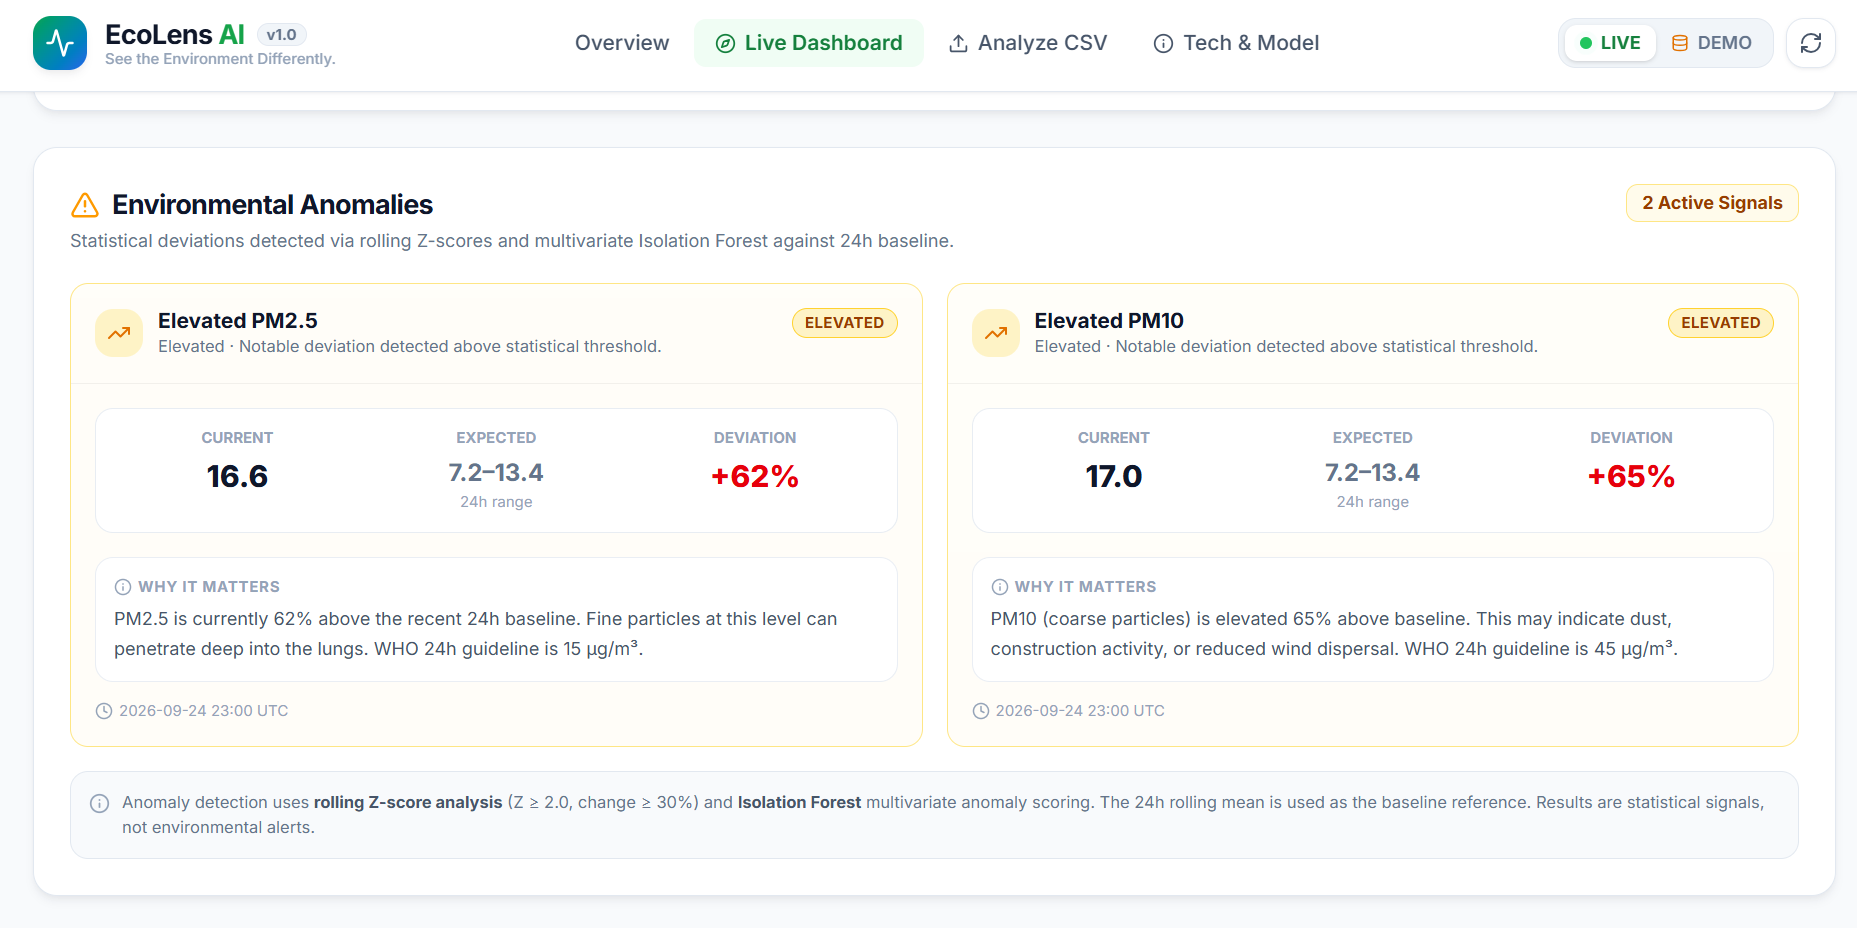
🌍 EcoLens AI
See the environment differently.
Environmental data is everywhere—but understanding what that data actually means is still difficult.
Air quality measurements, temperature records, rainfall patterns, water-quality indicators, and other environmental signals often exist as disconnected datasets. For a community, student, researcher, or environmental organization, turning those numbers into a clear picture of environmental conditions can require significant technical knowledge.
EcoLens AI was built to close that gap.
💡 Inspiration
We were inspired by a simple question:
What if environmental data could explain itself?
Instead of showing users dozens of disconnected measurements and charts, we wanted to create an environmental intelligence layer that could bring multiple signals together, identify unusual patterns, and explain what might be contributing to environmental risk.
This idea became EcoLens AI—a platform designed to turn environmental data into something people can actually understand.
Our goal wasn't to build another dashboard that simply displays numbers.
We wanted to build a system that answers:
- What is happening?
- Is anything unusual?
- What factors are contributing to it?
- How significant is the change?
- What should we pay attention to?
🚨 The Problem
Environmental information is often:
- Scattered across different datasets
- Difficult for non-technical users to interpret
- Presented as raw measurements
- Missing historical context
- Difficult to translate into actionable insights
A pollution spike, temperature anomaly, or rainfall deviation may look like an isolated number.
But environmental problems are rarely isolated.
The real challenge is understanding the relationship between multiple environmental signals.
This creates a gap:
Environmental Data → Understanding → Action
EcoLens AI is designed to help bridge that gap.
🔎 Our Solution
EcoLens AI transforms environmental measurements into an interactive environmental intelligence experience.
The platform follows a simple pipeline:
Environmental Data
       ↓
Data Processing
       ↓
Feature Analysis
       ↓
Anomaly Detection
       ↓
Environmental Risk Score
       ↓
Explainable Insights
       ↓
Human Understanding
Instead of simply saying:
PM2.5 = 84
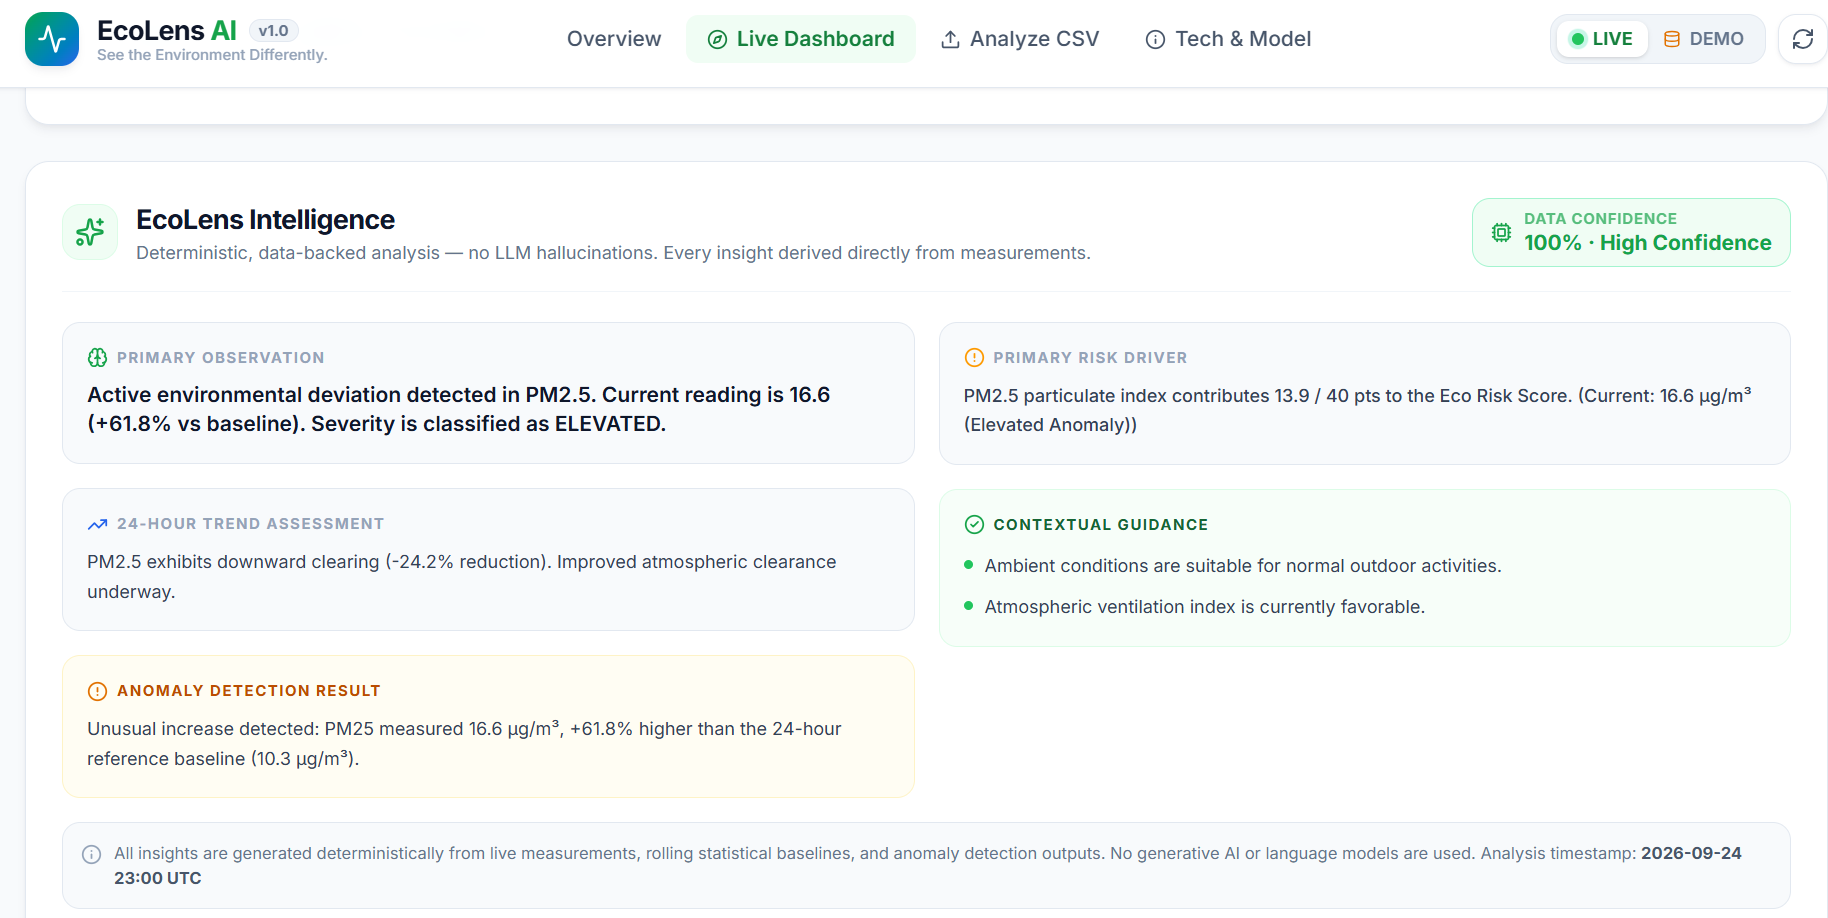
EcoLens AI can identify that the measurement is unusually high compared with the available baseline and explain that it is contributing significantly to the overall environmental risk.
🧠 How EcoLens AI Works
1. Environmental Data
The prototype works with environmental measurements such as:
- PM2.5
- PM10
- Temperature
- Humidity
- Rainfall
- Water-quality indicators
- Wind conditions
The system can work with prepared demonstration data and is designed to support CSV-based environmental datasets.
2. Data Processing
Environmental data is cleaned, normalized, and transformed into features that can be analyzed.
This helps make measurements from different environmental indicators comparable.
3. AI-Powered Anomaly Detection
EcoLens AI analyzes environmental patterns and identifies observations that significantly differ from the available baseline.
The prototype can use techniques such as:
- Isolation Forest
- Statistical anomaly detection
- Rolling averages
- Z-score analysis
For example:
Normal PM2.5 Pattern
        ↓
Current measurement
        ↓
Significant deviation detected
        ↓
Environmental anomaly
📊 4. Environmental Risk Intelligence
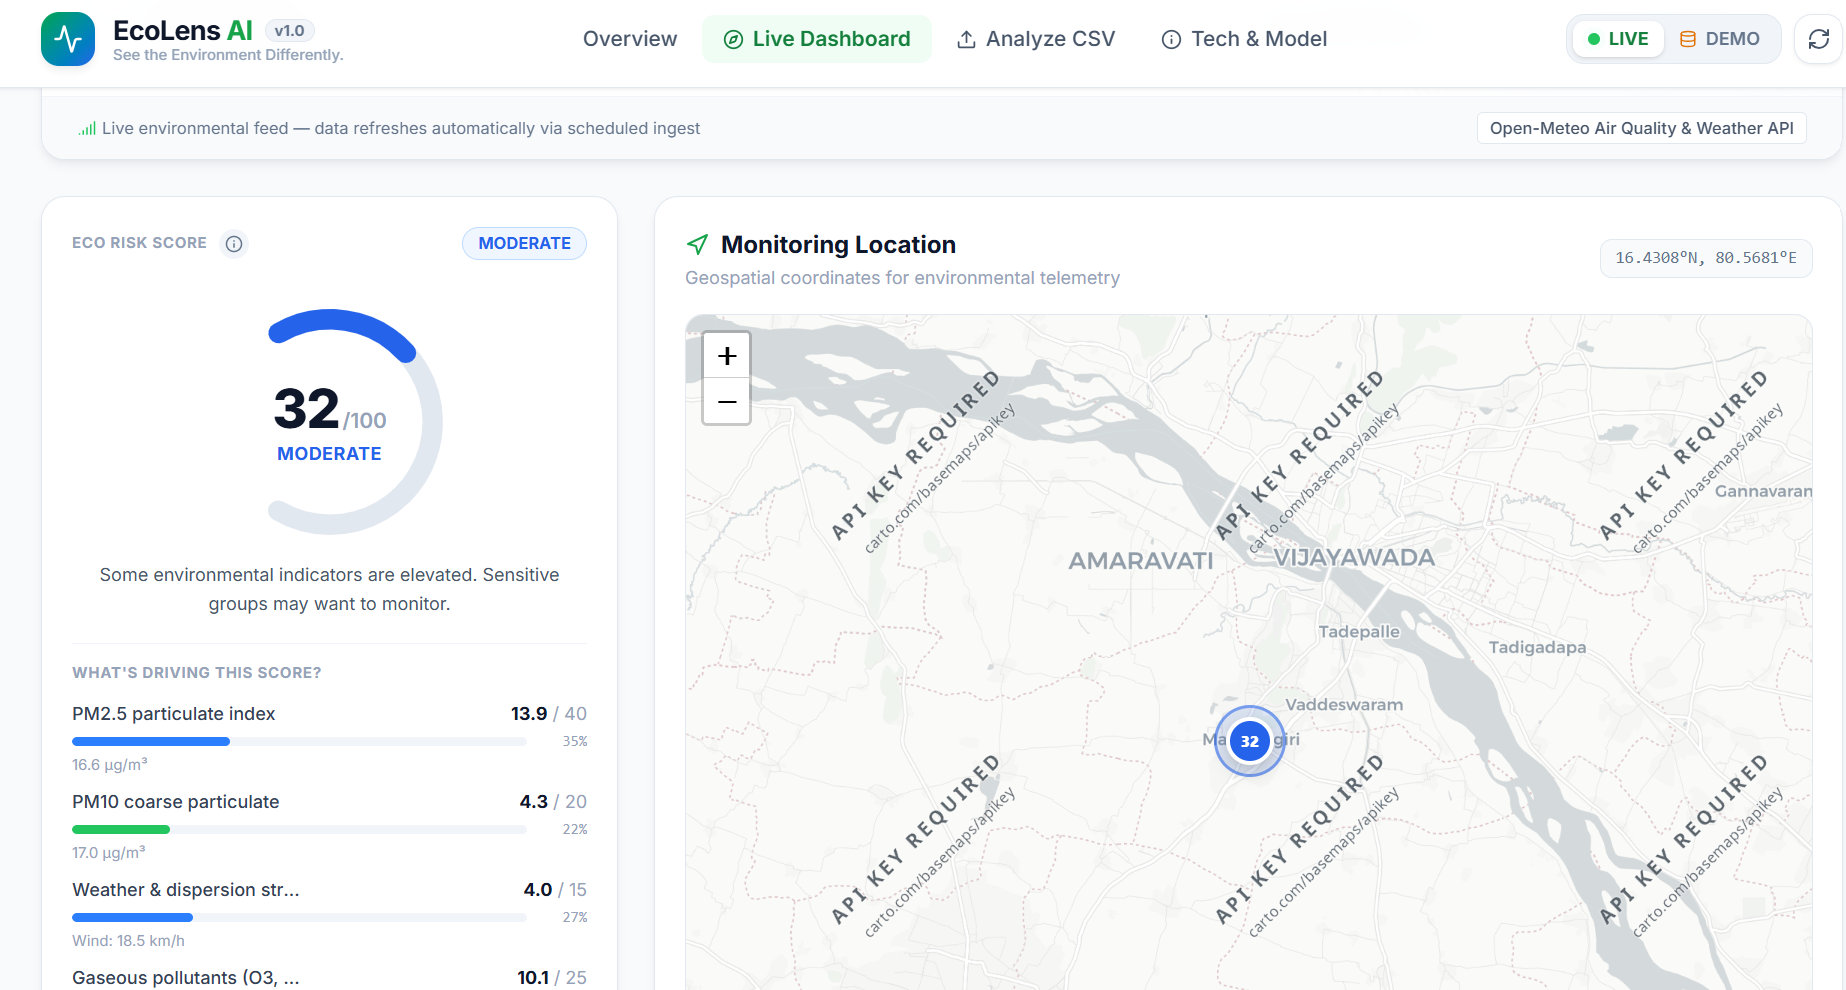
EcoLens AI combines multiple environmental indicators into a prototype Environmental Risk Score from 0–100.
The score is designed as an intuitive visualization rather than an official environmental standard.
Example:
Eco Risk Score
72 / 100
ELEVATED
The dashboard then breaks down the factors contributing to the score.
For example:
| Indicator | Status |
|---|---|
| Air Pollution | High |
| Temperature | Moderate |
| Rainfall | Moderate |
| Water Quality | Low |
This makes the score explainable instead of treating it as a black box.
🔬 5. Explainable Insights
One of the core principles behind EcoLens AI is:
Don't just give users a score. Explain the score.
For example:
Environmental conditions show elevated risk primarily due to pollution levels being above the available historical baseline, combined with an unusual temperature pattern.
The objective is to turn complex environmental measurements into understandable information.
🖥️ 6. Interactive Environmental Dashboard
The dashboard provides a visual overview of environmental conditions.
It includes:
- Environmental Risk Score
- Air-quality indicators
- Temperature
- Humidity
- Rainfall
- Water-quality indicators
- Historical trends
- Anomaly detection
- Risk contributors
- Environmental insights
The interface was intentionally designed with a modern environmental + AI intelligence visual language.
We wanted the experience to feel less like a spreadsheet and more like an environmental command center.
📂 7. Environmental Data Upload
EcoLens AI also supports the concept of uploading environmental CSV data.
The workflow is:
Upload CSV
   ↓
Validate Data
   ↓
Process Dataset
   ↓
Analyze Environmental Signals
   ↓
Detect Anomalies
   ↓
Calculate Risk
   ↓
Update Dashboard
This allows the prototype to work with different environmental datasets rather than being tied to a single hard-coded example.
⚙️ Built With
Frontend
- React
- TypeScript
- Tailwind CSS
Backend
- Python
- FastAPI
Data & Machine Learning
- Pandas
- NumPy
- Scikit-learn
Visualization
- Interactive charts
- Environmental indicators
- Risk visualization
- Data-driven dashboard components
🏗️ Architecture
                 ┌──────────────────────┐
                 │ Environmental Data   │
                 │ CSV / Demo Dataset   │
                 └──────────┬───────────┘
                            ↓
                 ┌──────────────────────┐
                 │ Data Processing      │
                 │ Pandas + NumPy       │
                 └──────────┬───────────┘
                            ↓
                 ┌──────────────────────┐
                 │ ML / Risk Engine     │
                 │ Scikit-learn         │
                 └──────────┬───────────┘
                            ↓
              ┌─────────────┴─────────────┐
              ↓                           ↓
       Anomaly Detection           Risk Analysis
              │                           │
              └─────────────┬─────────────┘
                            ↓
                 ┌──────────────────────┐
                 │ FastAPI Backend      │
                 └──────────┬───────────┘
                            ↓
                 ┌──────────────────────┐
                 │ React Dashboard      │
                 │ EcoLens AI           │
                 └──────────────────────┘
🌱 Why It Matters
Environmental technology doesn't always need to begin with massive infrastructure.
Sometimes the first step is making existing information easier to understand.
EcoLens AI explores how AI can help transform:
Raw environmental measurements
into
Environmental intelligence
and ultimately into
better-informed human decisions.
Potential users include:
- Communities
- Environmental organizations
- Students
- Researchers
- Citizen scientists
- Schools
- NGOs
- Environmental monitoring teams
🌎 Earth Forward
EcoLens AI was built specifically around the Earth Forward challenge.
The project connects technology with environmental awareness through:
🌳 Environmental Monitoring
Bringing multiple environmental signals into one interface.
🤖 Artificial Intelligence
Using machine learning and statistical techniques to identify unusual patterns.
📊 Data Accessibility
Turning complex environmental measurements into understandable visual information.
🔍 Early Awareness
Helping users recognize environmental changes that deserve attention.
♻️ Sustainable Decision-Making
Providing information that can support more informed environmental conversations and decisions.
🧪 What We Learned
Building EcoLens AI pushed us to think beyond simply training a machine-learning model.
We learned that an environmental AI product needs three things to work together:
Good Data + Useful Intelligence + Clear Communication
A technically sophisticated model is not enough if the result cannot be understood.
Similarly, a beautiful dashboard is not enough if it doesn't provide meaningful analysis.
The project therefore became an exercise in connecting:
Data Engineering → Machine Learning → Explainability → Product Design
🛠️ Challenges
One of the biggest challenges was deciding how to combine different environmental indicators into a single understandable risk representation.
Environmental measurements have different scales and meanings, so they cannot simply be added together.
We addressed this by normalizing indicators and designing a transparent prototype risk methodology.
Another challenge was balancing technical ambition with hackathon time constraints.
Instead of building a massive production system, we focused on creating a complete end-to-end experience that demonstrates the core concept:
DATA
 ↓
ANALYSIS
 ↓
ANOMALY
 ↓
RISK
 ↓
EXPLANATION
 ↓
INSIGHT
🚀 Future Scope
EcoLens AI is currently a prototype.
Future versions could incorporate:
- Real-time IoT environmental sensors
- Satellite imagery
- Live air-quality feeds
- Weather data
- Water-quality sensors
- Biodiversity observations
- Advanced time-series models
- Geospatial environmental mapping
- Community environmental reporting
- Automated environmental alerts
- Larger historical datasets
The long-term vision is to evolve EcoLens AI from a prototype dashboard into a broader environmental intelligence platform.
⚠️ Limitations
EcoLens AI is a hackathon prototype.
The Environmental Risk Score is an experimental visualization and not an official environmental standard, emergency warning, medical recommendation, or scientifically validated disaster prediction system.
The accuracy of insights depends on the quality, completeness, and representativeness of the underlying data.
🎯 The Core Idea
Environmental data shouldn't just exist.
It should be understandable.
EcoLens AI turns environmental data into environmental intelligence.
Observe. Detect. Explain. Act.
🌍 EcoLens AI
See the environment differently.
Built With
- data
- fastapi
- machine-learning
- numpy
- pandas
- python
- react
- scikit-learn
- tailwind-css
- typescript
- visualization

Log in or sign up for Devpost to join the conversation.