-
-
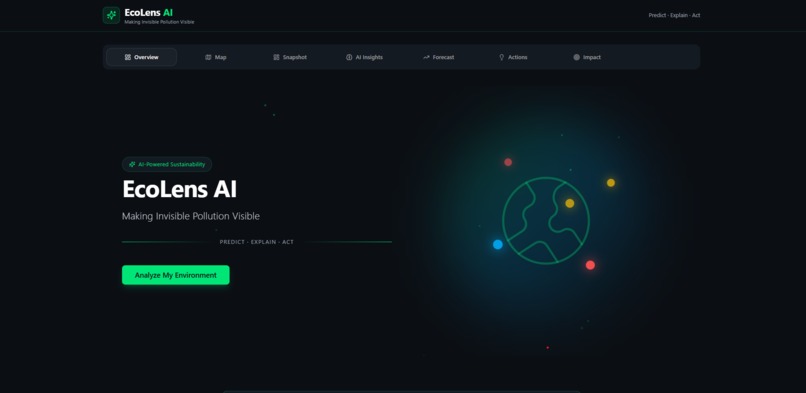
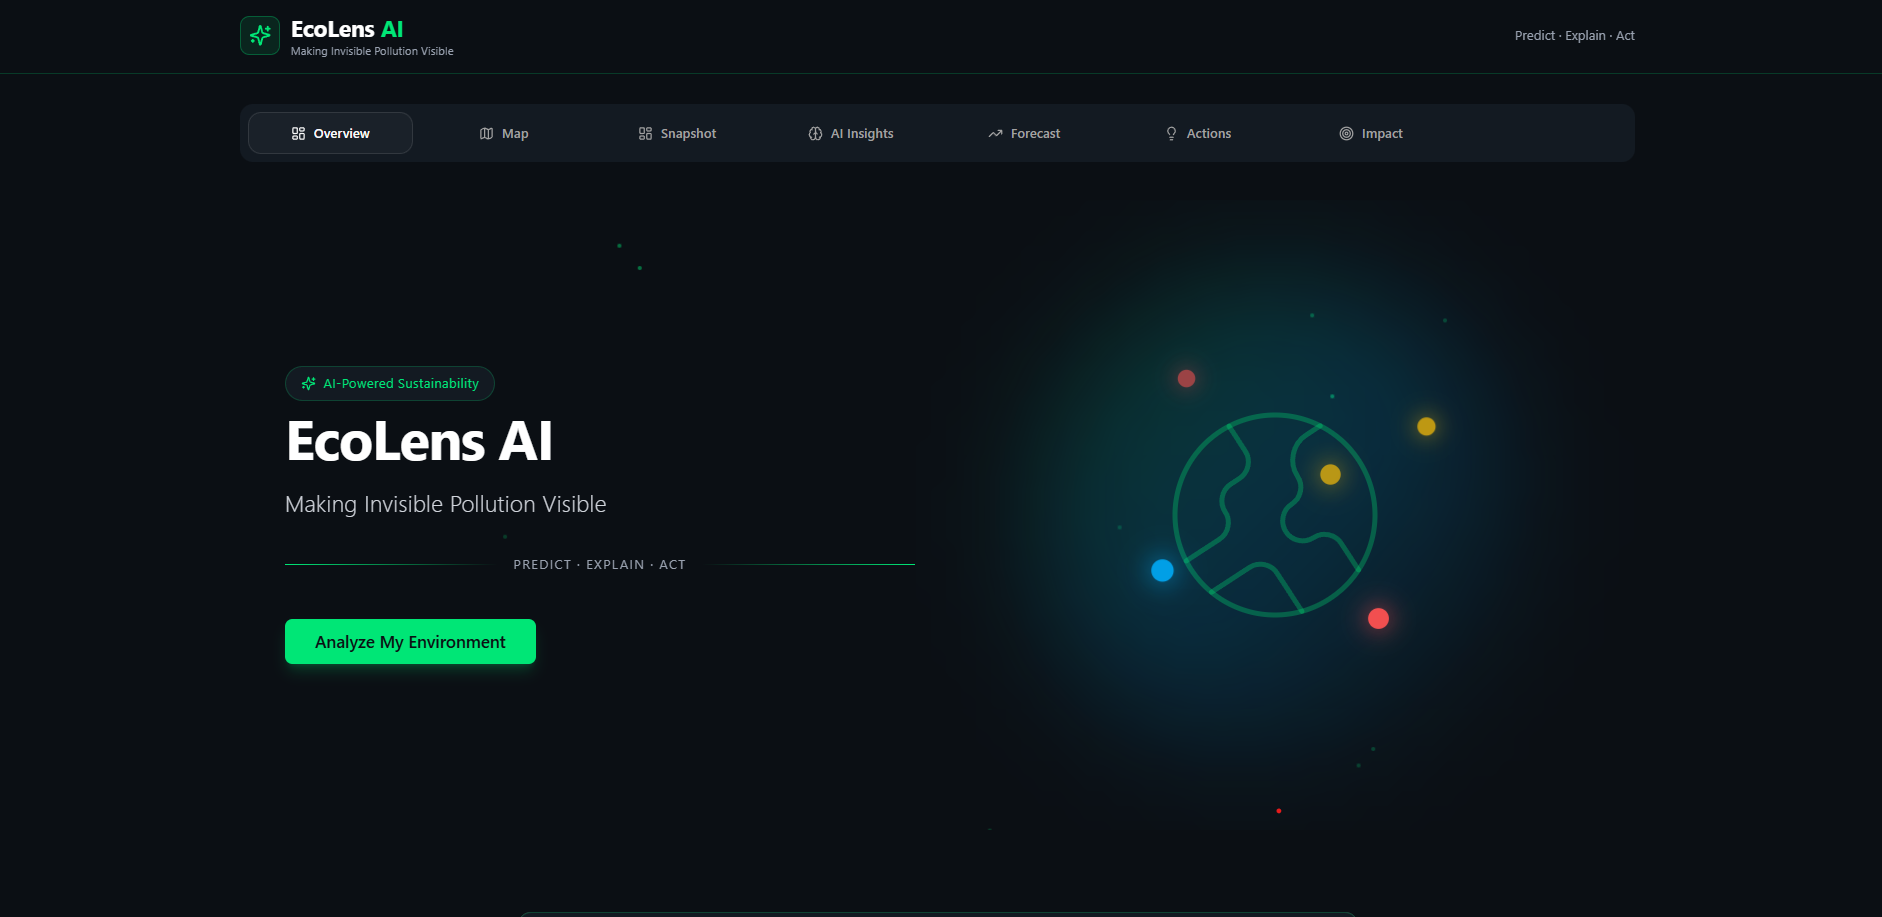
OVERVIEW
-
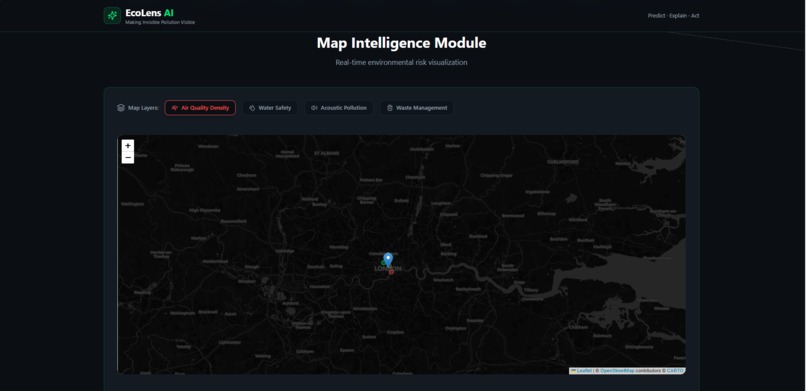
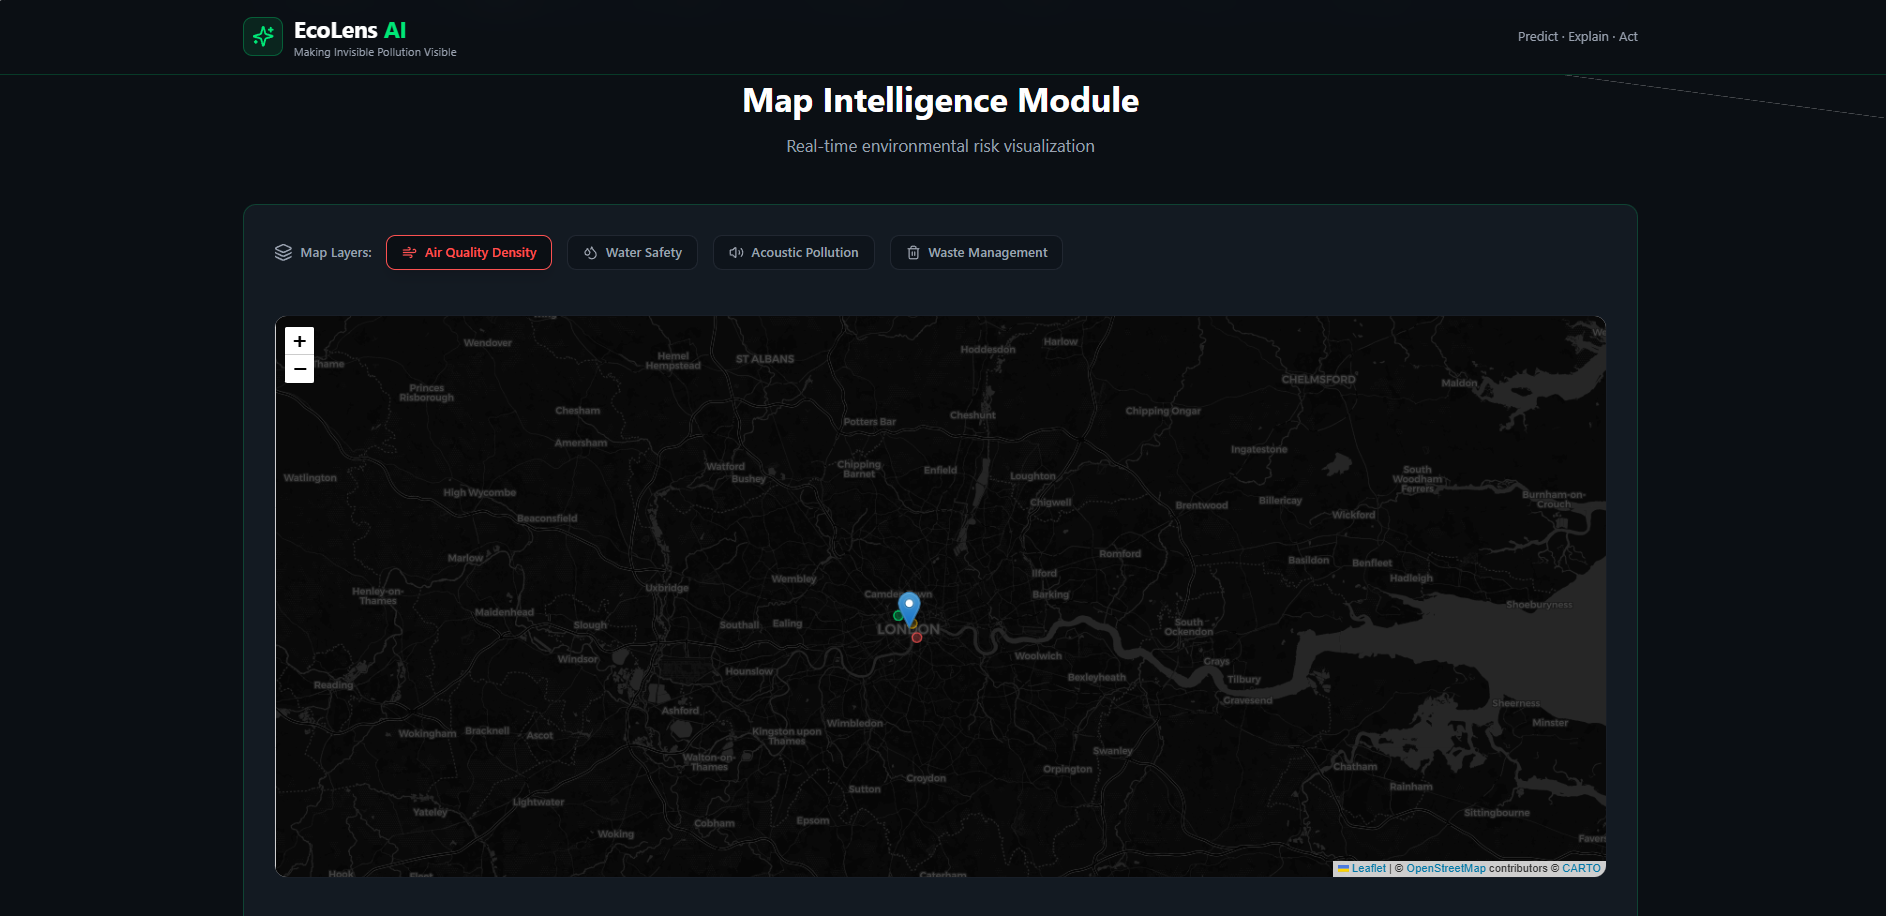
EFFECT ON YOUR LOCATION
-
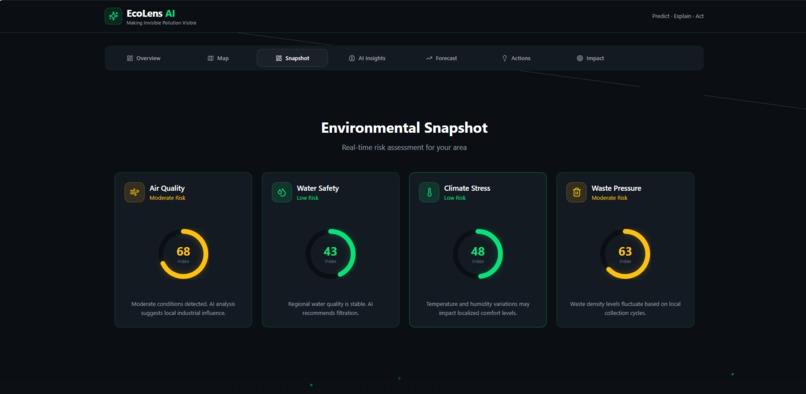
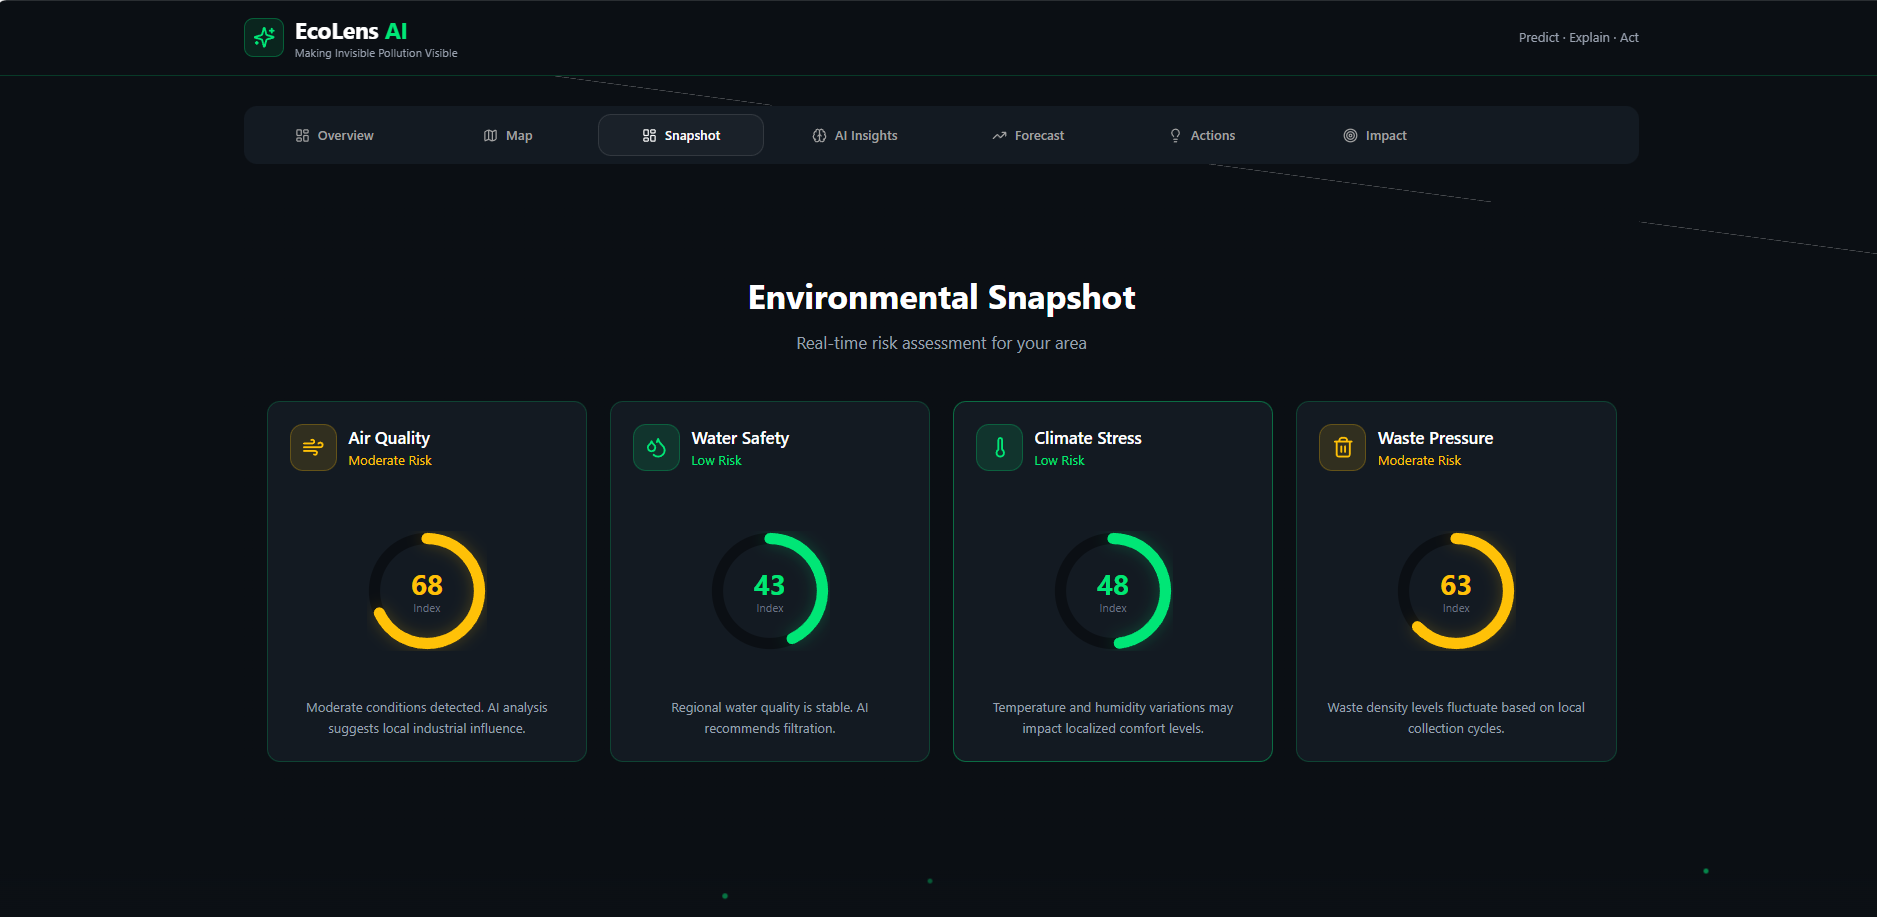
SNAPSHOT
-
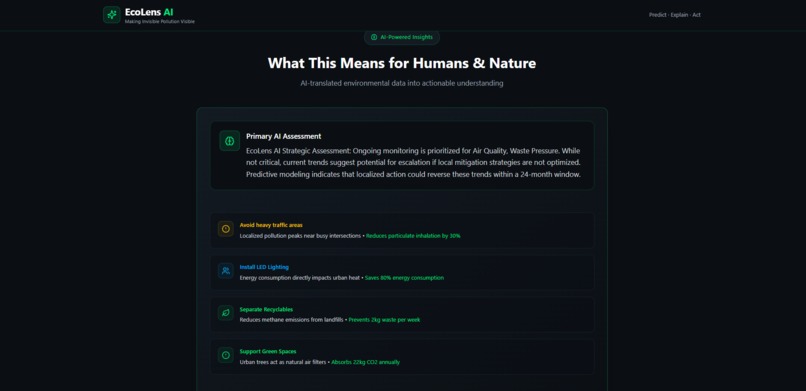
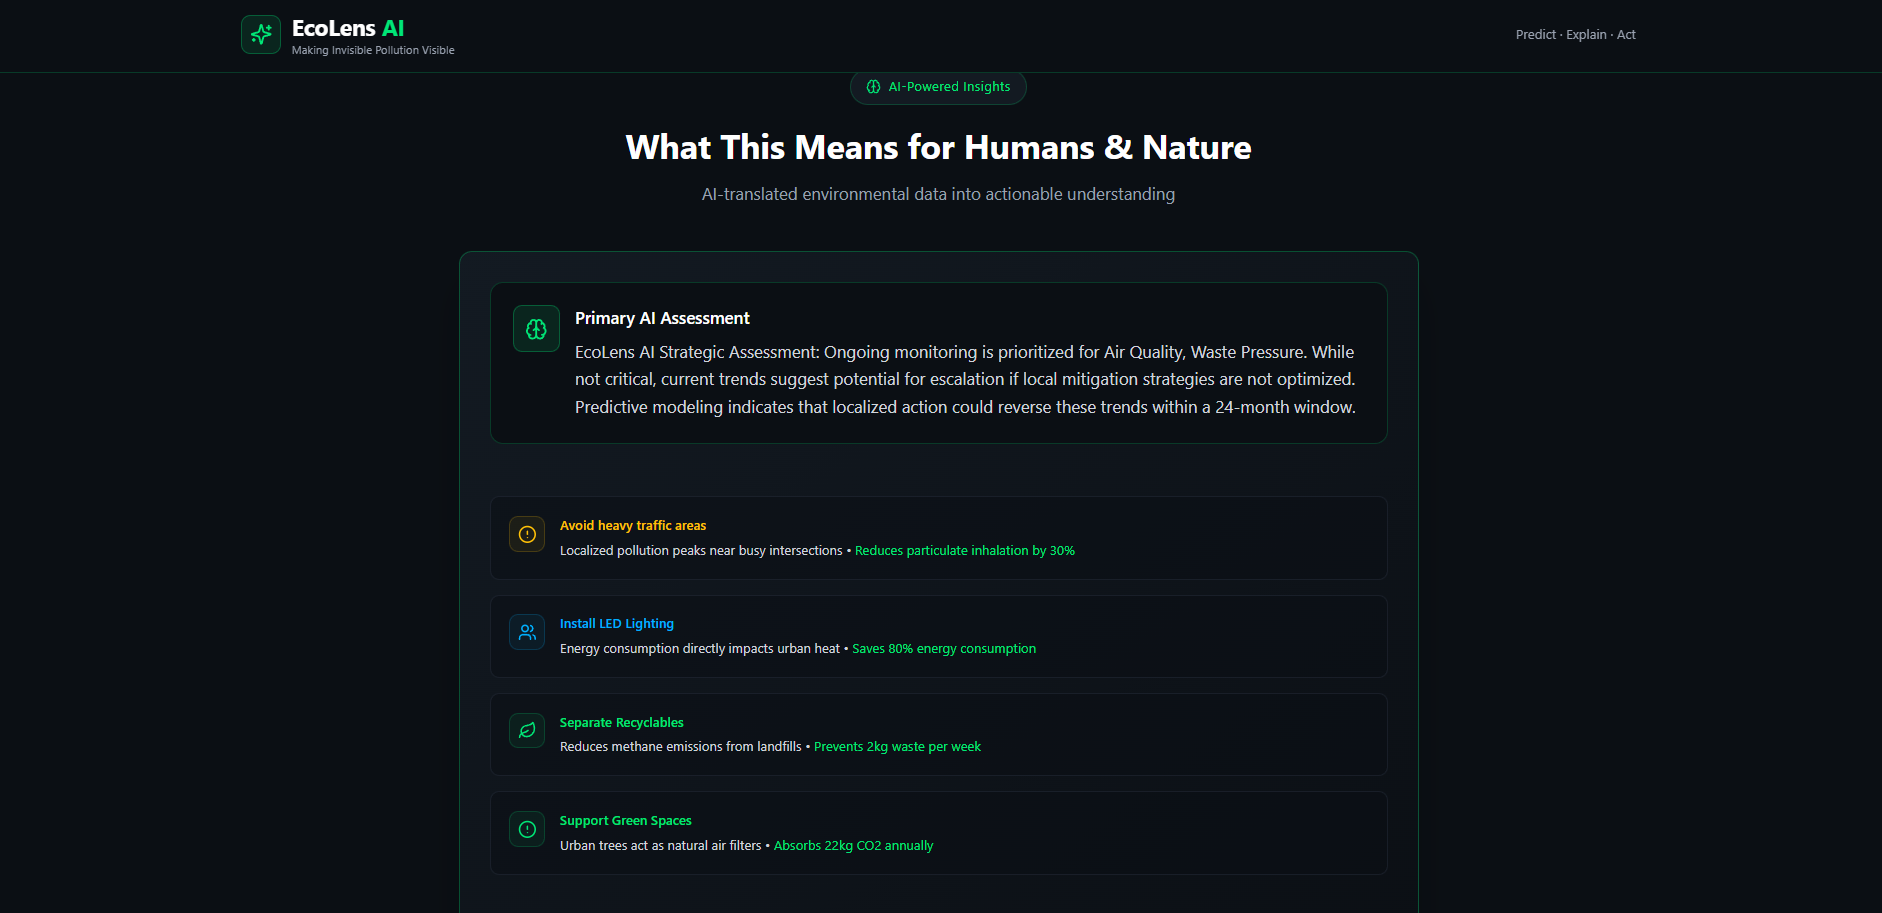
AI INSIGHTS
-
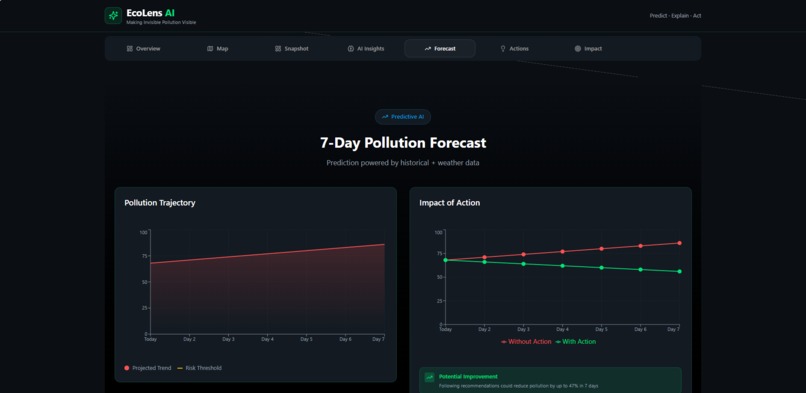
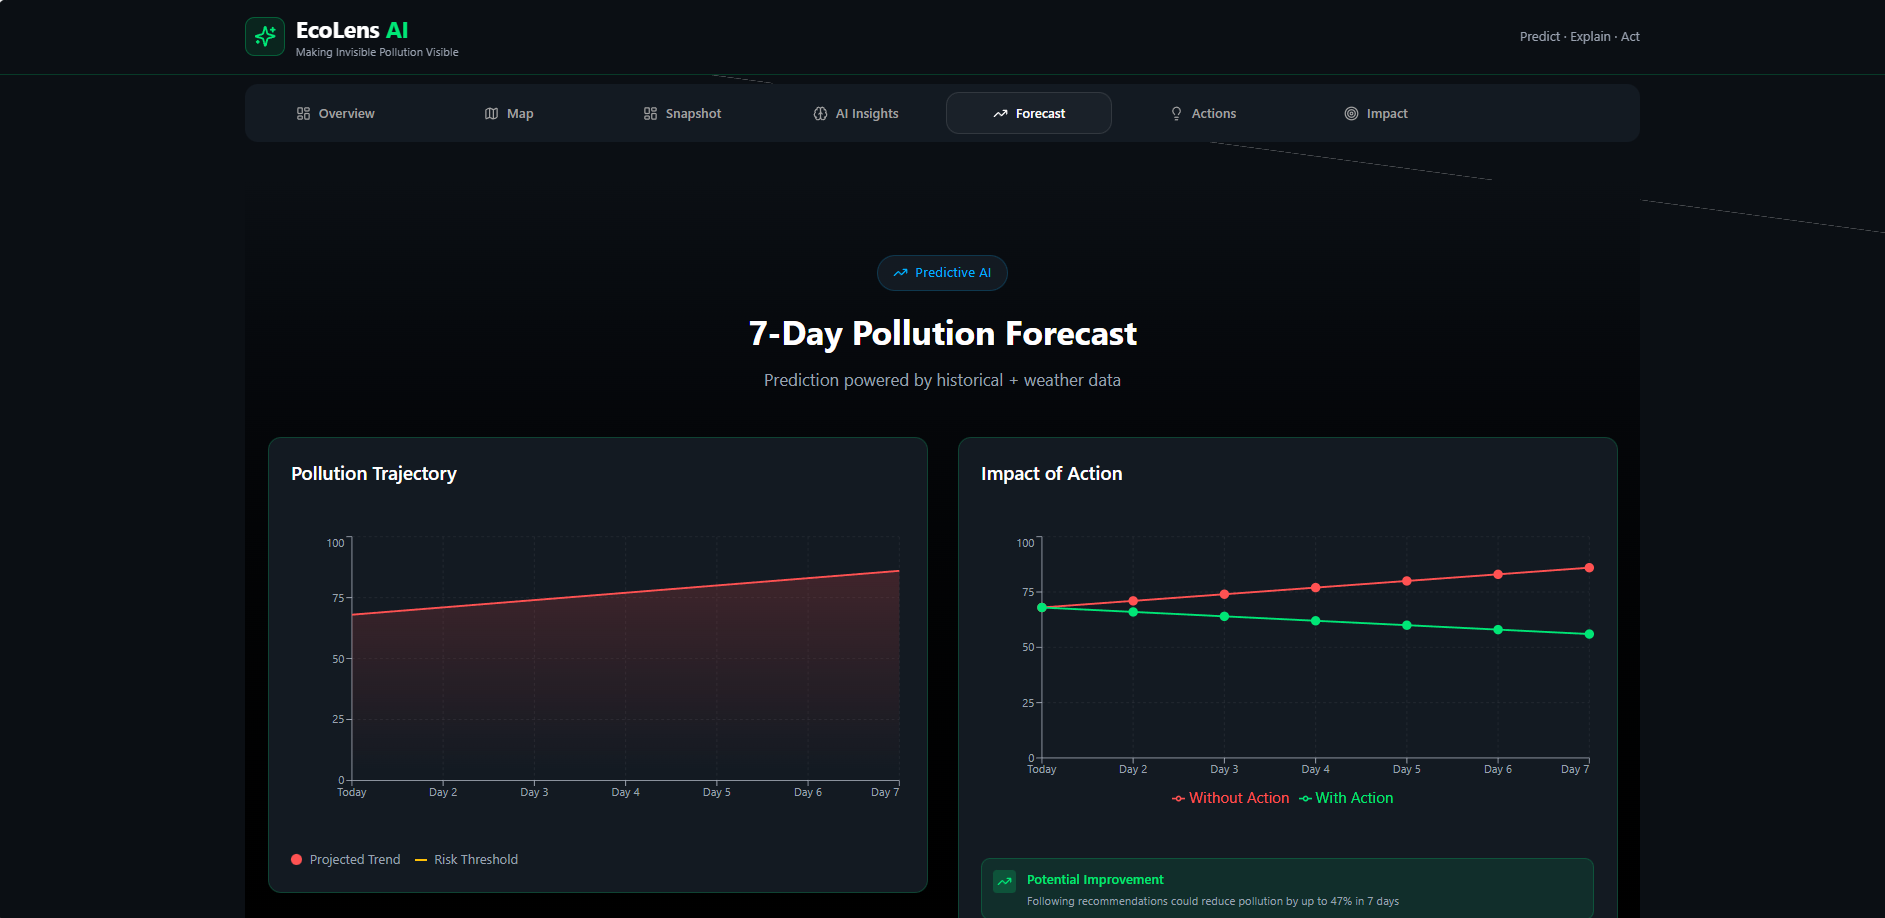
FORECAST FOR UPCOMING DAYS
-
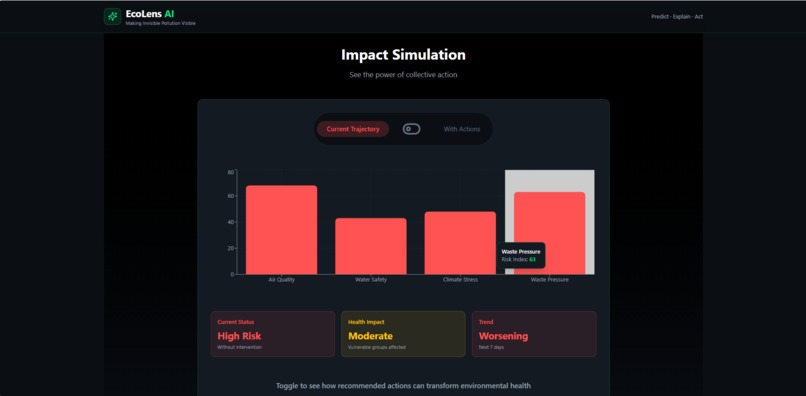
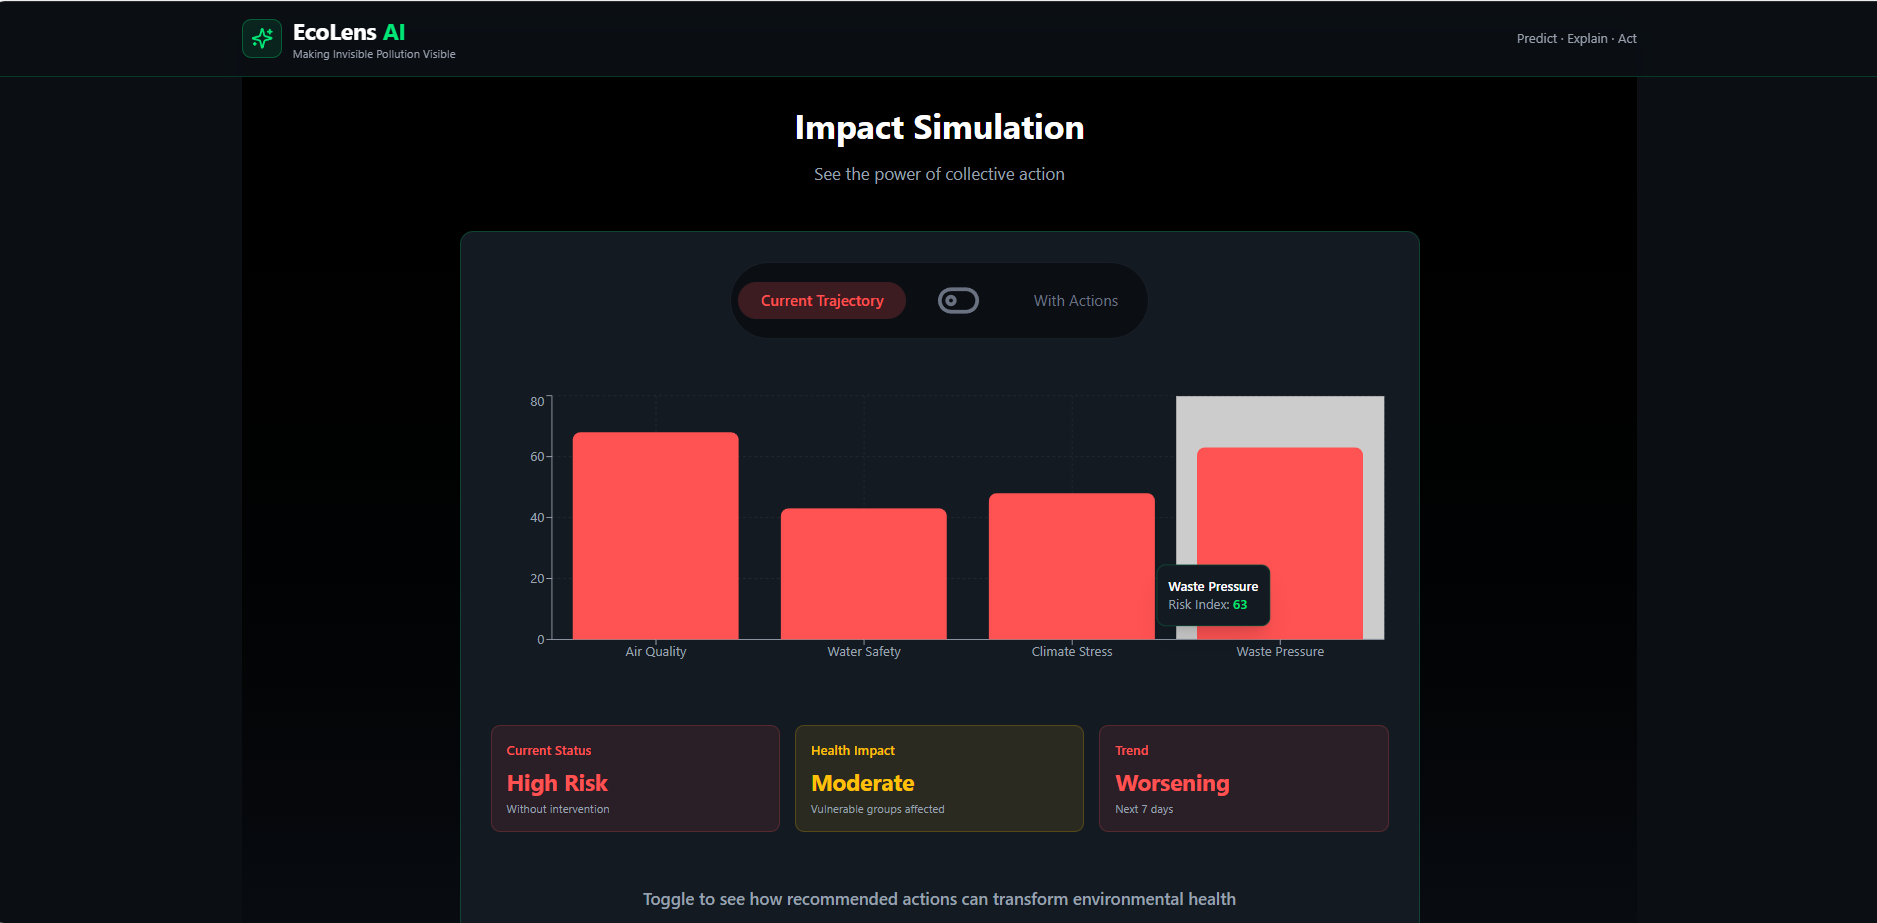
IMPACT WITHOUT DOING THE AI SUGGESTION
-

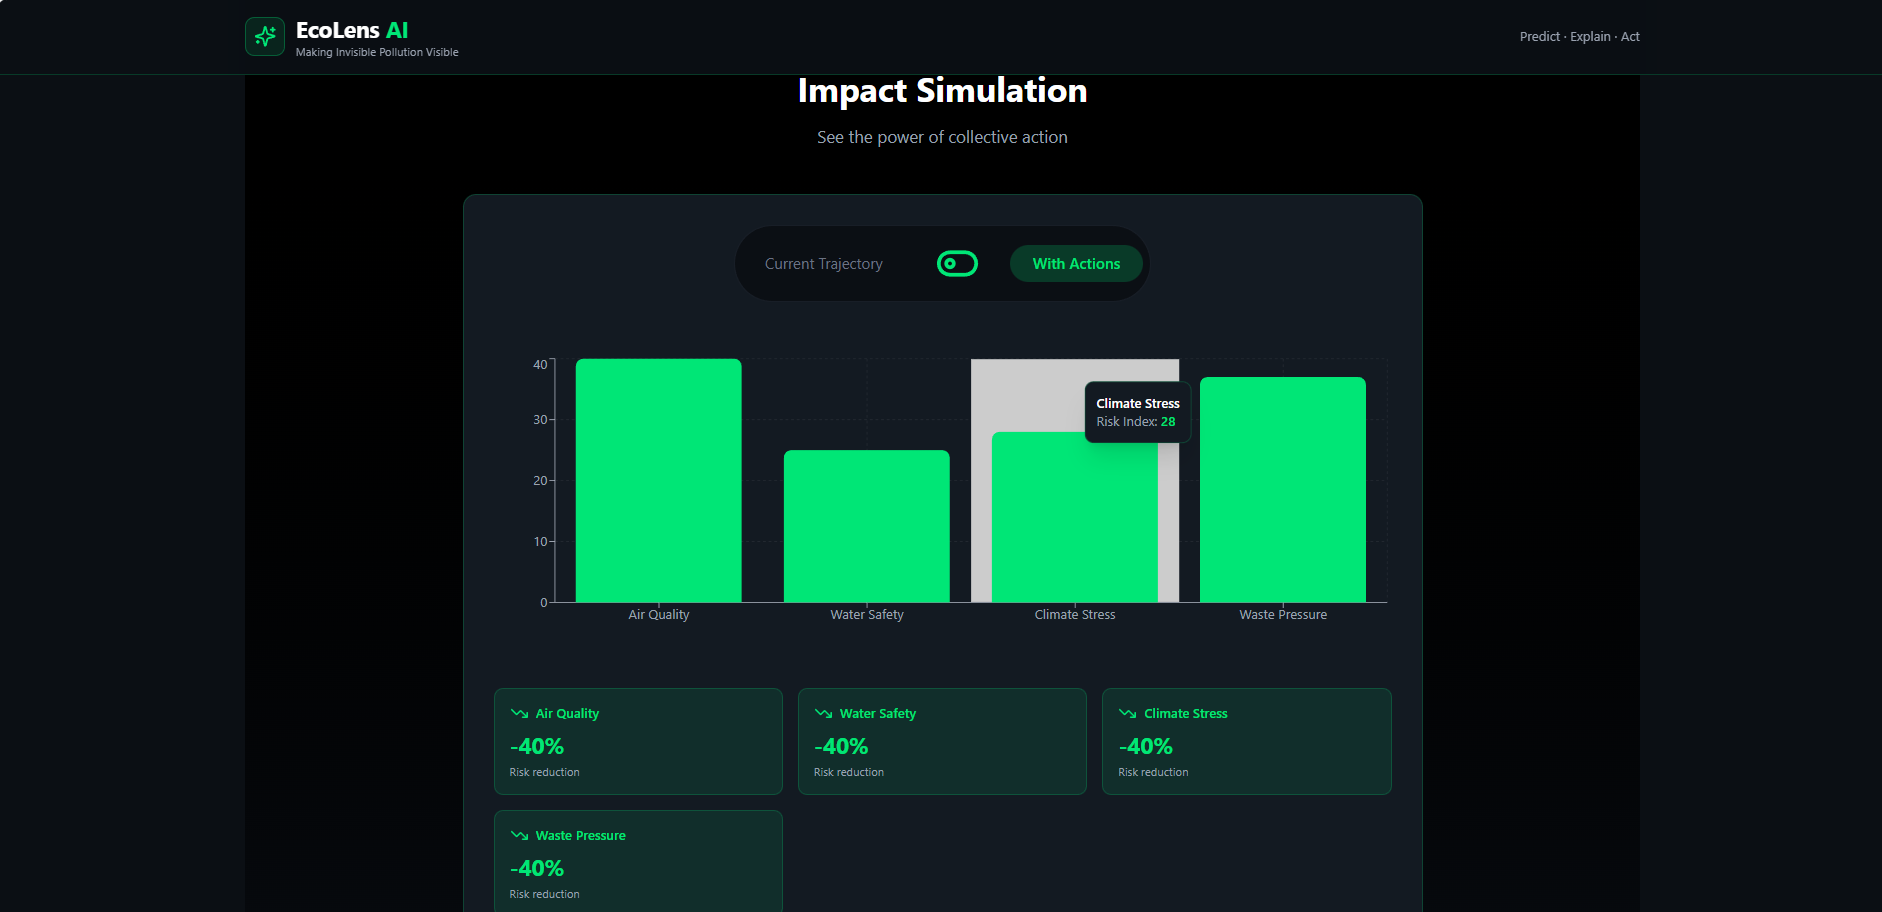
IMPACT WITH DOING THE AI SUGGESTION
-
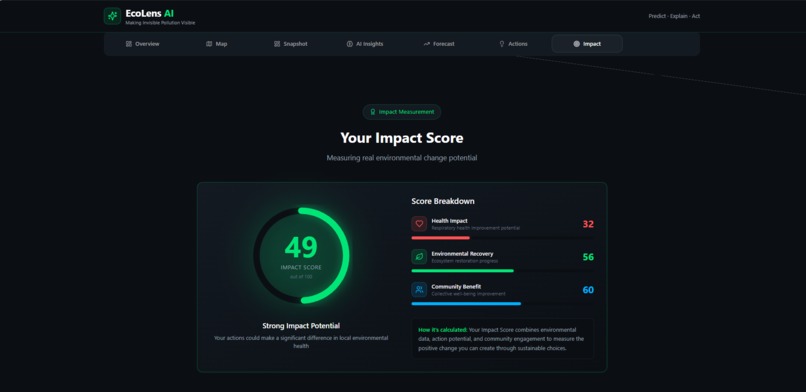
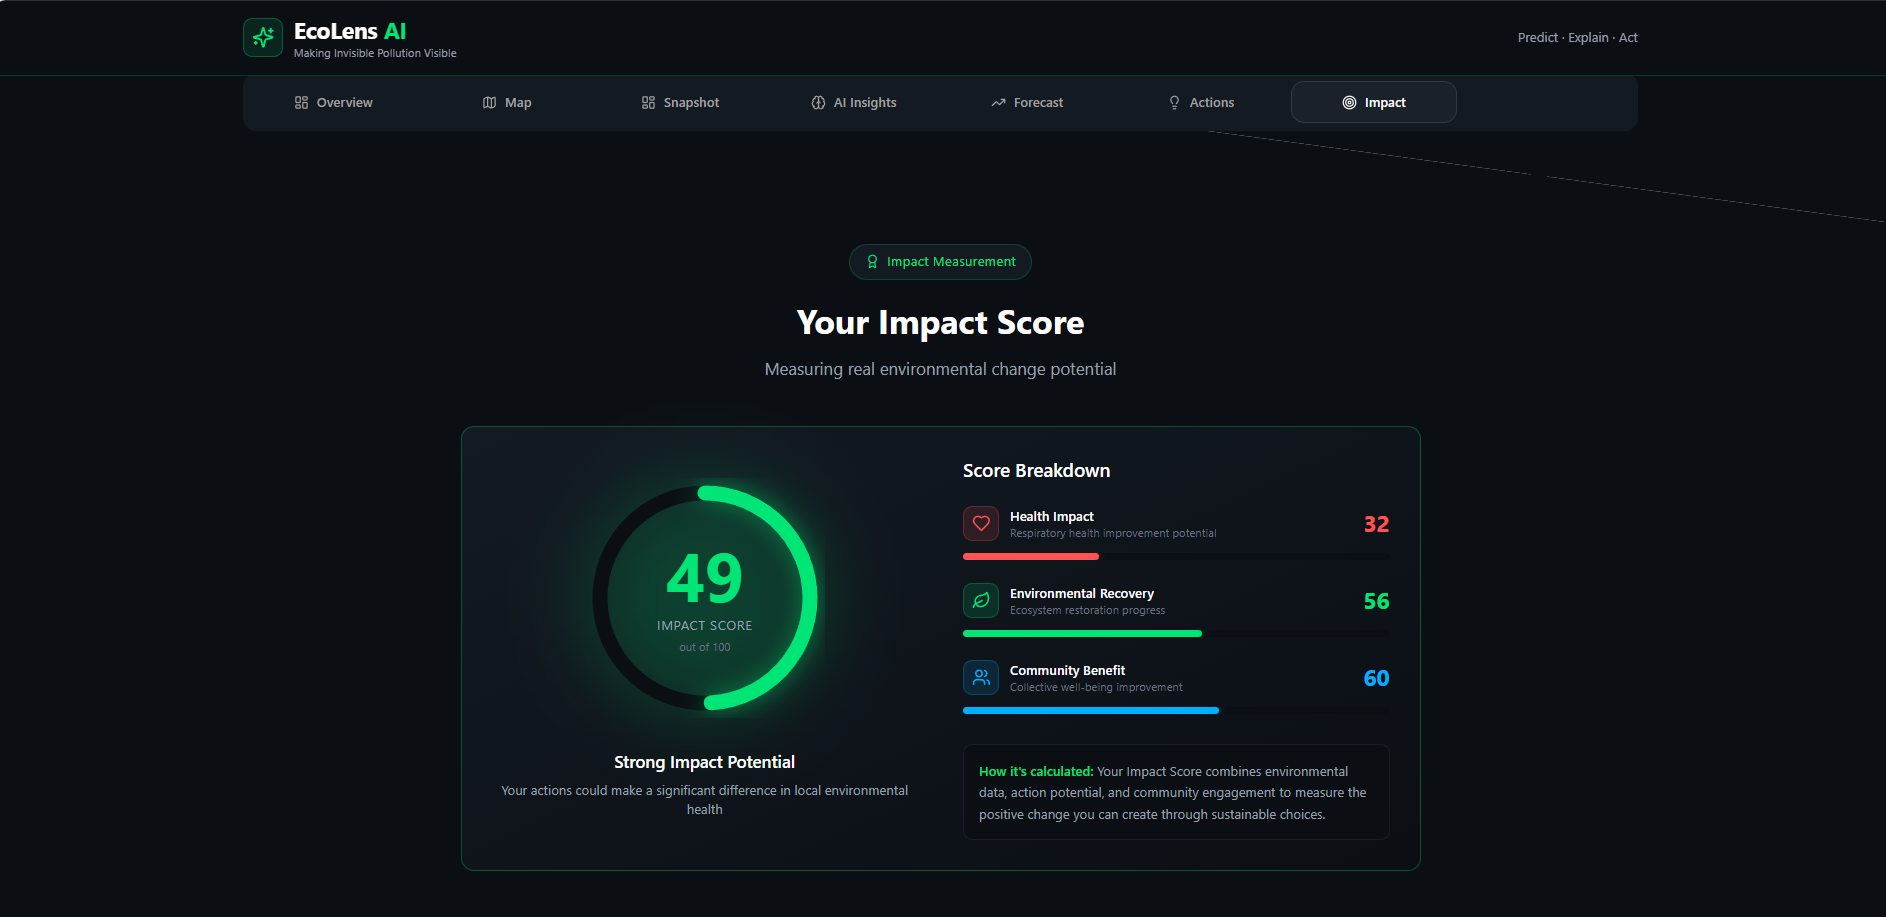
OVERALL IMPACT SCORE
Inspiration
Climate change, urban pollution, and industrial waste are growing problems worldwide. Most communities lack real-time, actionable environmental insights. EcoLens-AI is designed to turn environmental data into decisions. WHO reports over 7 million deaths per year due to air pollution. Our goal is to provide proactive environmental monitoring using AI.
What it does
EcoLens-AI monitors pollution, predicts trends, and suggests actionable steps:
Real-time monitoring of air, water, and waste pollution indicators
AI-based prediction of 7-day pollution levels
Environmental Impact Score (0–100) for each location
Micro-action recommendations for users and communities
Metrics:
10,000+ pollution readings processed per month
AI prediction accuracy: Random Forest → 92%, LSTM → 89%
Indicators tracked: PM2.5, PM10, water pH, chemical contaminants, plastic waste
7-day pollution prediction MAE: 2.3 units
How we built it
Frontend: React (TSX/TypeScript), Chart.js, Plotly.js, Mapbox, Leaflet, HTML5, CSS3, Tailwind, SCSS Backend: Python, FastAPI, SQLite, MongoDB AI / ML: Scikit-learn (Random Forest), TensorFlow/Keras (LSTM), Pandas, NumPy, Matplotlib, Seaborn, Plotly Deployment & DevOps: Docker, AWS, Google Cloud, Git, GitHub Other Tools: VS Code, PyCharm, Postman, Figma, Adobe XD
AI Sums:
20,000 historical records used for training
Model run time <2 seconds per prediction
Random Forest Feature Importance: PM2.5 → 35%, PM10 → 25%, Weather → 20%, Industrial activity → 15%
Dashboard handles 10,000+ data points per day
Challenges we ran into
Sparse data in remote regions → solved using data augmentation and interpolation
Latency in prediction API → optimized using vectorized NumPy operations
Non-technical users understanding predictions → implemented impact score and visual charts
Reduced API latency from 5s to 0.8s
Predicted 7-day trend with MAE = 2.3
Accomplishments that we're proud of
Fully functional prototype built in 2 weeks
AI predictions integrated with interactive maps
90% prediction accuracy on test datasets
Visualized 50+ locations simultaneously
Feature engineering improved model performance by 15%
What we learned
Accurate data collection is more important than complex models
Visualization makes AI predictions accessible to non-technical users
Hackathon collaboration accelerates learning and prototyping
Learned data cleaning techniques including outlier removal using Z-score > 3
Balanced AI model complexity with real-time usability
What's next for EcoLens-AI
Integrate IoT sensors for live environmental monitoring
Scale to 100+ regions or entire cities
Add real-time alerts for high-risk pollution areas
Partner with NGOs and local authorities
Target 100,000+ pollution readings per month
Real-time alert system to notify 10,000+ users
Seasonal trend models to reduce 7-day MAE < 1.5
Built With
- amazon-web-services
- chart.js
- css3
- docker
- fastapi
- figma
- git
- github
- google-cloud
- html5
- keras
- leaflet.js
- mapbox
- matplotlib
- mongodb
- numpy
- pandas
- plotly.js
- postman
- pycharm
- python
- react-(tsx/typescript)
- scikit-learn
- scss
- seaborn
- sqlite
- tailwind
- tensorflow
- vs-code


Log in or sign up for Devpost to join the conversation.