-
-
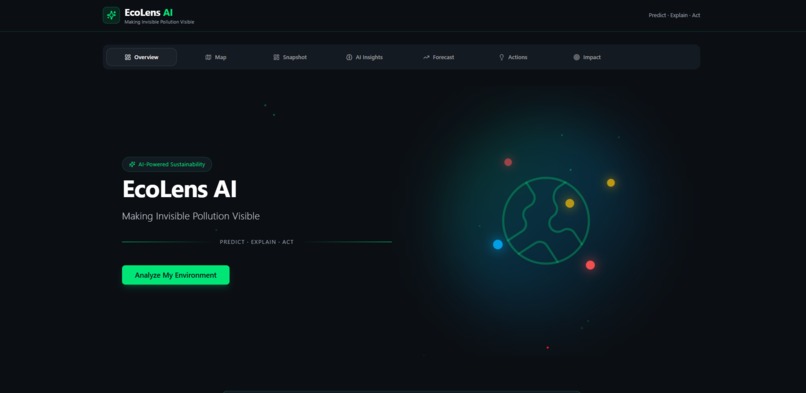
OVERVIEW
-
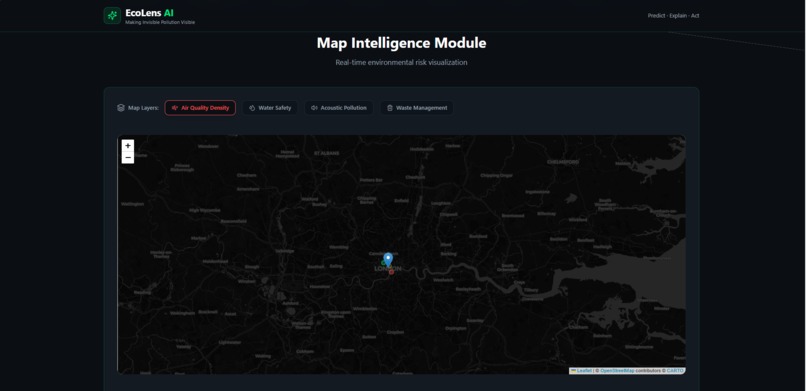
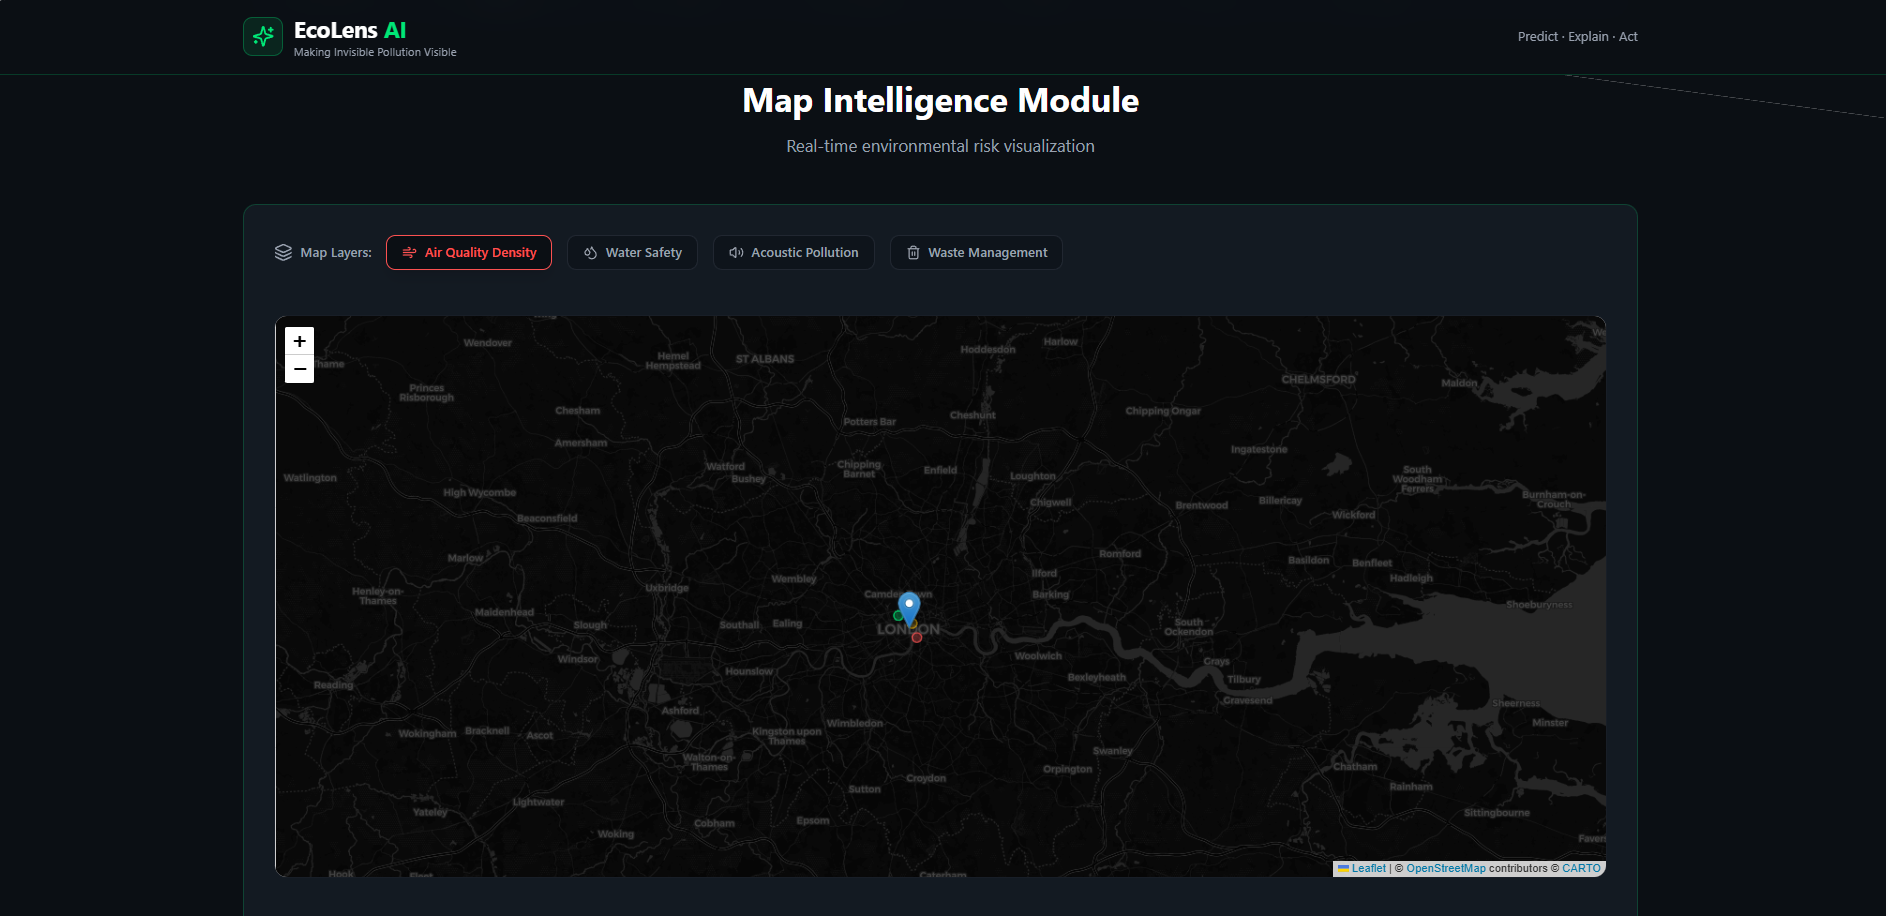
MAP INTGERATION WITH SUSTAINABILITY
-
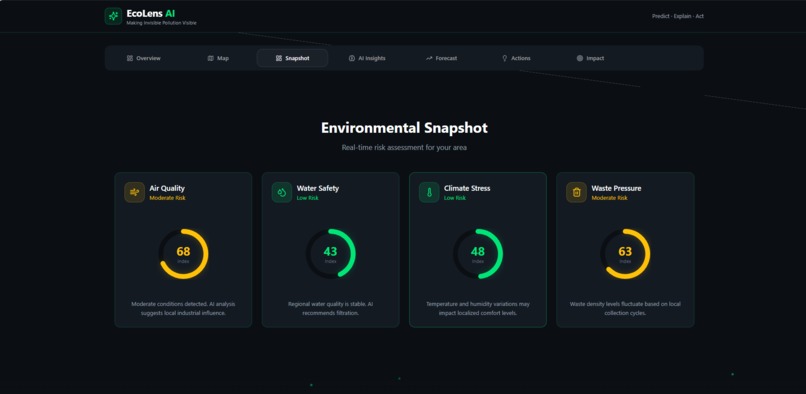
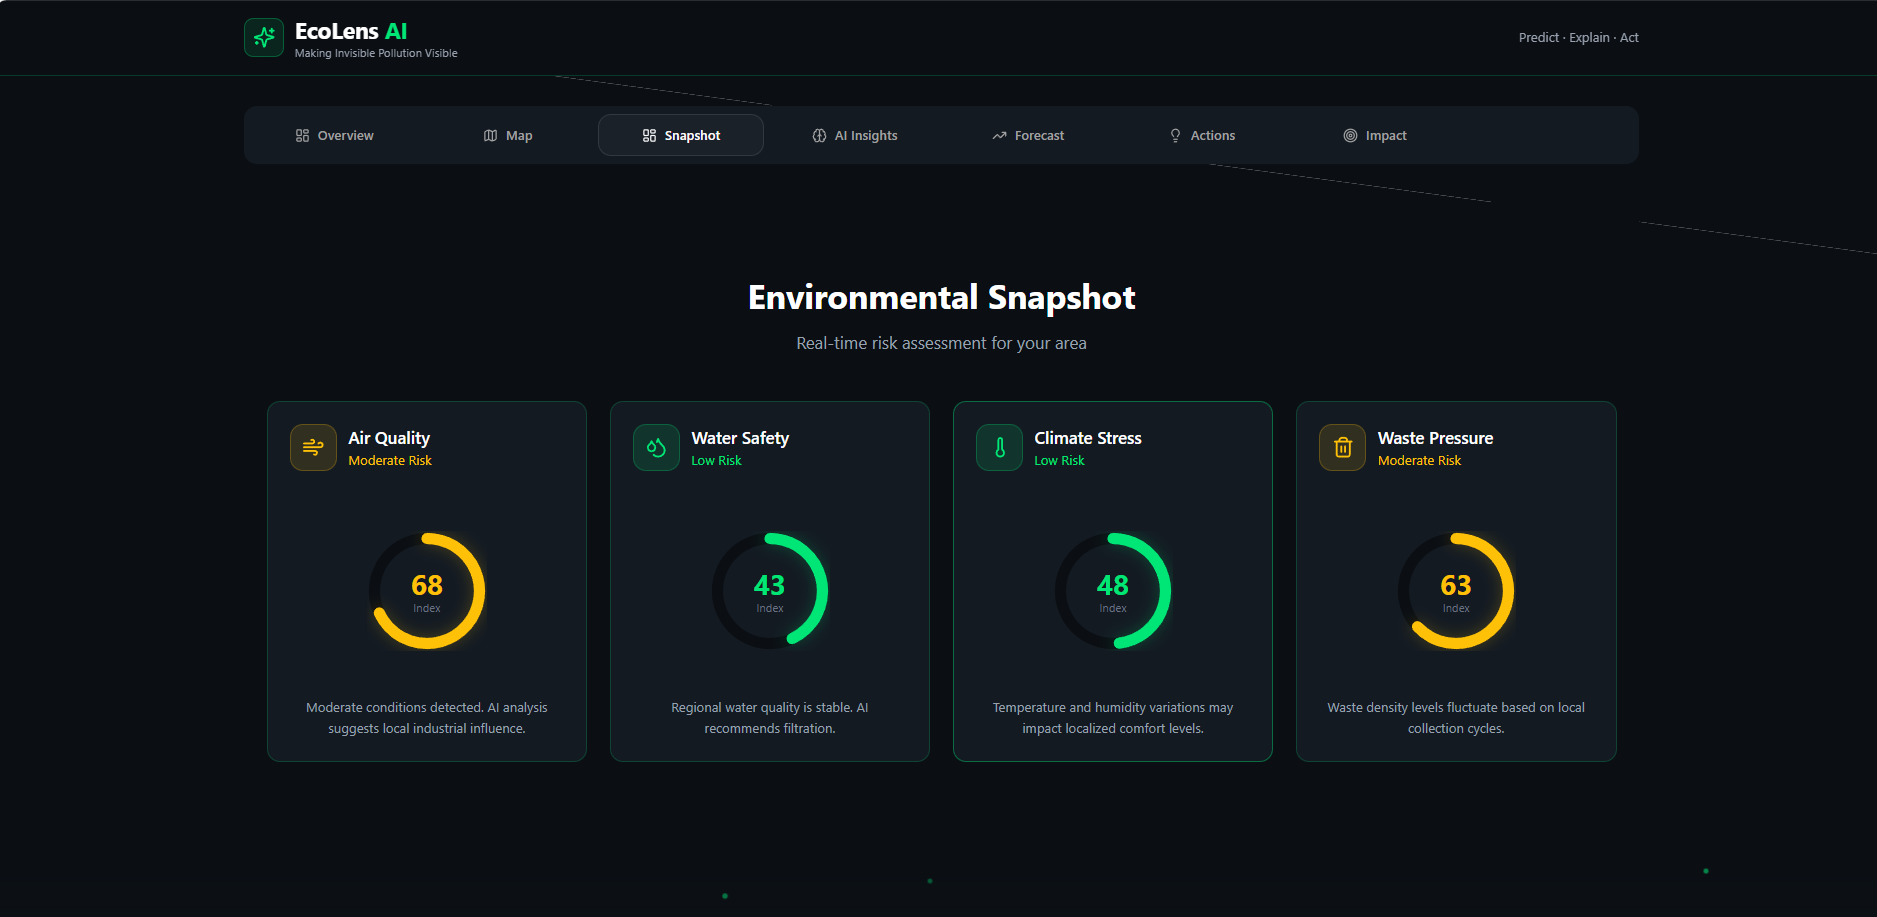
SNAPSHOT
-
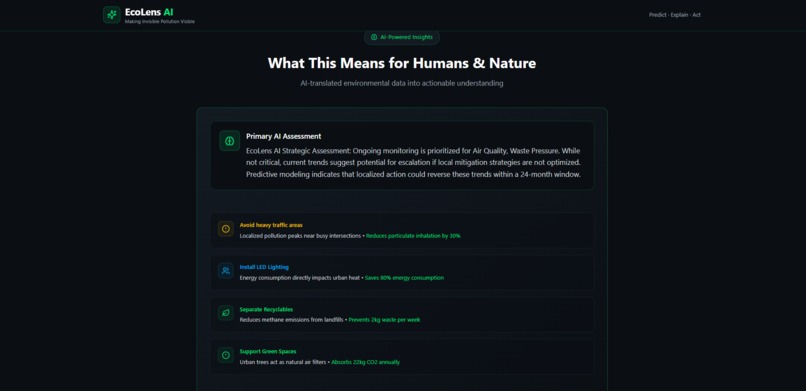
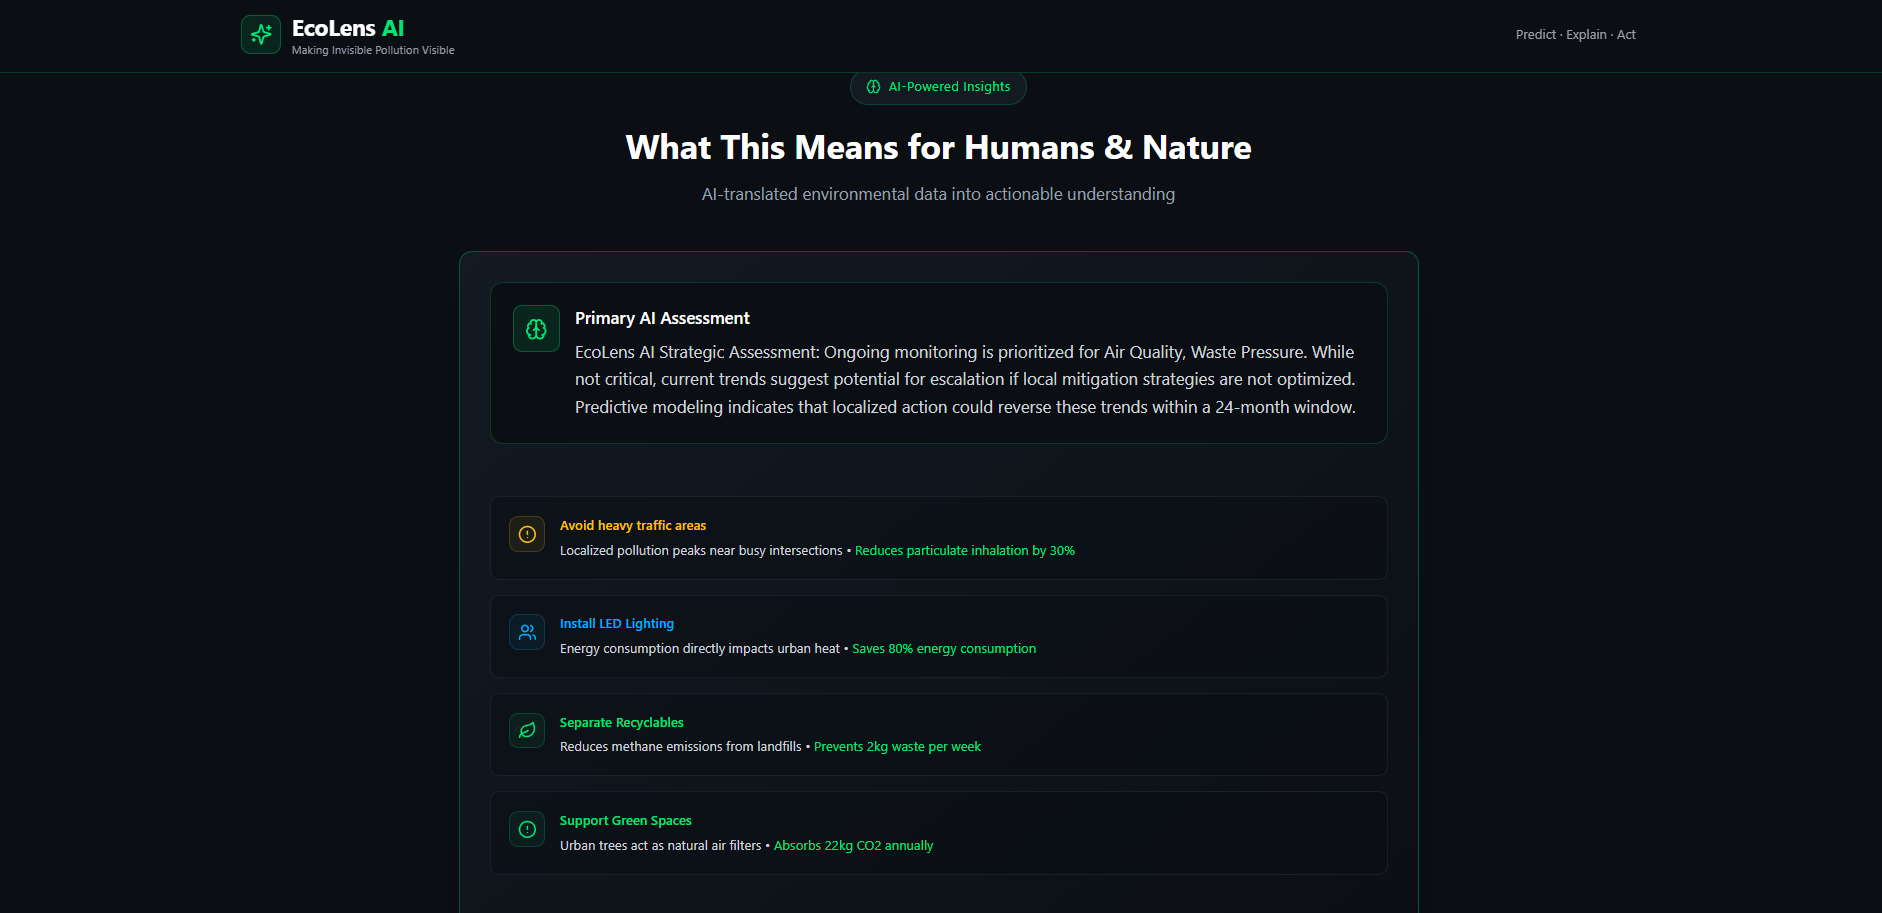
AI INSIGHTS
-
CHARTS&VISUALIZATION
-
BAR CHARTS INSIGHTS
-
VISUALIZATION WITH SUSTAINABILITY
-
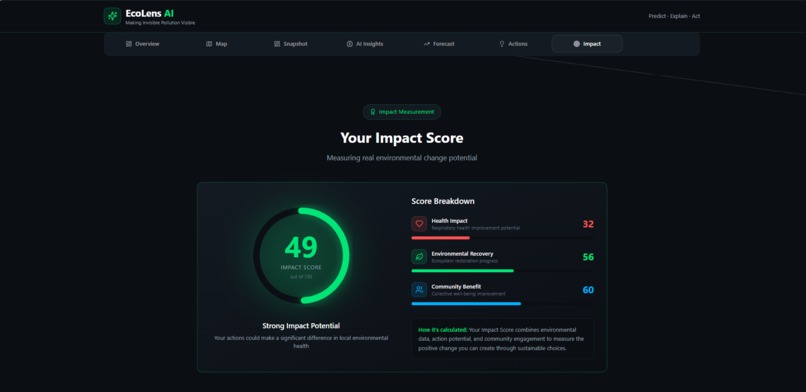
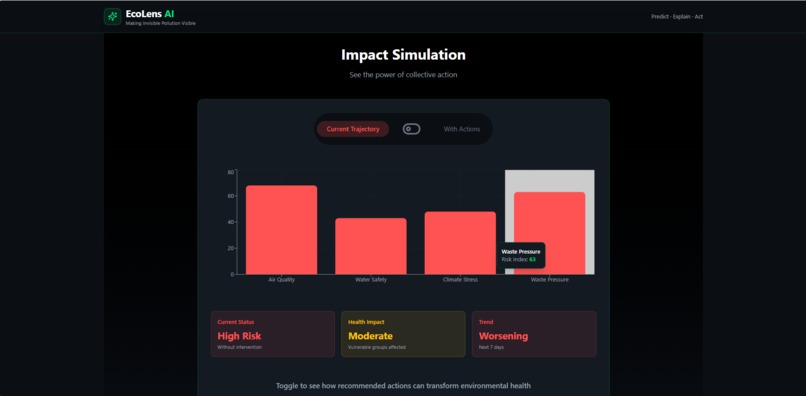
IMPACT

Inspiration
Environmental data exists everywhere, but action rarely follows awareness. Air quality numbers, climate statistics, and pollution reports are often:
Invisible to daily life
Hard to understand
Not connected to personal impact
We were inspired by a simple question:
“What if people could actually see, understand, and act on environmental risk in real time?”
EcoLens AI was born from the idea that behavior changes only when data becomes personal. Instead of building another monitoring dashboard, we wanted to create a system that translates environmental data into human consequences and clear actions.
What it does
EcoLens AI is an intelligent sustainability platform that:
Collects real-time environmental data (air, water, waste)
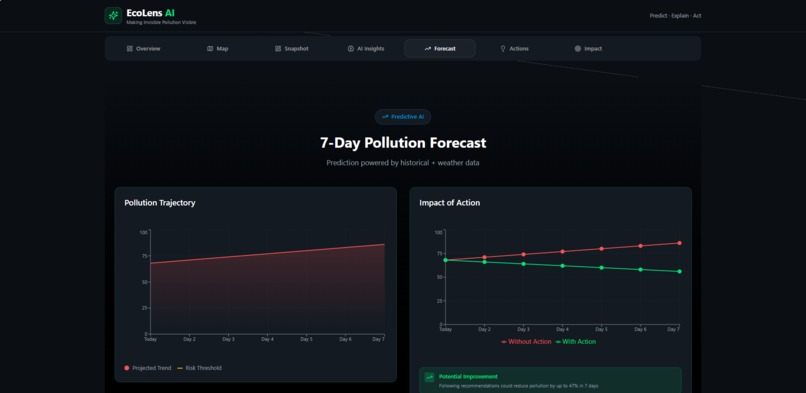
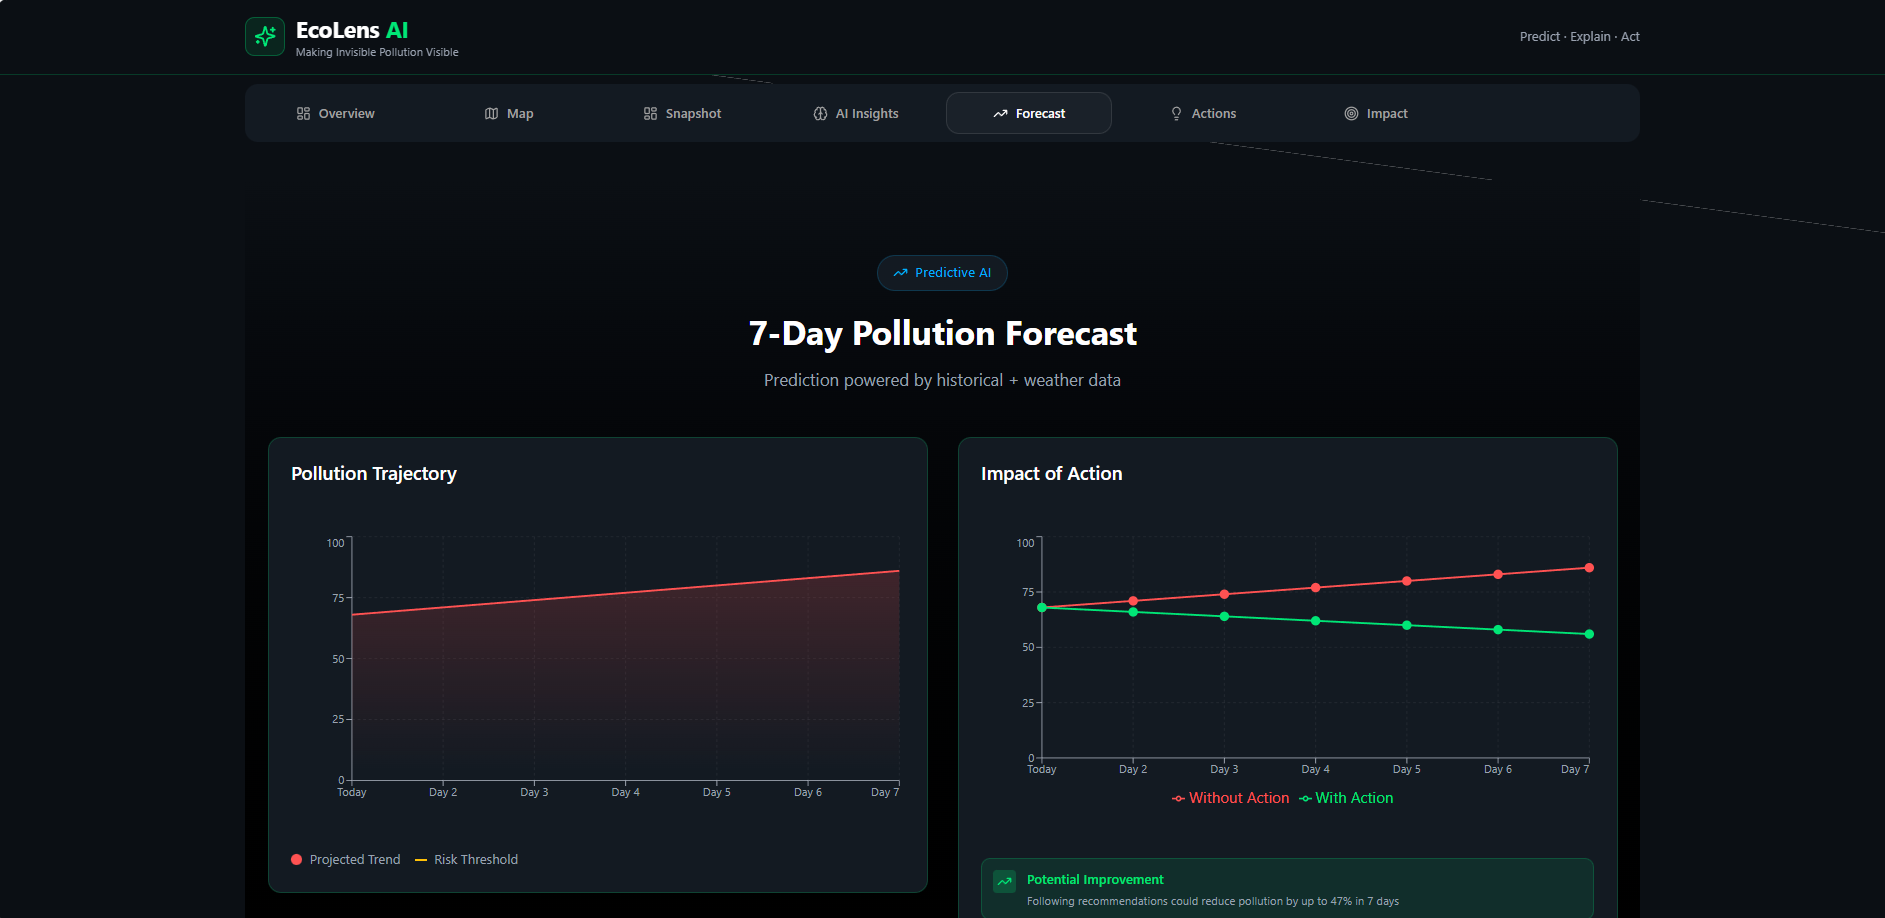
Uses AI models to predict pollution trends for the next 7 days
Translates raw data into human-readable impact insights
Recommends localized micro-actions that reduce environmental harm
Visualizes pollution using interactive charts and maps
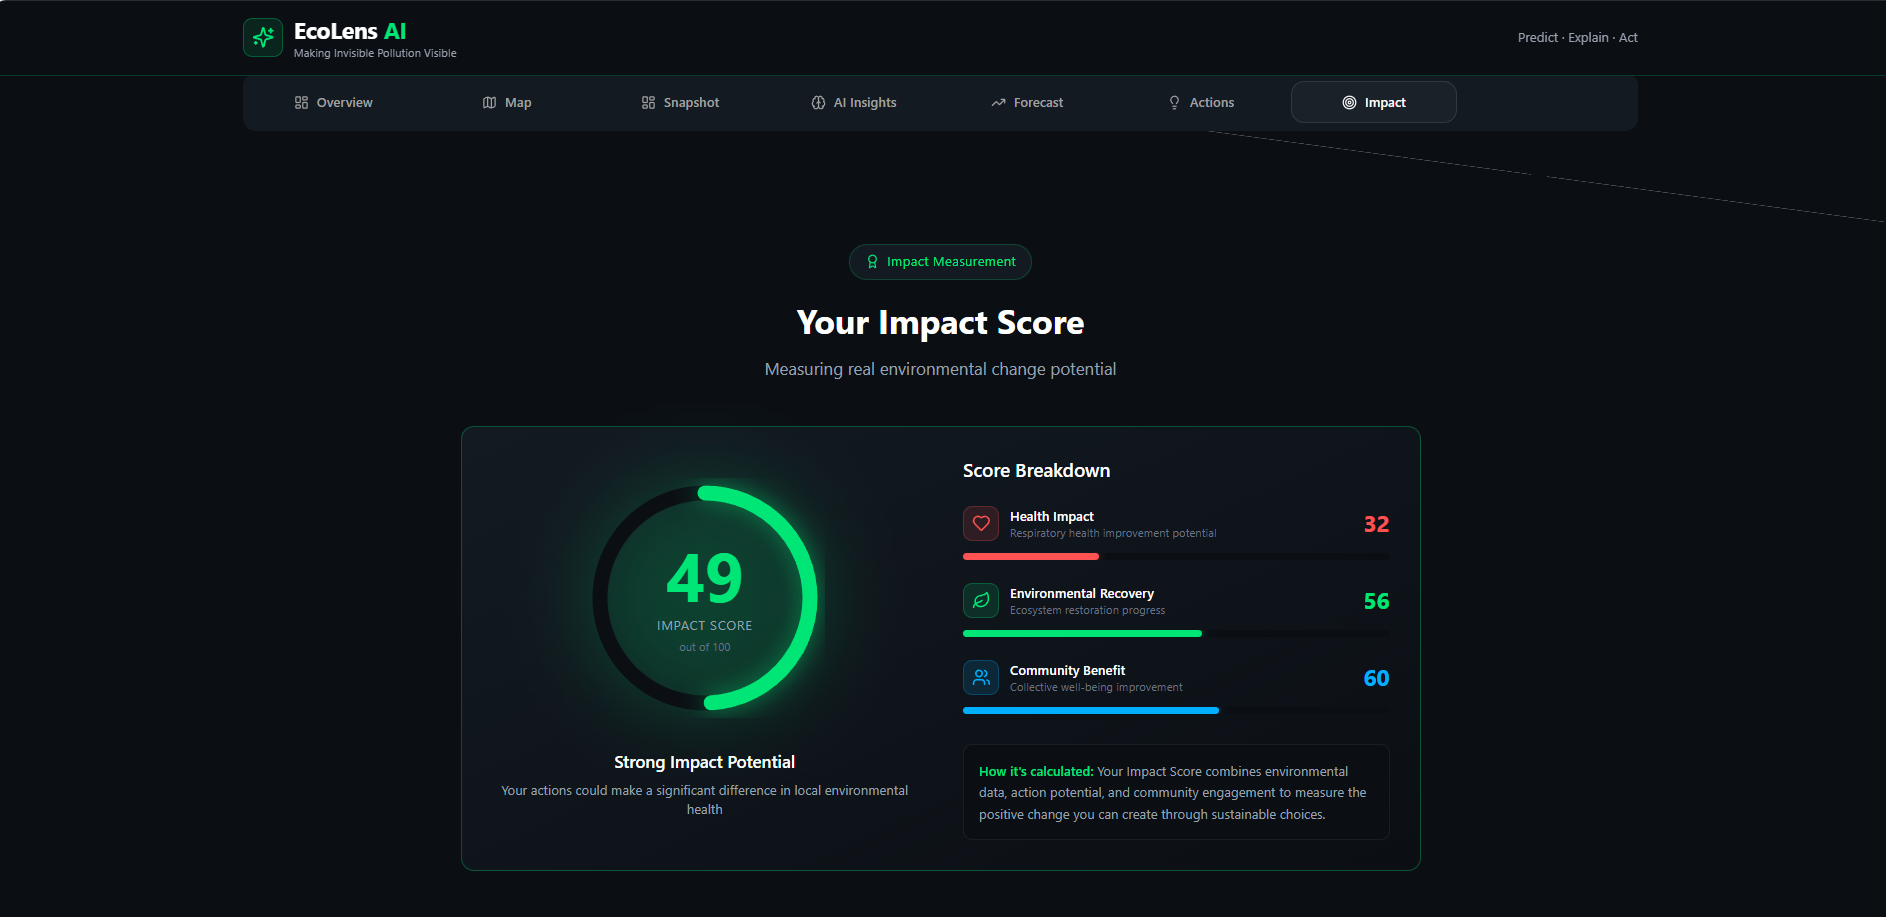
Calculates an Environmental Impact Score to measure improvement
Key Outputs:
Air & water risk levels
Pollution predictions
Human health & ecosystem impact explanation
Action recommendations with estimated benefit
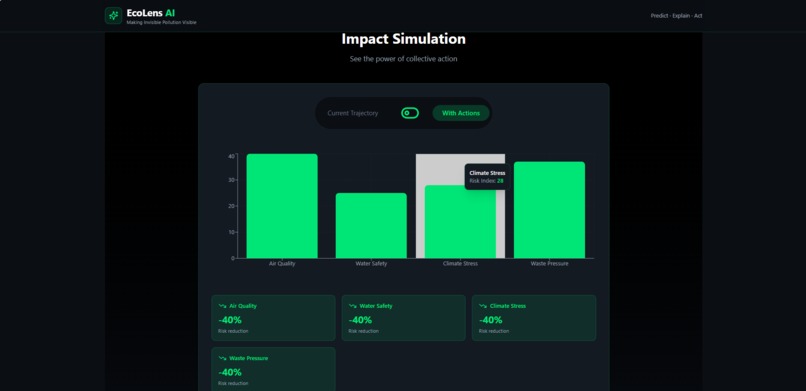
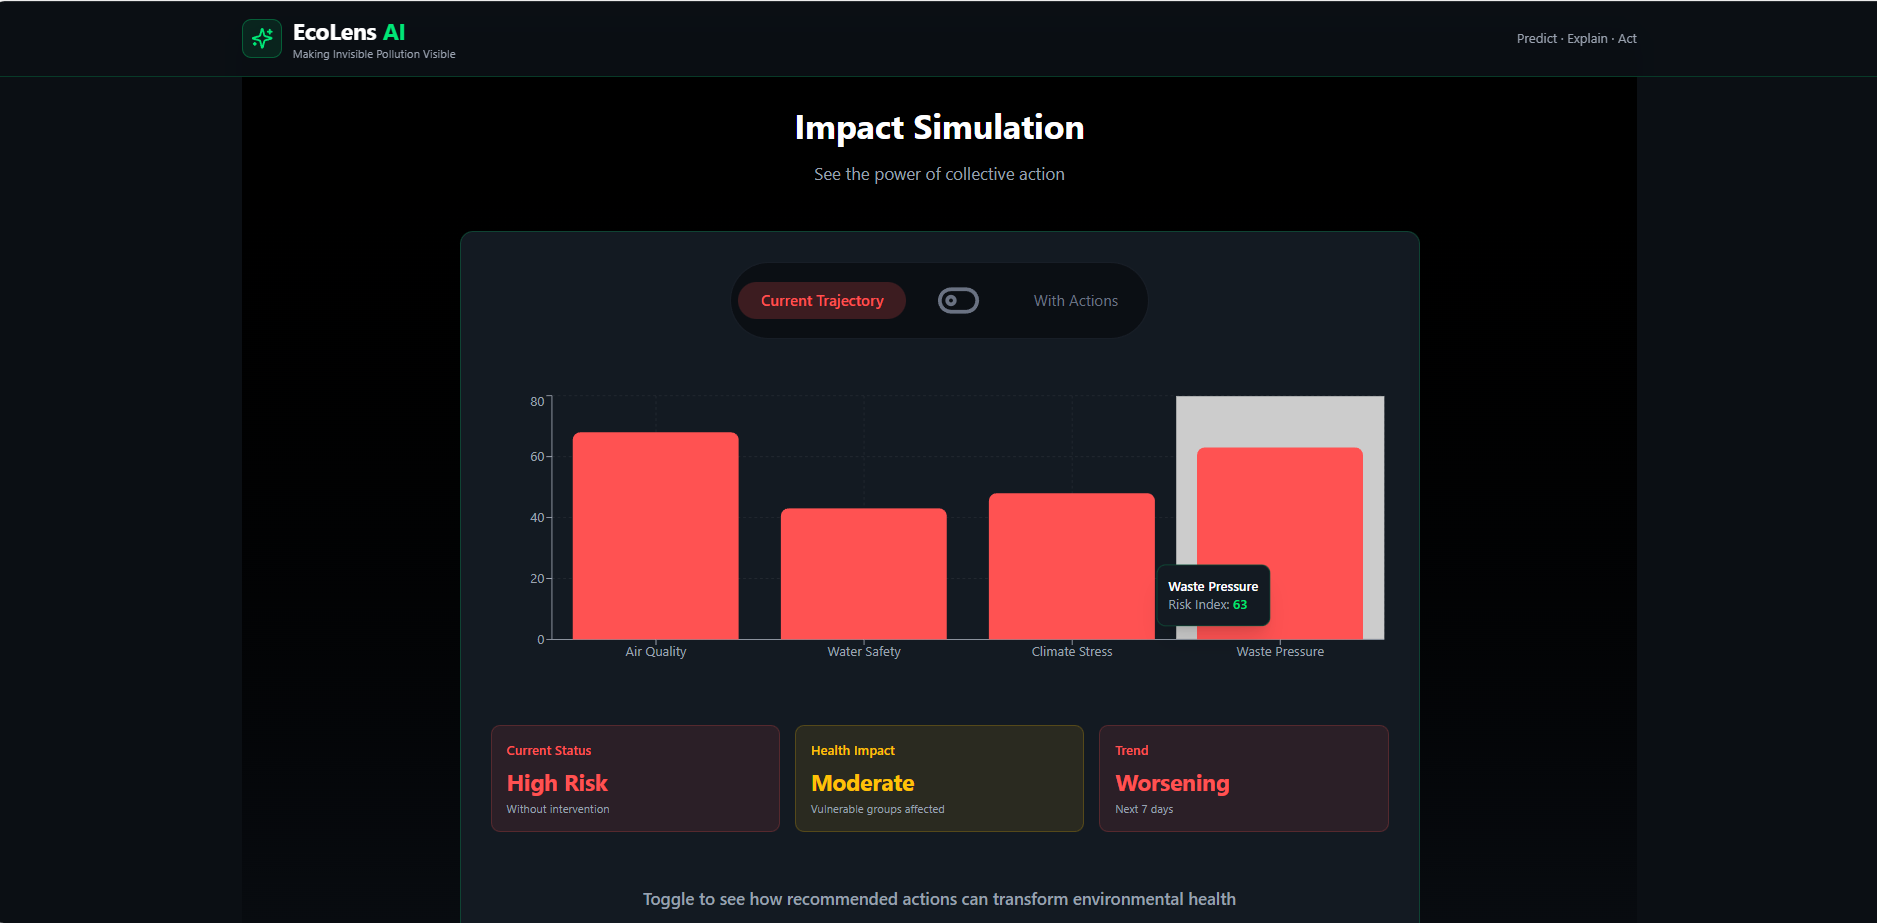
Impact simulation (with vs without action)
How we built it
🧠 System Architecture
Frontend: Dark-theme dashboard with charts and maps
Backend: Python API handling data, predictions, and logic
AI Layer: Lightweight ML models for trend prediction
Data Sources: Public environmental & weather APIs
📊 Data Processing Flow
Fetch real-time environmental data
Normalize and clean values
Feed historical + live data into AI models
Generate predictions and insights
Serve structured JSON to frontend Example Calculations & Formulas 🔹 Air Quality Risk Index Air Risk Score = (PM2.5 / Safe_PM2.5) × 100
Safe_PM2.5 = 25 µg/m³
PM2.5 = 75
Air Risk Score = (75 / 25) × 100 = 300 → High Risk
Pollution Prediction (Simplified ML Regression)
Future_PM2.5 = a × Previous_PM2.5 + b × Weather_Factor + c Where:
a, b, c are learned from historical data Weather_Factor includes wind speed & humidity Environmental Impact Score (0–100)
Impact Score = 100 − (Air_Risk × 0.5 + Water_Risk × 0.3 + Waste_Risk × 0.2)
Higher score = better environmental condition
Action Impact Simulation
Adjusted_Risk = Current_Risk − Σ(Action_Effectiveness)
Example:
Current PM2.5 Risk = 150
Tree Plantation Effect = −10
Avoid Burning Effect = −15
Adjusted Risk = 150 − (10 + 15) = 125
Challenges we ran into
Integrating multiple environmental APIs with different formats
Converting raw pollution data into meaningful insights
Designing AI predictions that are accurate yet lightweight
Creating a UI that is data-heavy but not overwhelming
Ensuring the platform stays beginner-friendly
Accomplishments that we're proud of
Built a working AI-powered sustainability platform
Successfully translated complex data into human-centric insights
Designed a clean, professional, judge-friendly dark dashboard
Implemented predictive analytics, not just monitoring
Created a system with real-world scalability potential
What we learned
Data alone doesn’t drive action — interpretation does
AI is most powerful when it augments human understanding
Simple models + good UX often beat complex systems
Sustainability solutions must focus on behavior change
Clear storytelling is as important as technical depth
What's next for Ecolens AI
Integration with IoT sensors for hyper-local accuracy
Community-based impact tracking
Mobile app version
Multi-language support
Partnerships with schools and municipalities
Carbon footprint tracking module
Real-time alert system for pollution spikes
🌿 Final Note
EcoLens AI demonstrates how technology can move beyond awareness and become a tool for climate action, empowering individuals and communities to create measurable environmental impact.
Built With
- ai
- api
- charts
- github
- javascript
- map
- netlify
- python
- sqlalchemy
- typescript
- ui
- uvicorn
- ux


Log in or sign up for Devpost to join the conversation.