-
-
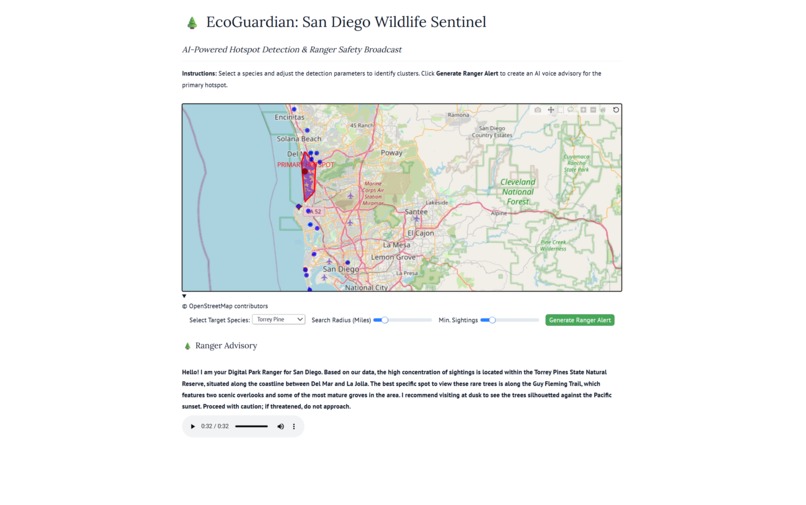
Dashboard View

Inspiration
As urban development expands into natural habitats, human-wildlife encounters are sharply increasing in areas like San Diego. We realized that existing wildlife tracking is mostly reactive—people only know about a coyote or leopard shark after they spot it. We wanted to build a proactive system that acts as an active guardian for the community, warning hikers and residents about active animal territories before they step into them.
What it does
EcoGuardian is a real-time, AI-powered spatial dashboard. Users select a target species and adjust search parameters. The app then groups scattered sighting coordinates into distinct, dynamic "pack territories" mapped visually on the screen.
When a primary hotspot is identified, the system triggers our "Digital Park Ranger." Instead of just showing raw GPS coordinates, it passes the data to Gemini, which cross-references the location to identify the nearest real-world park or neighborhood. Gemini drafts a hyper-local safety advisory, which is instantly synthesized into a live audio broadcast using ElevenLabs.
How we built it
The entire pipeline is built in Python, utilizing a reactive UI created with Marimo.
Data Science & ML: We used scikit-learn's DBSCAN algorithm with the Haversine metric to cluster GPS coordinates based on Earth's curvature. We mapped these clusters using plotly and calculated actual territorial boundaries using Convex Hulls via SciPy.
The AI Brain: We utilized the Gemini 3 Flash Preview API. Through strict prompt engineering, we instructed Gemini to act as a Park Ranger, extracting local landmarks from coordinates while intentionally omitting raw numbers from the public warning.
Audio: We routed Gemini's script through the ElevenLabs API to generate a high-fidelity voice broadcast.
Challenges we ran into
Real-world data is messy. When plotting territorial boundaries, we encountered Qhull mathematical precision errors because some sightings had the exact same coordinates or formed a perfectly straight line, which breaks standard 2D geometry calculations. We had to build robust error-handling to map these edge cases without crashing the dashboard. We also had to deeply understand the "chaining effect" of DBSCAN to ensure our search radius slider accurately reflected real-world distances.
Accomplishments that we're proud of
We are incredibly proud of bridging the gap between raw, complex spatial data and an accessible, user-friendly interface. Taking a CSV of random latitude and longitude points and turning it into a beautiful map that literally speaks to you with a localized safety warning feels like a massive leap forward in public safety tech.
What we learned
We learned how to integrate advanced theoretical clustering models into a live, reactive UI. We also mastered the art of "chaining" API calls—taking the mathematical output of a local ML model and feeding it perfectly into cloud-based Large Language Models and Text-to-Speech APIs to create a seamless user experience.
What's next for EcoGuardian
The next step is to hook EcoGuardian up to a live data stream (like the iNaturalist API) so the dashboard updates autonomously. We also want to build a push-notification system that sends these Ranger Audio alerts directly to a user's phone when their GPS detects they are walking into a freshly mapped hotspot.
Built With
- elevenlabsapi
- geminiapi
- marimo
- plotly
- python
- scikit-learn
- scipy

Log in or sign up for Devpost to join the conversation.