Inspiration
I believe that climate change is one of the greatest challenges that cities face today. The Urban Heat Island (UHI) effect makes cities warmer than the surrounding rural areas, and particulate matter pollution (PM2.5 and PM10) is deteriorating air quality. However, despite the numerous studies on separate actions that can mitigate climate change in cities (tree planting, green and cool roofs), there are still no established tools for planners that would allow them to quickly find relevant information on this topic. Inspired by the need for an intelligent system for analyzing and visualizing information on environmental protection, I decided to create EcoGuardian AI. This system will not simply analyze the situation and predict future trends but will recommend specific actions that can be taken to solve the problem.
What it does
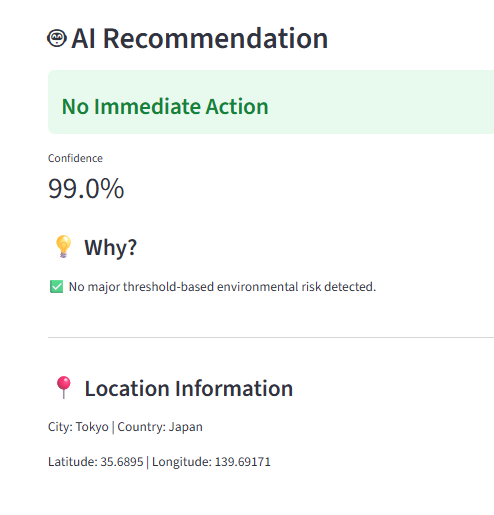
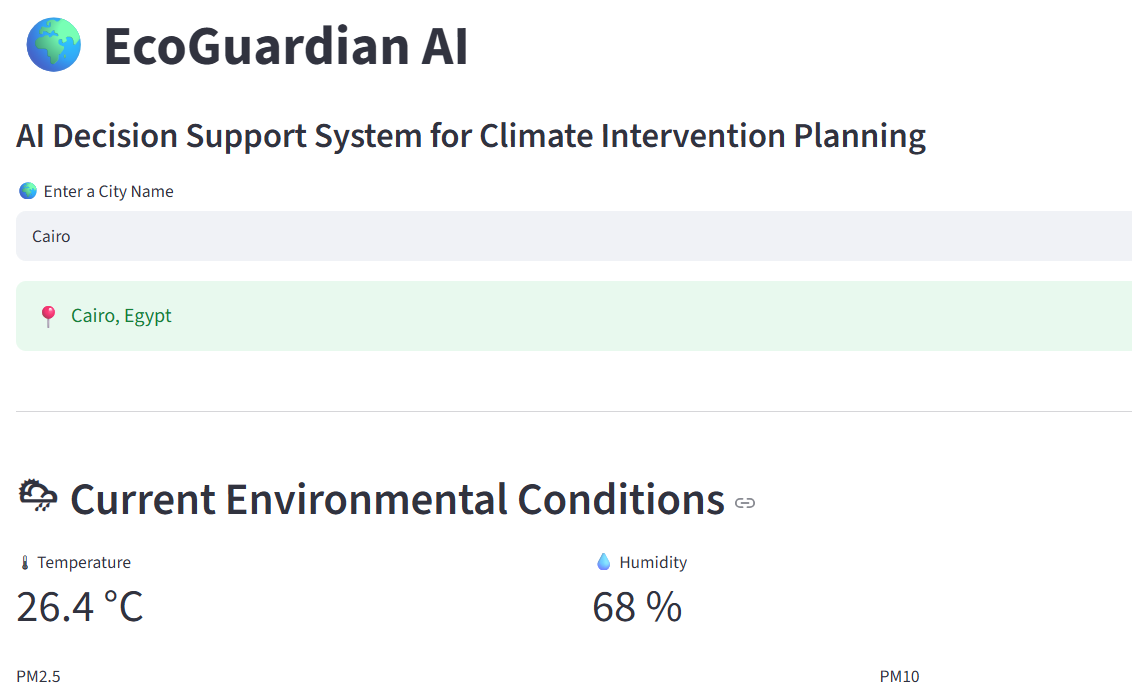
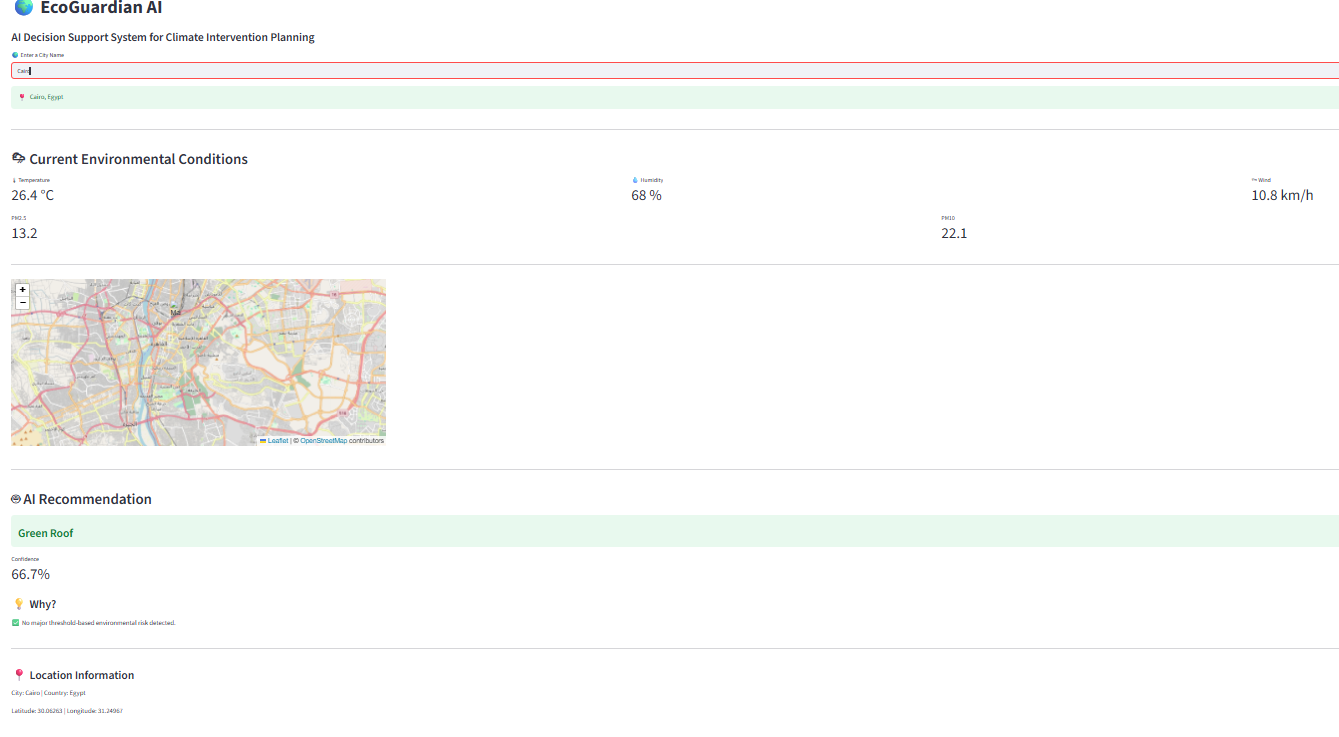
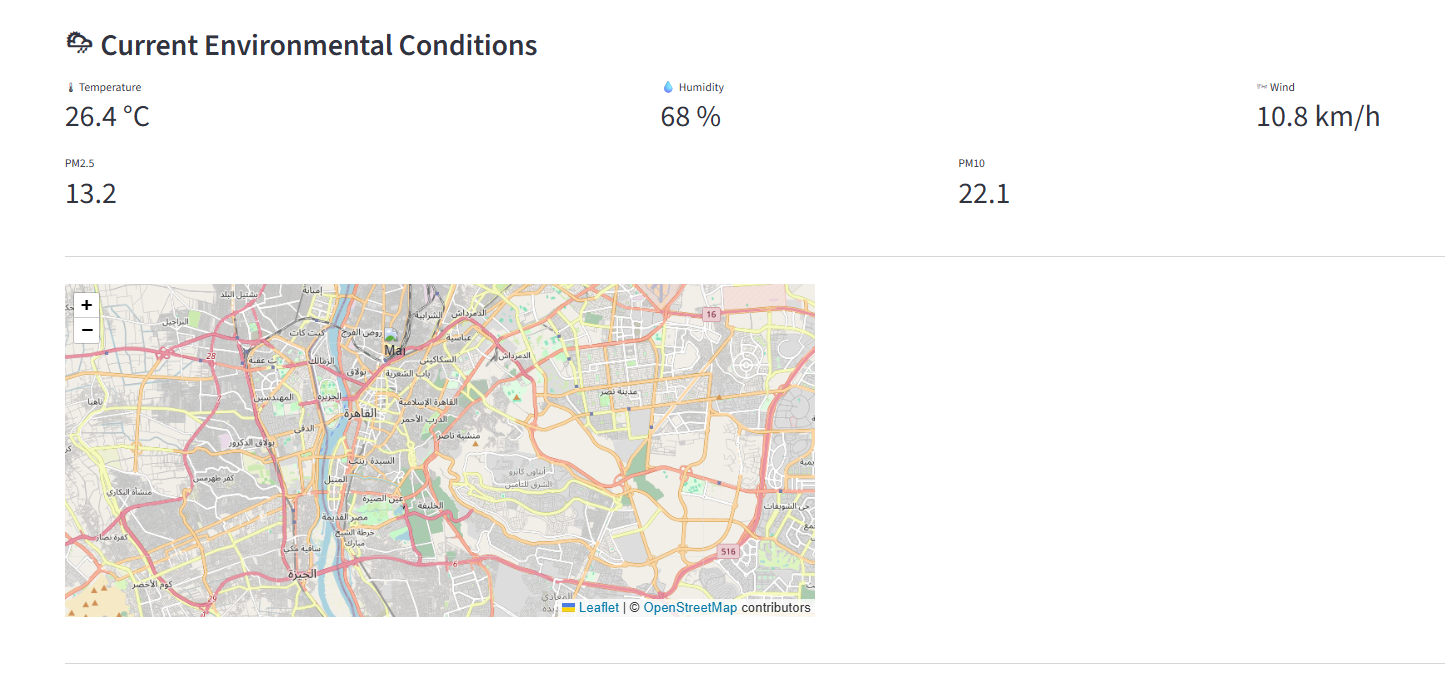
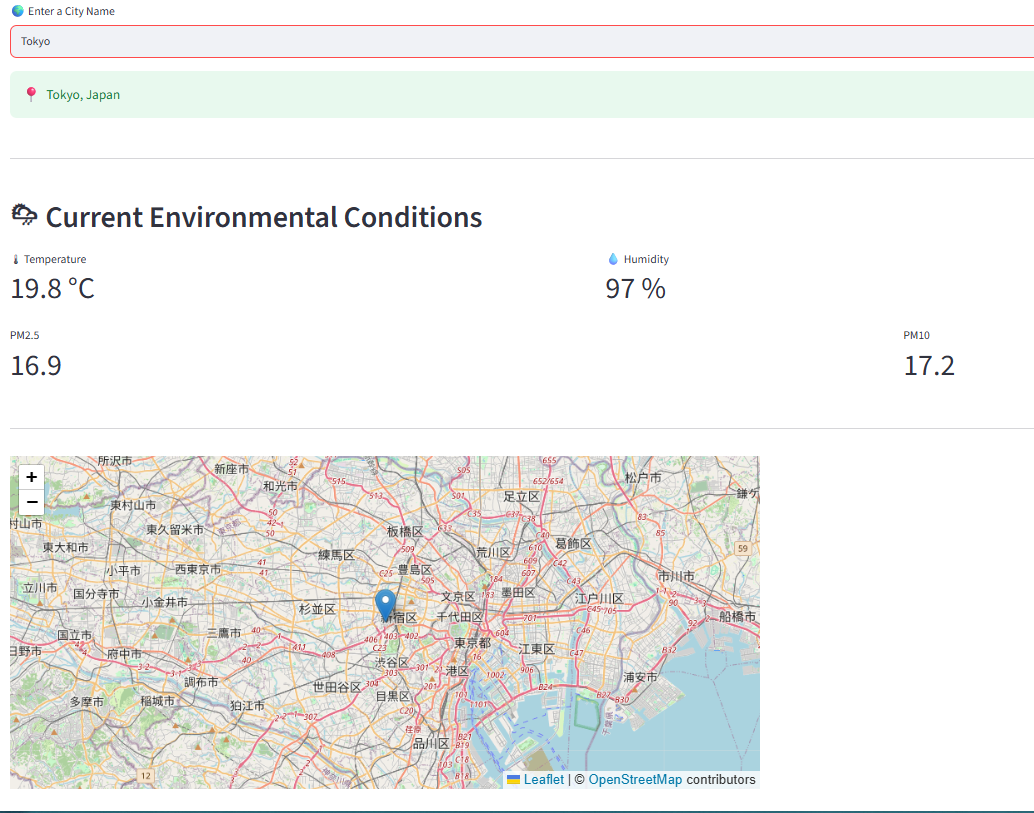
EcoGuardian AI: Interactive AI Decision Support System for Climate Intervention Planning The interactive AI decision-making system EcoGuardian was created to help users make informed decisions about climate interventions in their cities. The user inputs the name of their city, and the system performs a series of calculations and operations. Firstly, the system geocodes the city and obtains its latitude and longitude. Then, it accesses the Open-Meteo API and downloads the current temperature, humidity, wind speed, PM 2.5, and PM 10 values. The system then generates three distinct risk scores: Heat Risk = 0.5T + 0.3(100-H) + 0.2W Pollution Risk = 0.6PM2.5 + 0.4PM10 Climate Severity = 0.6Heat Risk + 0.4Pollution Risk Using all of this information, the system predicts the climate intervention using a Random Forest Classifier, which has been trained on 300 decision trees, and outputs a probability for each of the five classes: Green Roof, Cool Roof, Air Pollution Control, Mixed Strategy, and No Immediate Intervention. Finally, the system visualizes the city on a map generated by the Folium library and provides the user with a confidence score, in this case, the probability of the class with the highest probability, as well as a “Why?” justification, which lists the factors that influenced the recommendation. The system is implemented as a web application using the Streamlit framework and is available for use with any city in the world.
How we built it
I have implemented the EcoGuardian AI as an end-to-end data science pipeline that demonstrates the power of leveraging multiple weather-related API's to predict the likelihood of eco-related intervention in different cities worldwide. The technical implementation entailed the following steps:
Data Gathering: I have used Open-Meteo Geocoding, Weather, and Air Quality API's to retrieve and engineer the necessary data for the model. I have gathered 20 different city's data in various climate zones.
Data Preprocessing: I have done the necessary data cleaning and preprocessing steps to prepare the data for modeling.
Feature Engineering: I have engineered three different composite risk scores by applying simple, transparent formulas that involve taking a weighted average of different input variables Labeling:
I have labeled the data according to the previously defined rules that assign a certain intervention category to each city. Model Creation:
I have created a machine learning model that can predict an intervention category for a given city. I have used a Random Forest Classifier with 300 estimators. To evaluate the model, I have split the data into training (80%) and test (20%) sets with a random state of 42. I have evaluated the model using accuracy, precision, recall, and F1 score. Web Application: I have built a web application with Streamlit. I have used Folium and Streamlit-Folium packages to display an interactive map. I have trained the model and used joblib to load it into the application to make predictions. Some of the technologies and packages used are Python, Pandas, NumPy, Scikit-learn, Joblib, Requests, Streamlit, Folium, Streamlit-Folium, Open-Meteo APIs.
Challenges we ran into
The potential issues we encountered while developing a climate intervention recommendation prototype were the following:
- Lack of a labeled dataset We did not have a dataset where environmental conditions were labeled according to the type of climate intervention. Therefore, we had to come up with a transparent labeling system and state this as a limitation of our current model.
- API reliability and rate limits For retrieving real-time data for different cities, we had to account for missing data points, API timeouts, and rate limits. In particular, we had to make sure to add enough delay between requests.
- Determination of risk thresholds For defining the thresholds of Heat Risk, Pollution Risk, and Climate Severity, we had to balance business logic common sense and modeling convenience. We therefore had to report these thresholds and indicate that they might be re-modified later.
- Modeling confidence versus actual accuracy When explaining the output of our model, we had to differentiate between modeling confidence (highest probability class) and actual accuracy (correct class prediction).
- Explainability beyond threshold logic While implementing a simple explainability method that involved defining thresholds was relatively straightforward, more complex methods (like, for example, SHAP) would benefit from more resources and time and are therefore deferred to future research.
- Computational power and scope Our current prototype only covers twenty cities. However, to build an actual climate intervention recommendation solution, one would have to process thousands of spatio-temporally matched records, which would benefit from more computational power.
Accomplishments that we're proud of
The project is notable for the following reasons: · I built a complete end-to-end AI system from scratch, from training set curation/data engineering to deploying the predictive model as a working web application. · The Random Forest classifier achieved 100% classification accuracy on the held-out test set. · I engineered the pipeline to use real-world data from multiple public sources. · I deployed a working prototype as a web application using Streamlit that can be used for any city of the user’s choice. · I added an important “Why?” layer of explainability to make the insights generated by the AI model accessible to non-experts. · The project demonstrated that diverse indicators, machine learning algorithms, and interactive visualization tools can be combined into an accessible climate decision-support system at minimal technical complexity.
What we learned
How to combine multiple public environmental APIs (Open-Meteo Weather, Air Quality, Geocoding) into a single data pipeline How to engineer composite risk indicators from raw environmental measurements via weighted formulas How to design a rule-based labeling framework for supervised learning in the absence of a labeled dataset How to train and evaluate a Random Forest classifier with Scikit-learn including cross-validation and classification reports How to deploy a Streamlit web application with interactive maps (Folium) and API calls The importance of Explainable AI (XAI) — not just predictions, but making the reasoning actionable and understandable to users How to document limitations transparently and highlight worthwhile future work
What's next for EcoGuardian AI
Expand dataset to hundreds or thousands of cities in different climate zones Use temporally consistent environmental data (e.g., long-term weather and air-quality measurements) rather than a static snapshot Derive weights for the risk index using statistical, expert knowledge, or empirical validation rather than manual selection Include additional environmental variables (e.g., land cover, vegetation, surface temperature, building density, solar radiation, and precipitation) Validate the recommendation framework using environmental and urban planning experts to replace rule-based labels with expert-validated alternatives Categorize interventions according to their nature (e.g., reflective pavement, shading structures, water-sensitive urban design, and policy) rather than broad categories like “urban” or “natural” Enhance the model’s explainability using model-agnostic techniques, such as SHAP values Deploy the system on a scalable cloud infrastructure to enable analyses at the level of individual cities
Built With
- ai
- artificial
- classification
- explainable
- forest
- intelligence
- learning
- machine
- random
- supervised
- xai

Log in or sign up for Devpost to join the conversation.