Inspiration
Modern cities face compounding ecological hazards—from localized air pollution spikes and heat island traps to overflowing municipal waste and water main leaks. However, urban management often operates in silos: municipal agencies lack real-time ground-level visibility, while citizens lack direct, transparent channels to enact micro-environmental stewardship.
We set out to bridge this divide by creating EcoCity Pulse: a unified, interactive platform where citizen reporting, IoT environmental telemetry, multimodal AI triage, and gamified carbon accounting converge to build resilient, responsive cities.
What It Does
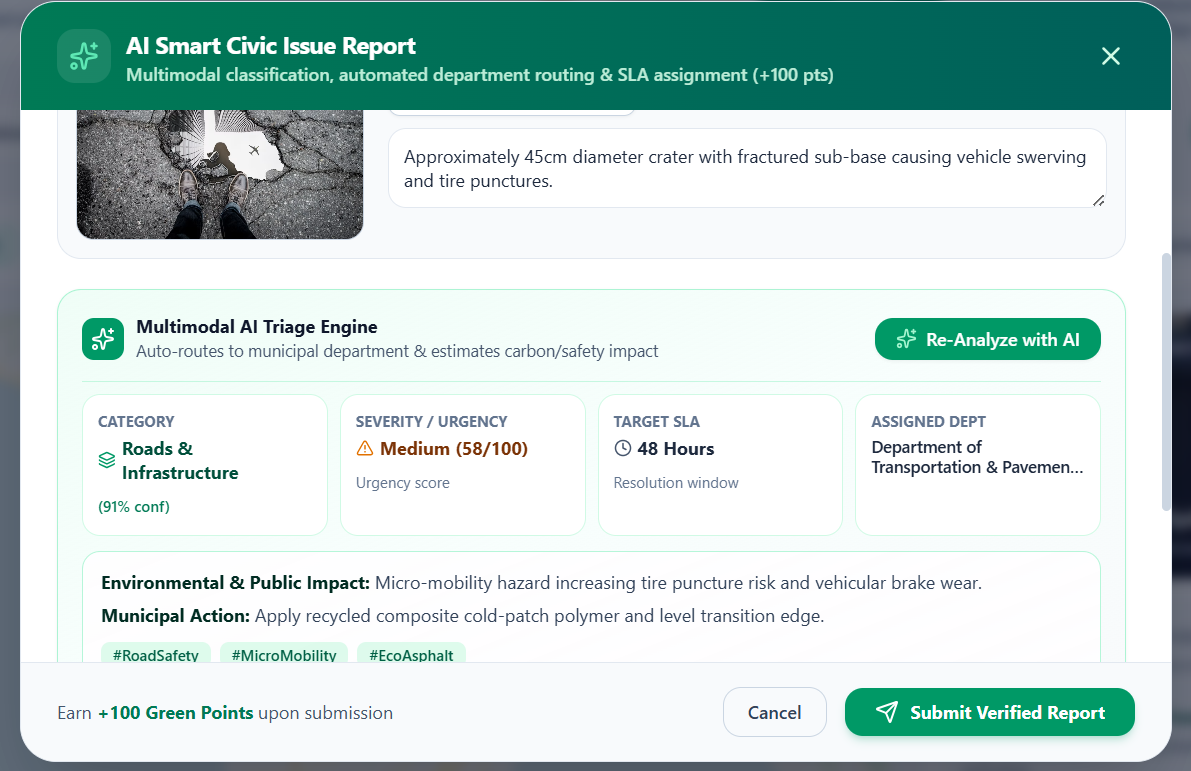
- Multimodal AI Civic Triage: Citizens photograph urban hazards (e.g., burst pipes, illegal dump sites, broken solar streetlights). Powered by Google's Gemini multimodal models, the system autonomously classifies the category, assigns urgency scores, routes work orders to the correct municipal agency (Sanitation, Water Board, Transportation, Forestry), and estimates carbon/safety impact.
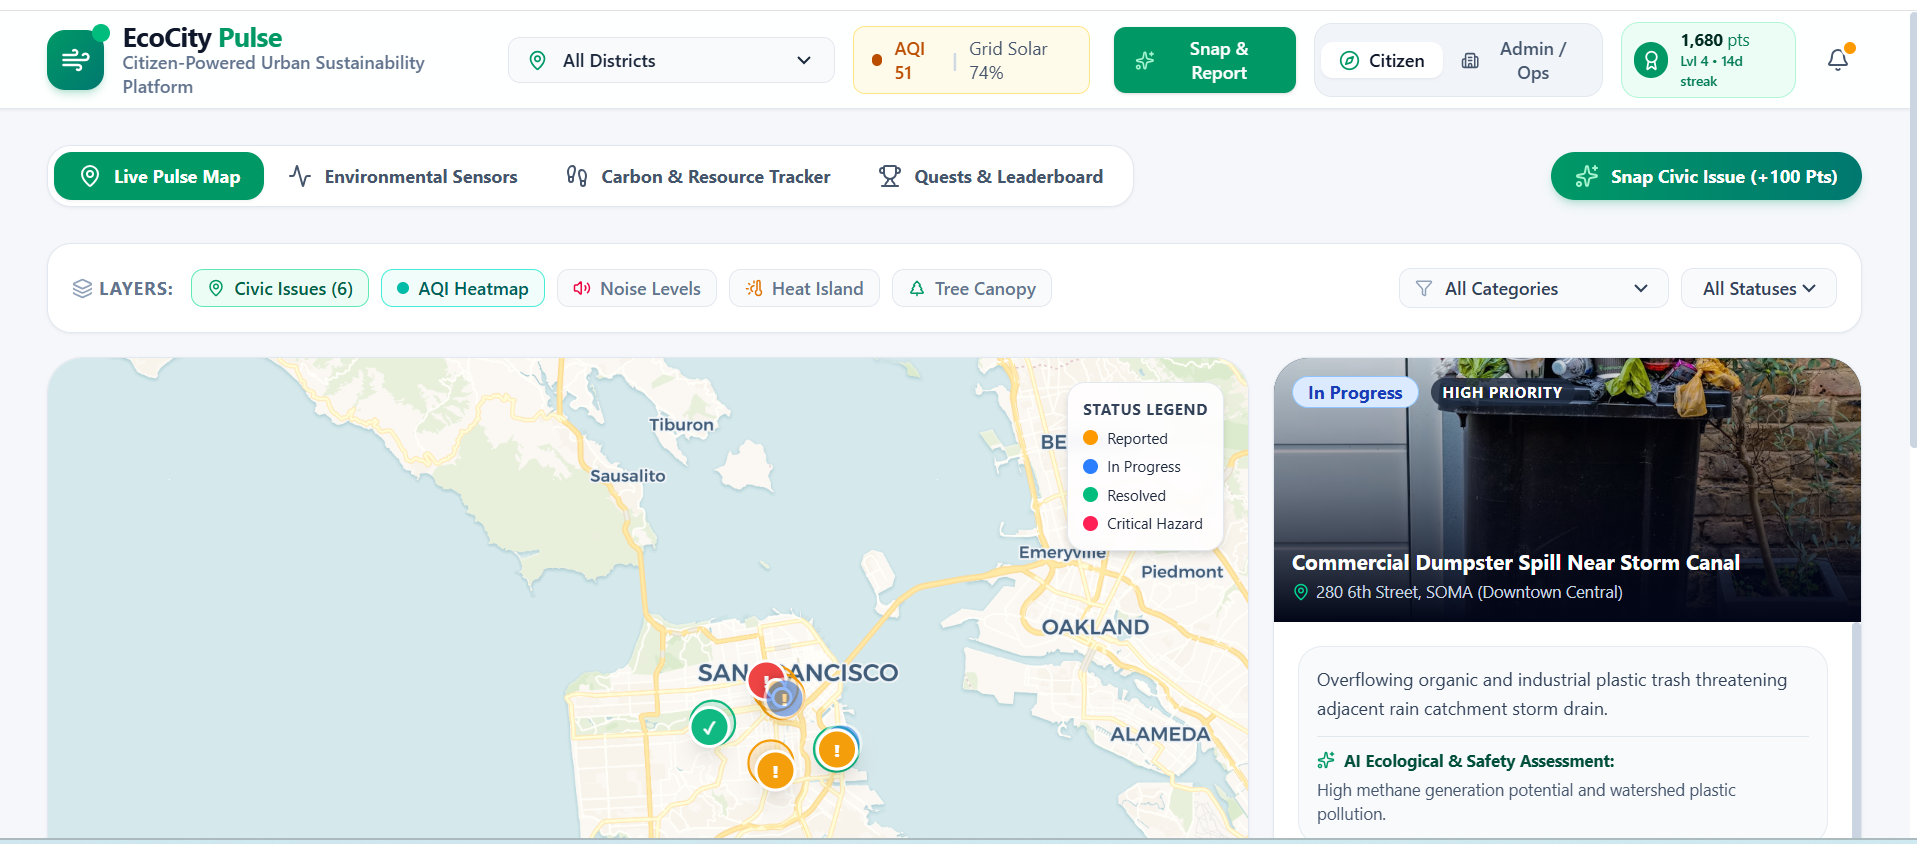
- Interactive Pulse & Environmental Map: A high-contrast map with multi-layer overlays for civic issue pins, real-time Air Quality Index (AQI) heatmaps, acoustic noise decibel zones, urban heat island deltas, and tree canopy density.
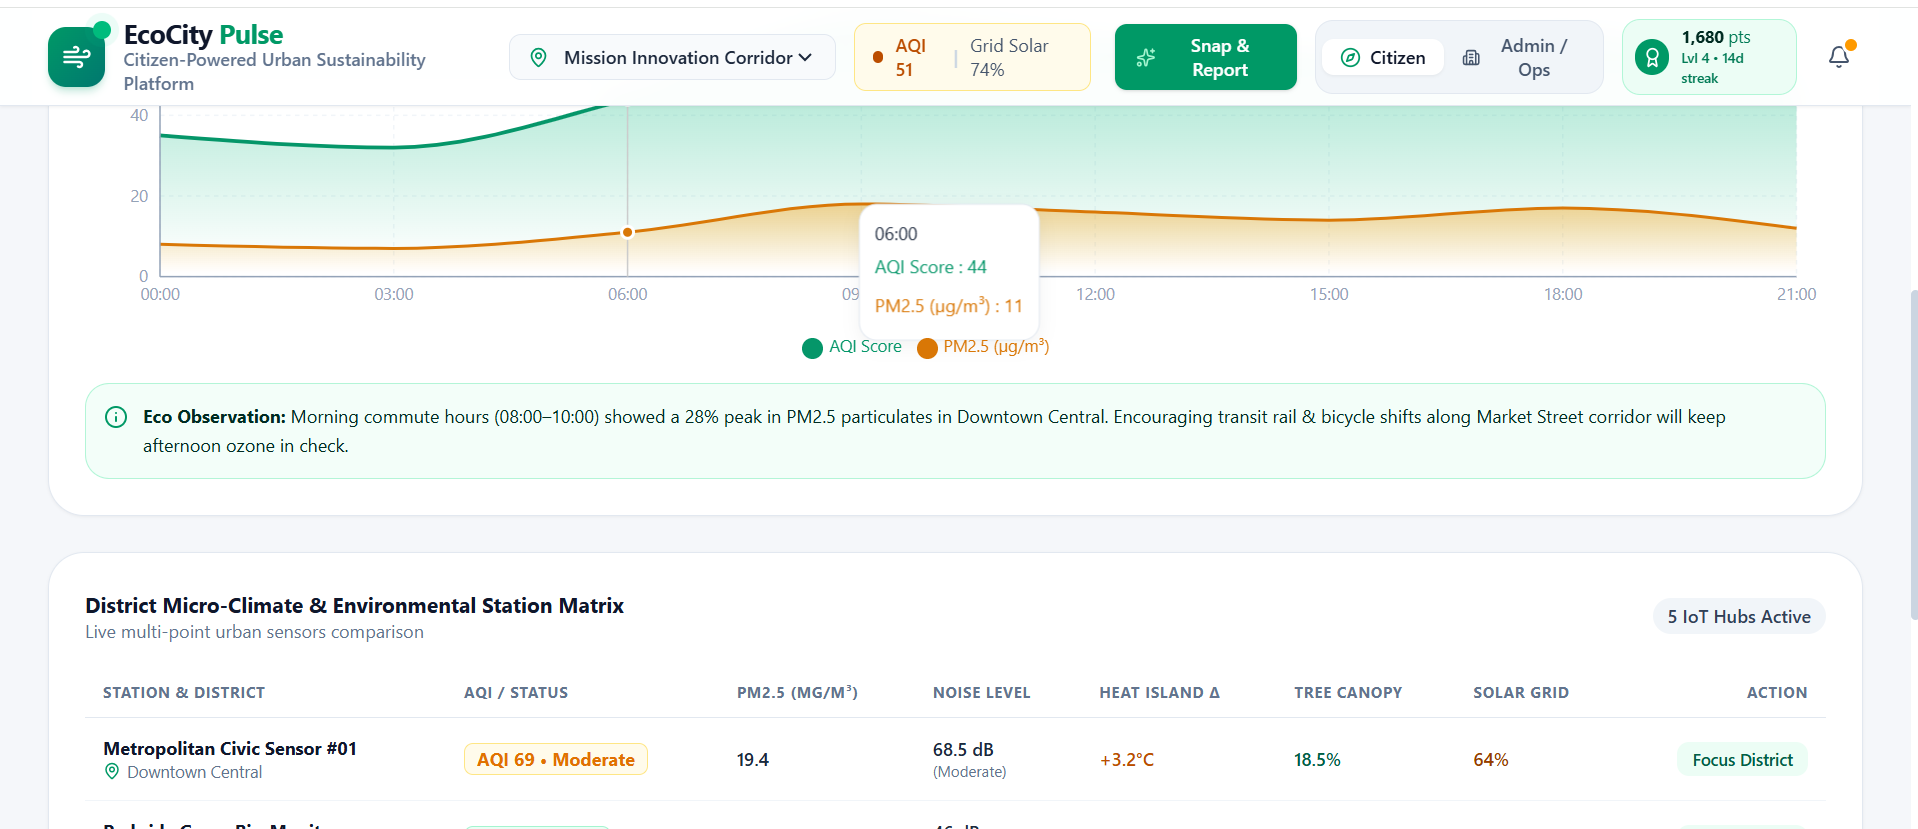
- Live IoT Sensor Telemetry: 24-hour diurnal trend tracking for AQI, particulate matter ($\text{PM}{2.5}$ / $\text{PM}{10}$), ambient noise thresholds, and clean renewable grid mix.
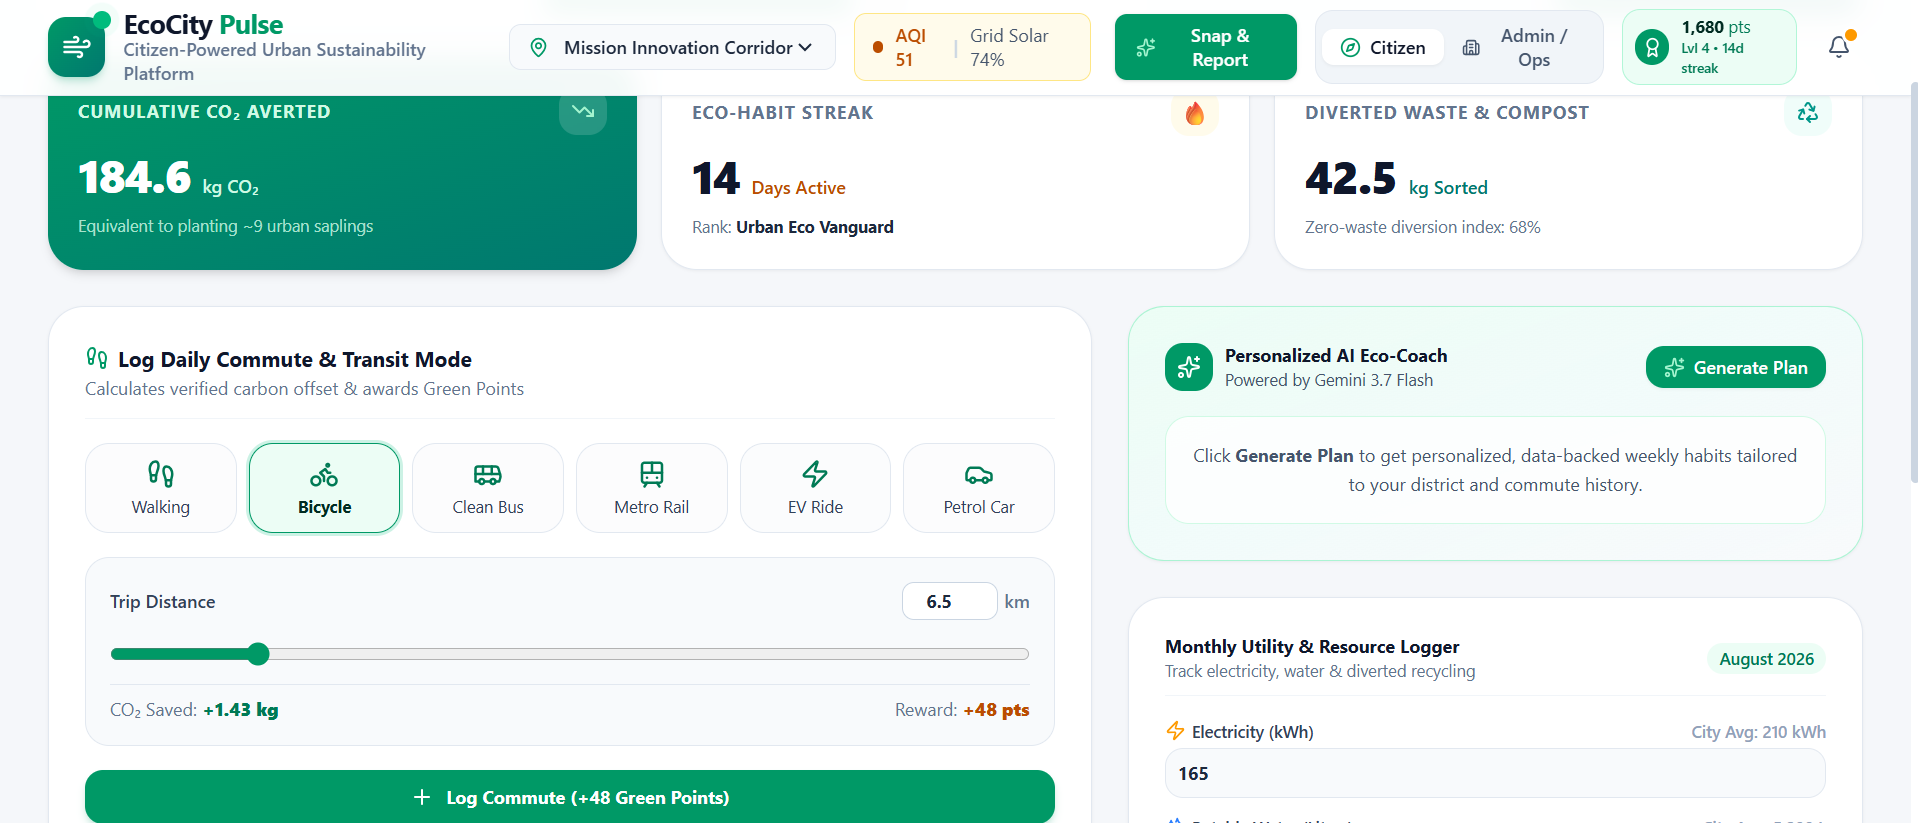
- Personal Carbon & Resource Tracker: A personal mobility logger quantifying carbon avoidance ($\text{kg CO}_2$) across sustainable transit modes, monthly utility tracking (water, power, compost), and an AI Eco-Coach that delivers personalized weekly micro-habit routines.
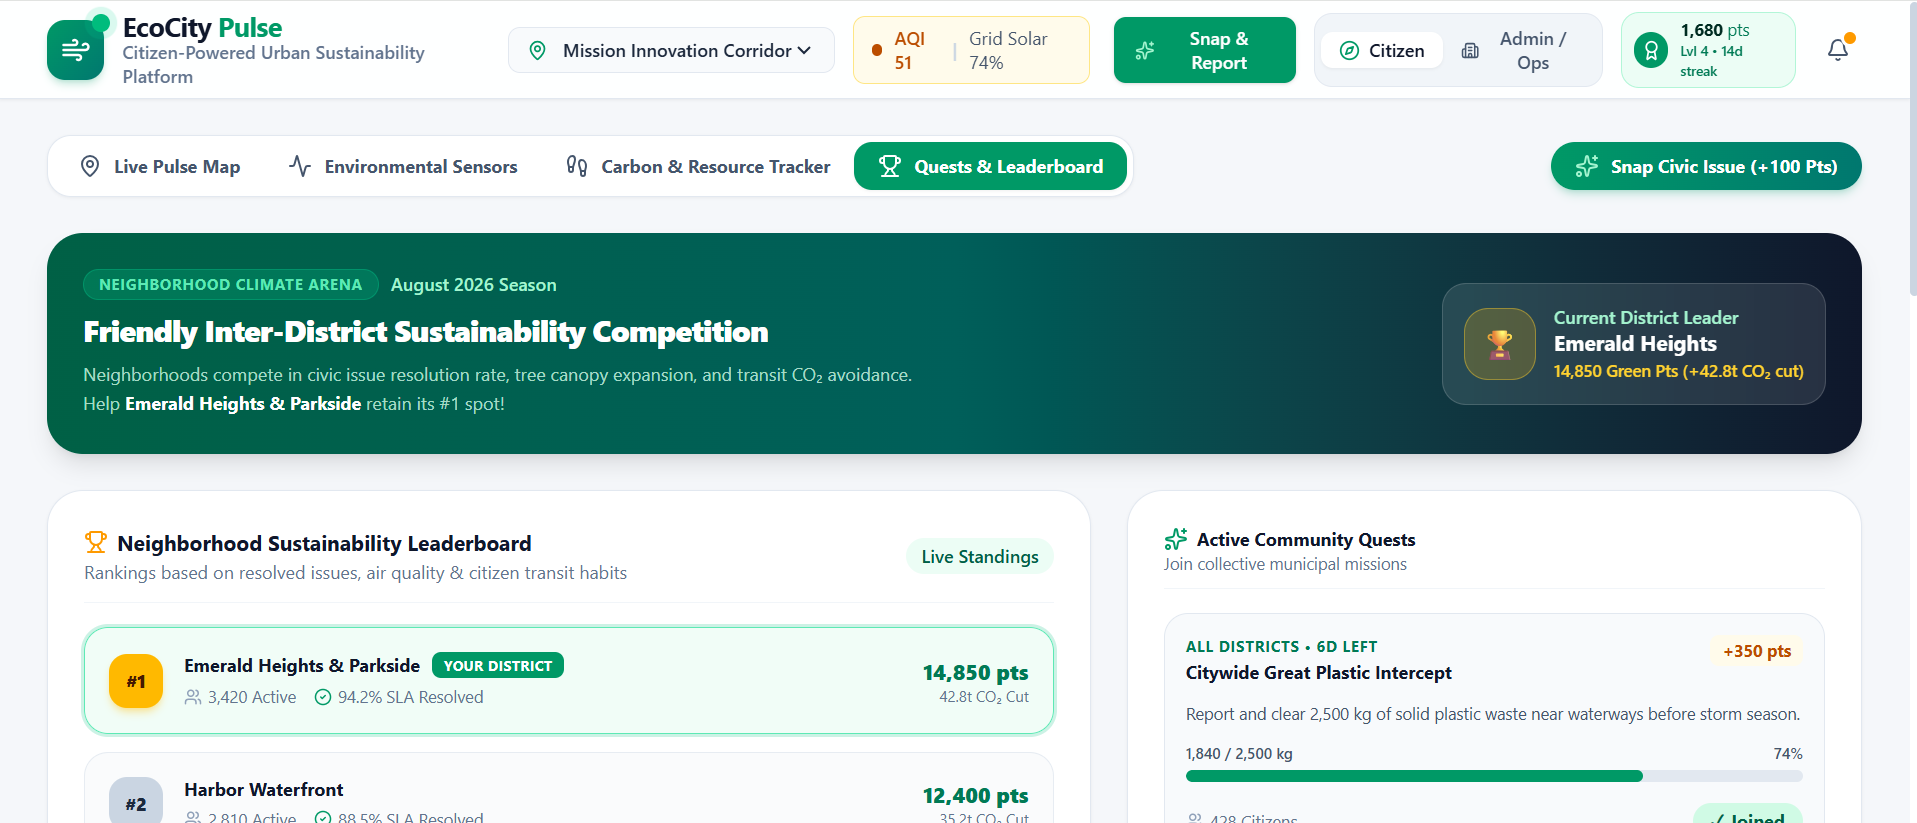
- Community Quests & Gamification: Inter-district leaderboards and collective municipal quests (e.g., car-free corridors, waste intercepts) rewarding citizen action with Green Points.
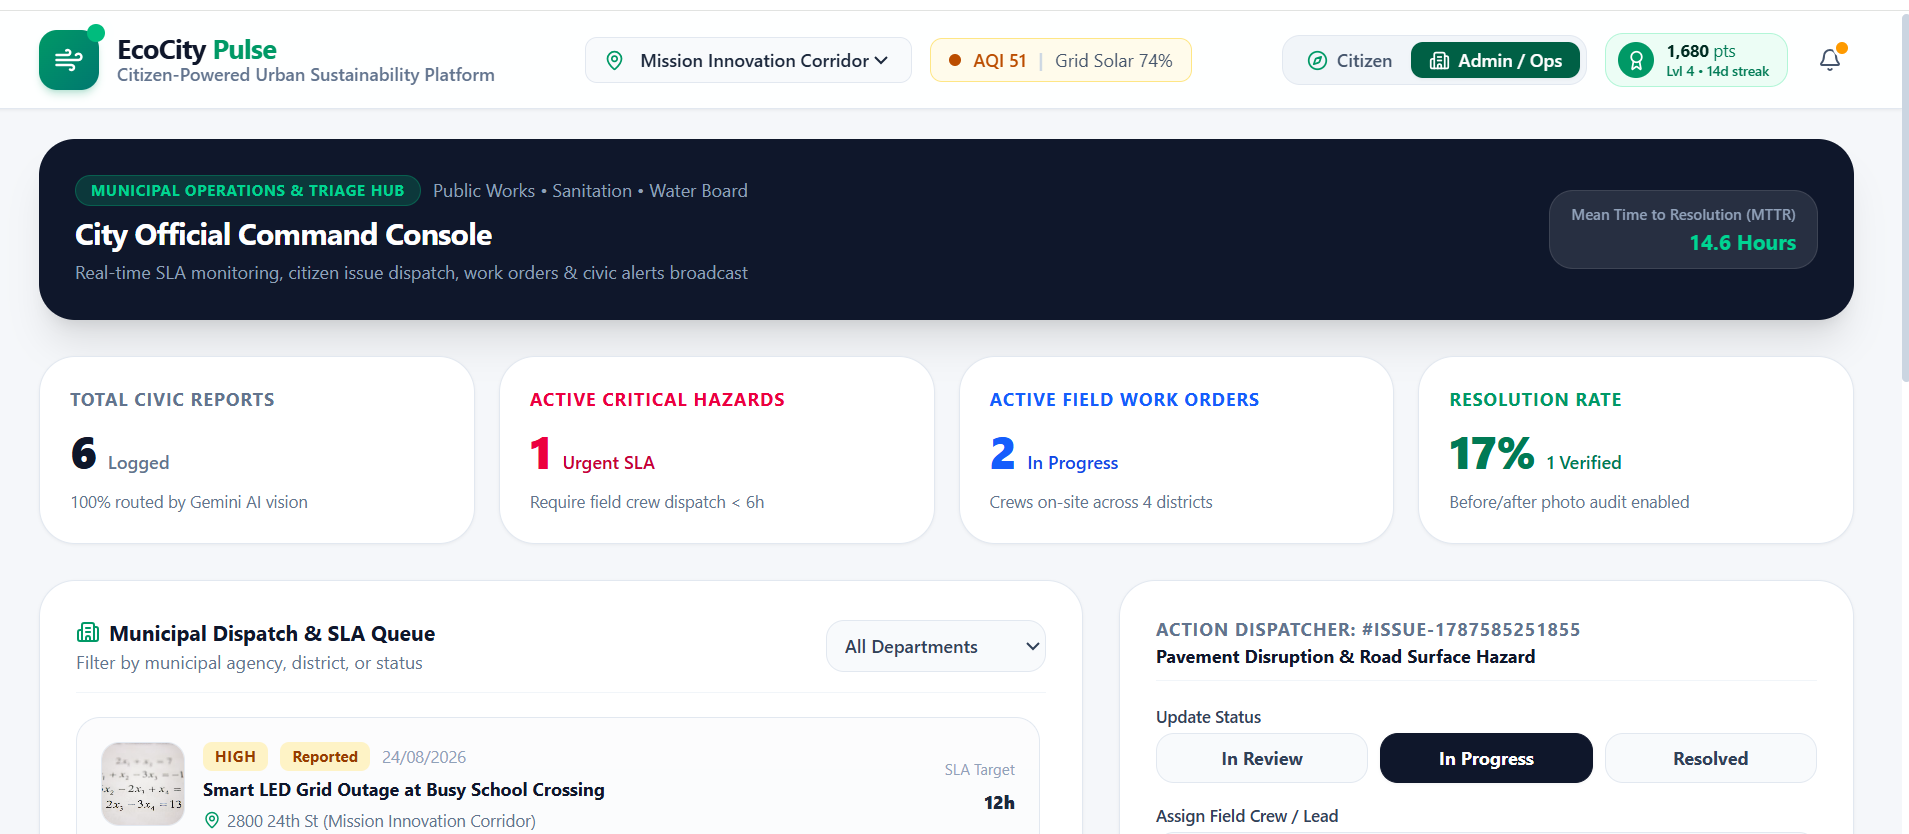
- Municipal Command Console: A dedicated dashboard for city officials to manage field crew dispatches, track Mean Time to Resolution (MTTR), upload before/after verification photos, and broadcast targeted civic advisories.
Mathematical Formulation & Ecological Calculations
1. Commute Carbon Avoidance & Footprint Delta
Carbon savings from sustainable transit modes are computed against an urban internal combustion engine (ICE) baseline factor ($\beta_{\text{ICE}} \approx 0.22\ \text{kg CO}_2/\text{km}$):
$$\Delta \text{CO}{2,\text{saved}} = \sum{i=1}^{n} d_i \cdot \max\left(0,\, \beta_{\text{ICE}} - \epsilon_{\text{mode}, i}\right)$$
Where:
- $d_i$ is the distance traversed in kilometers.
- $\epsilon_{\text{mode}}$ is the mode emission factor (e.g., $\epsilon_{\text{walking}} = 0$, $\epsilon_{\text{metro}} = 0.04\ \text{kg CO}_2/\text{km}$).
2. Urban Heat Island ($\Delta T_{\text{UHI}}$) Mitigation
The cooling effect generated by urban tree canopy coverage ($\gamma \in [0, 1]$) is modeled through sensible heat reduction:
$$\Delta T_{\text{canopy}} = -\kappa \cdot \sqrt{\gamma} \cdot \left(1 - \alpha_{\text{albedo}}\right)$$
How We Built It
- Frontend: React 18 with TypeScript and Vite, styled using Tailwind CSS and Lucide icons.
- Mapping & Geodata: Leaflet with CartoDB Positron tiles, rendering custom vector markers, dynamic tooltips, and heat-zone radius overlays.
- Data Visualization: Recharts for interactive diurnal AQI, acoustic decibel, and solar telemetry curves.
- AI Vision & Coaching: Google Gemini API integration for real-time image triage, safety assessment, and personalized eco-habit generation.
- Backend & API: Express.js server providing REST endpoints for civic issue lifecycle states, live sensor streams, and civic alert broadcasts.
Challenges We Faced
- Fine-Grained Multimodal Classification: Prompt engineering Gemini to produce structured, deterministic JSON metadata (category, SLA hours, risk level, department assignment) from diverse, real-world user photos.
- Cartographic Layer Performance: Ensuring smooth rendering and zero layout thrashing when toggling multiple overlapping spatial layers (AQI circles, noise buffers, heat island deltas, and issue pins).
- Gamification Balance: Calibrating points and carbon calculations to reward verifiable daily actions without encouraging spam reporting.
What We Learned
- Providing immediate, tangible feedback (such as before/after resolution photos and carbon avoidance metrics) significantly boosts user engagement with civic infrastructure.
- Combining visual AI triage with municipal SLA routing dramatically reduces the operational overhead of sorting unstructured citizen reports.
Built With
- api
- carbon
- computervision
- css
- express.js
- gemini
- icons
- iot
- leaflet.js
- lucide
- node.js
- react
- recharts
- rest
- tailwind
- tech
- telemetry
- tracking
- typescript
- urban
- vite

Log in or sign up for Devpost to join the conversation.