-
-
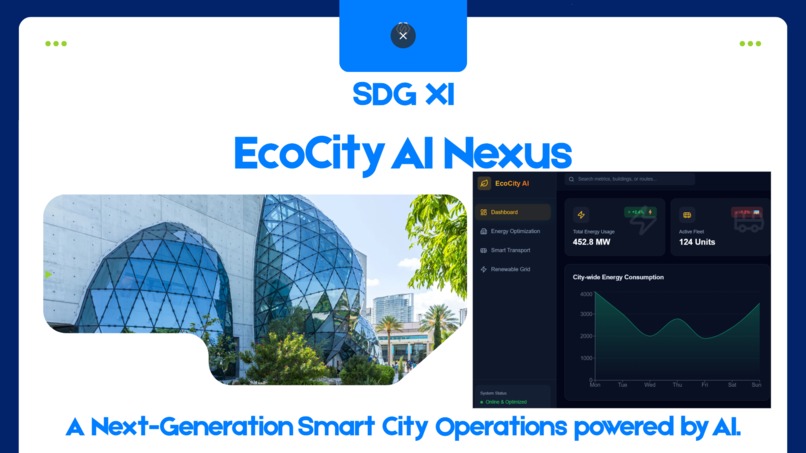
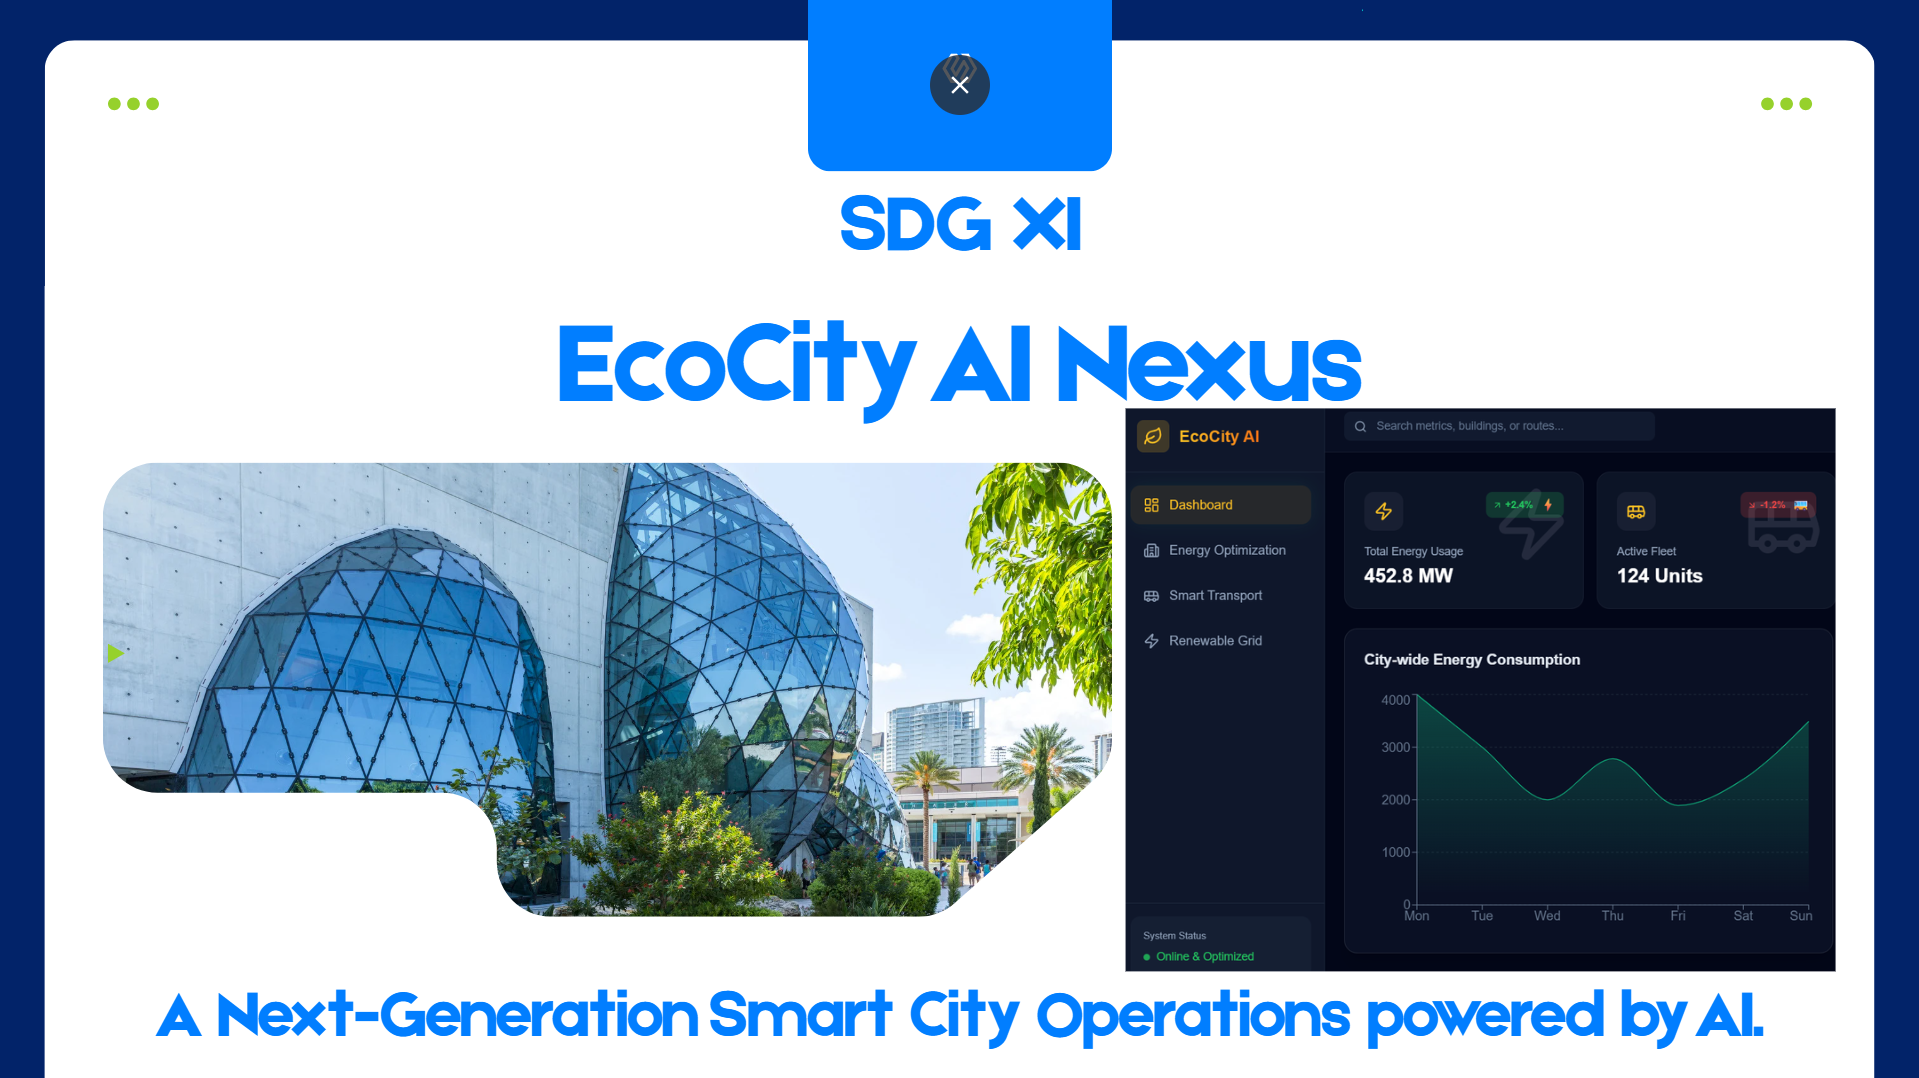
Energy Smart Cities
Inspiration
Our journey began with a critical observation of UN Sustainable Development Goal 11: Sustainable Cities and Communities. We realized that while modern cities generate terabytes of data daily—from smart meters to traffic sensors—this data often remains trapped in silos. An energy manager doesn't see what the transport manager sees, leading to inefficiencies.
We asked ourselves: What if a city had a single "brain" that could not only see everything but also think? This inspired us to build EcoCity AI Nexus, a platform designed to bridge the gap between raw data and actionable sustainability.
What We Learned
Building this project was a masterclass in systems thinking and user-centric design.
- Data Visualization is a Language: We learned that displaying raw numbers isn't enough. We had to translate complex metrics into intuitive visual stories using Recharts.
- The Power of Context: We discovered that AI is most powerful when it understands context. A recommendation for a commercial tower must be fundamentally different from one for a residential complex.
- Glassmorphism Challenges: Implementing a high-fidelity "Glassmorphism" aesthetic taught us valuable lessons in CSS backdrop filters, layer management, and accessibility contrast.
How We Built It
We engineered EcoCity AI Nexus using a modern, performance-first stack:
- Core Engine: Built on React 18 with TypeScript for type-safe, robust logic.
- Build Tool: Powered by Vite for lightning-fast HMR and optimized production builds.
- Visual System:
- TailwindCSS v4 for a custom, scalable design system.
- Framer Motion for fluid, futuristic transitions that make the dashboard feel "alive."
- Simulation Layer: We created a custom "Smart Mock Engine" that generates realistic data patterns to mimic daily usage cycles
Challenges We Faced
- The "Silo" Problem: Designing a data structure that could unify three distinct domains (Energy, Transport, Grid) without making the codebase messy was a significant architectural challenge. We solved this by creating modular "Manager" components that share a common layout shell.
- Real-Time Performance: Rendering multiple animated charts simultaneously initially caused frame drops. We optimized this by memoizing heavy components and throttling data updates to ensure a smooth 60fps experience.
- Deployment Hurdles: We faced issues with client-side routing on GitHub Pages (specifically the
basenameconfiguration), which resulted in blank page errors. Debugging this taught us the intricacies of how Single Page Applications (SPAs) handle server-side routing vs. client-side navigation.
Built With
- framer-motion
- github
- google-gemini-api
- lucide-react
- react
- recharts
- tailwindcss
- typescript
- vite

Log in or sign up for Devpost to join the conversation.