-
-
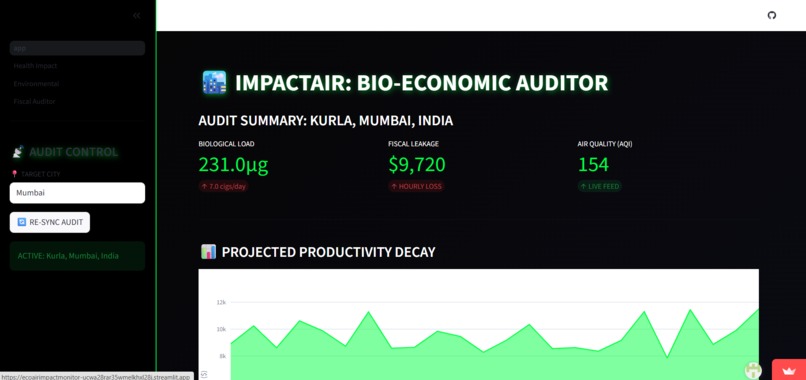
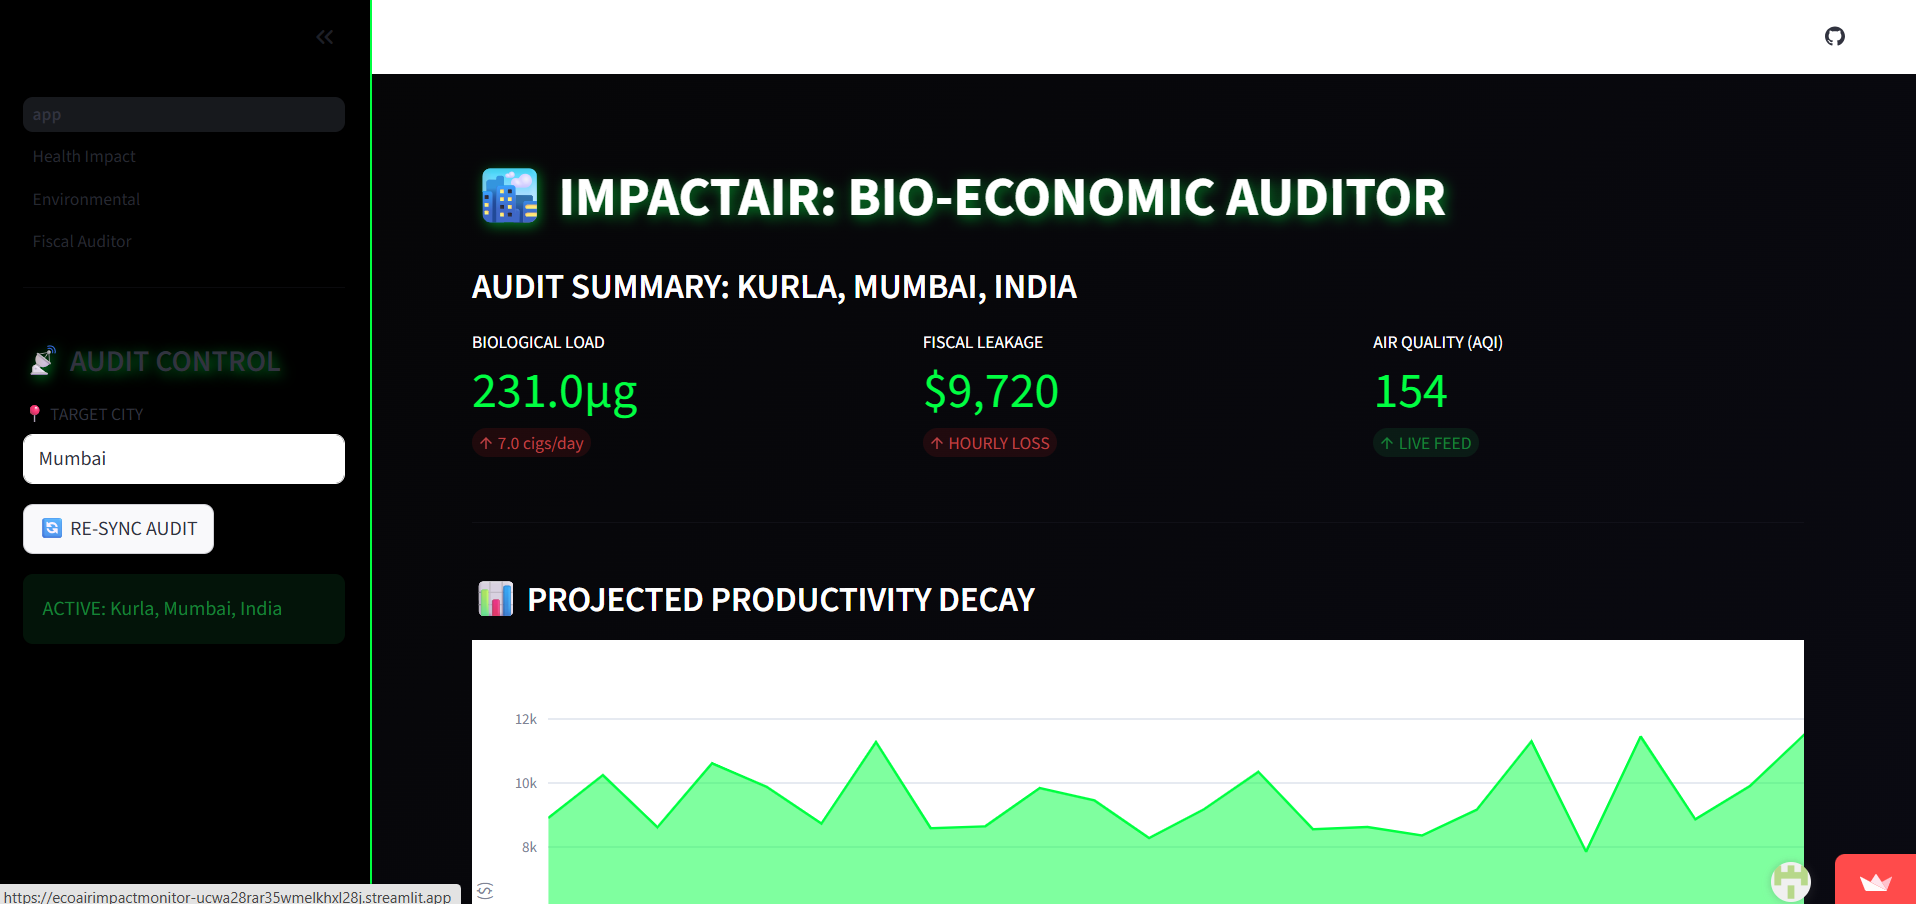
Live bio-economic audit translating air pollution into biological damage, productivity loss, and economic leakage for Kurla, Mumbai.
-
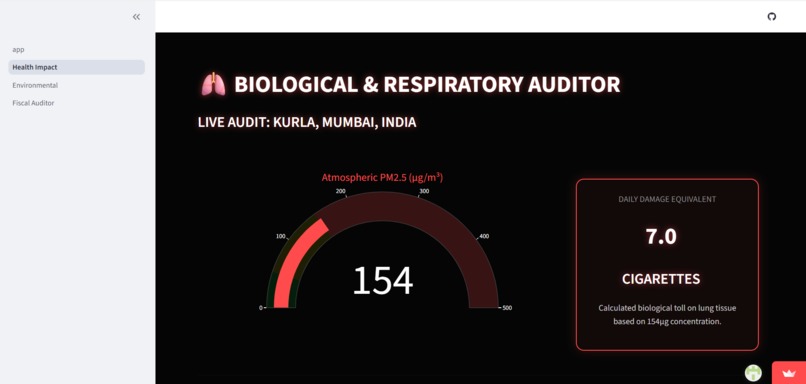
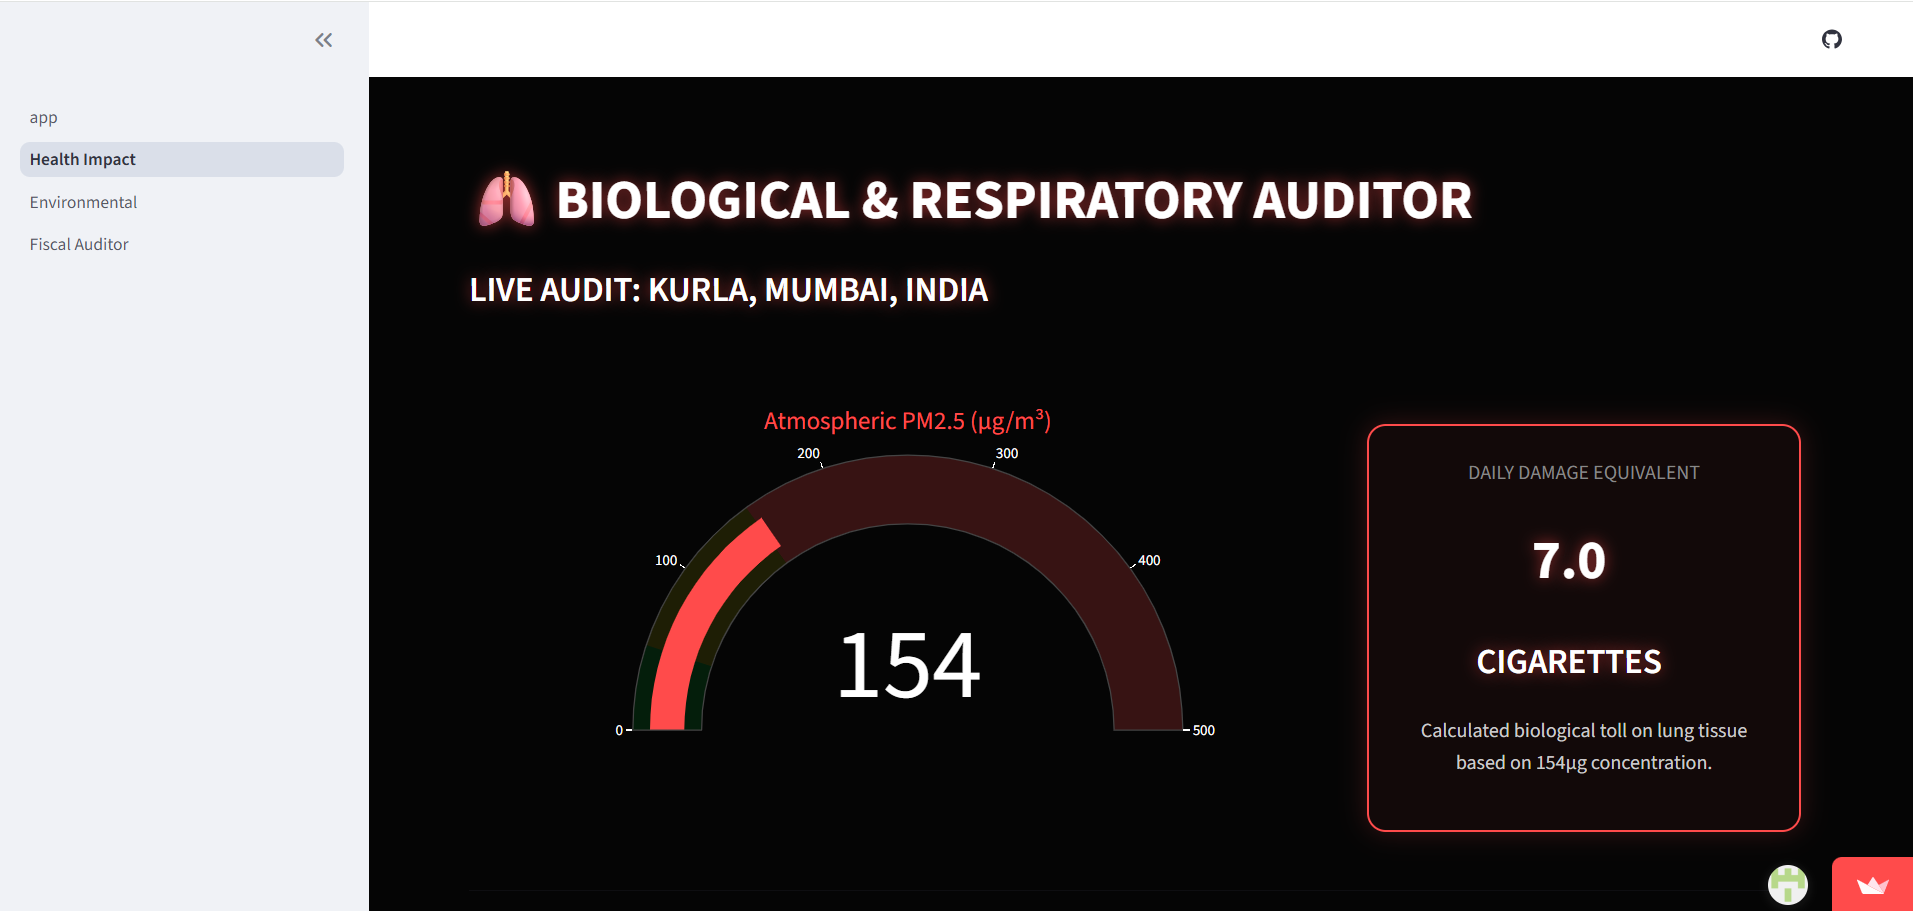
Real-time PM2.5 exposure visualized as direct biological damage — converting air quality into an equivalent daily smoking burden.
-
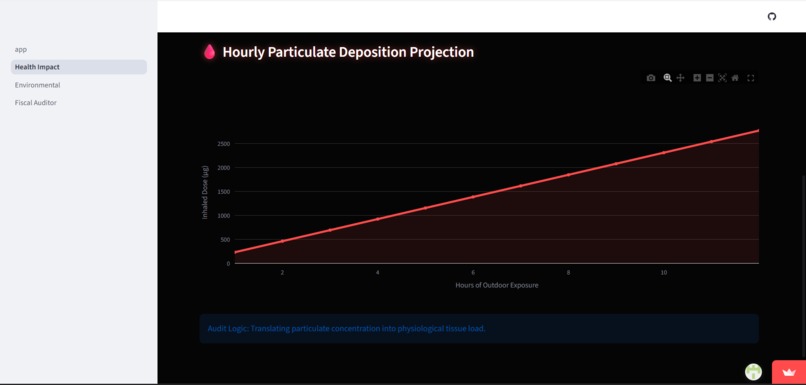
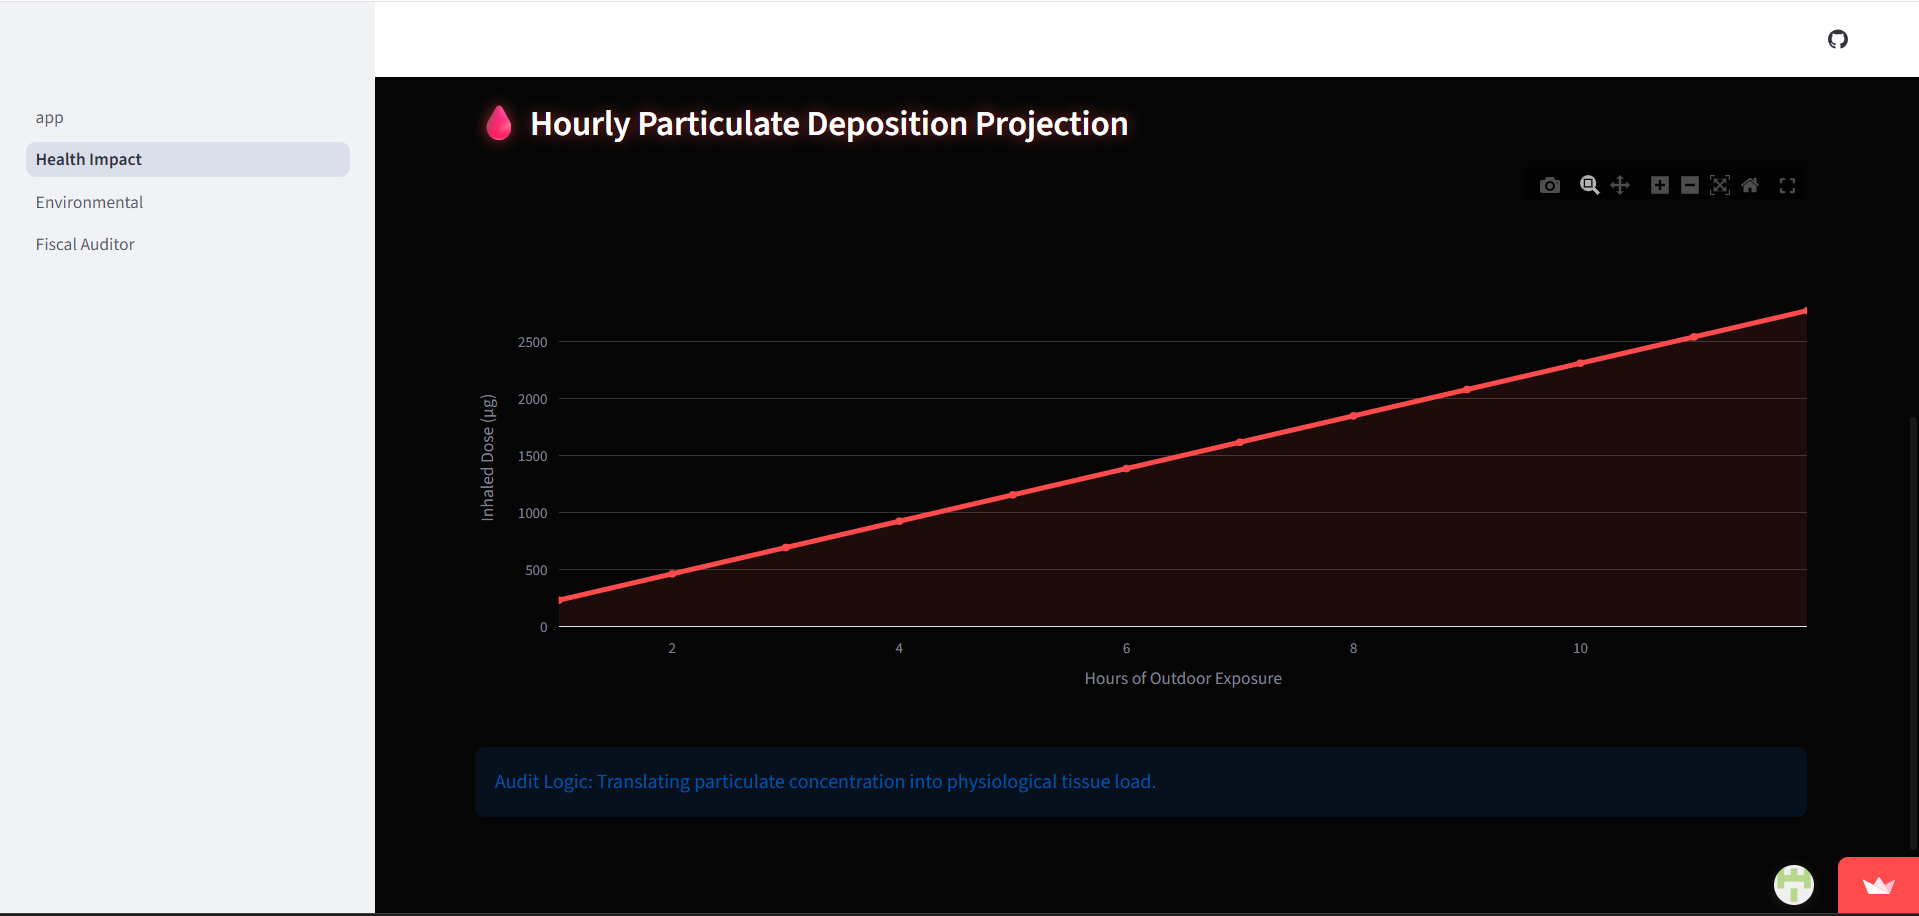
Projected accumulation of inhaled particulate matter over time, showing how prolonged outdoor exposure amplifies internal biological load.
-
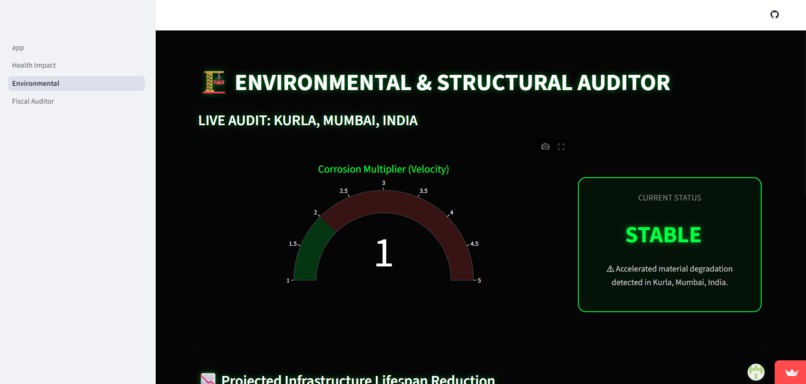
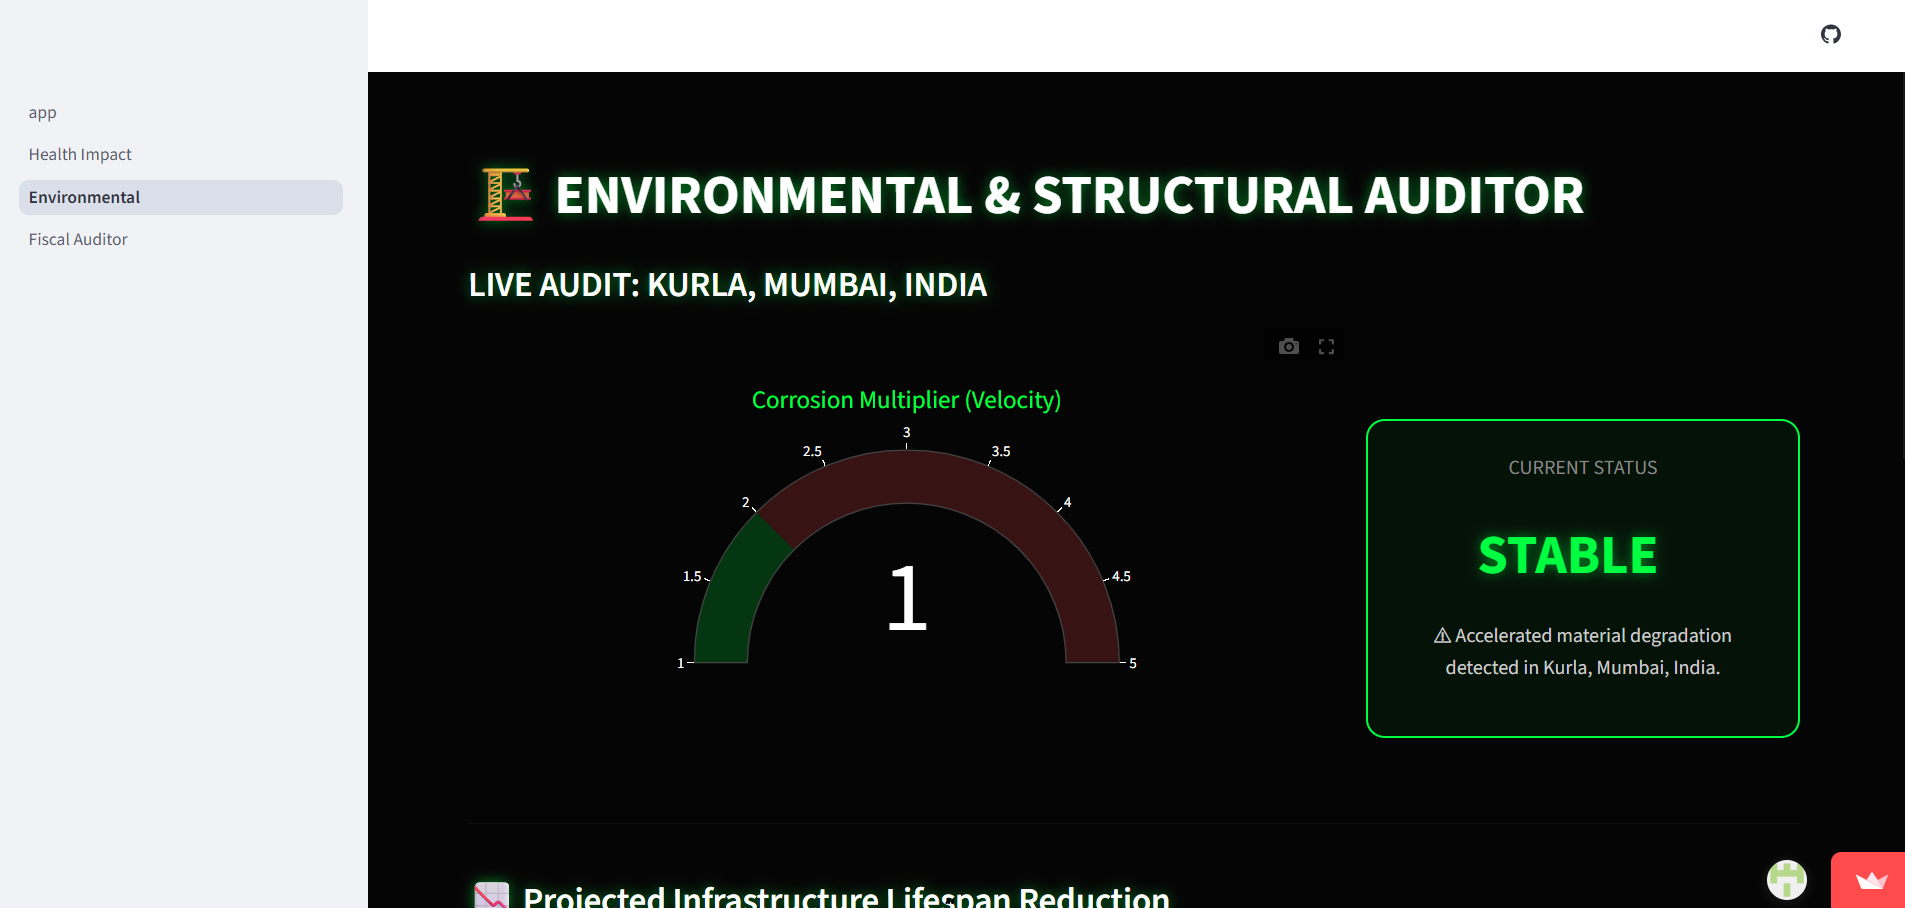
Assessment of pollution-driven corrosion velocity and material stress on urban infrastructure in Kurla, Mumbai.
-
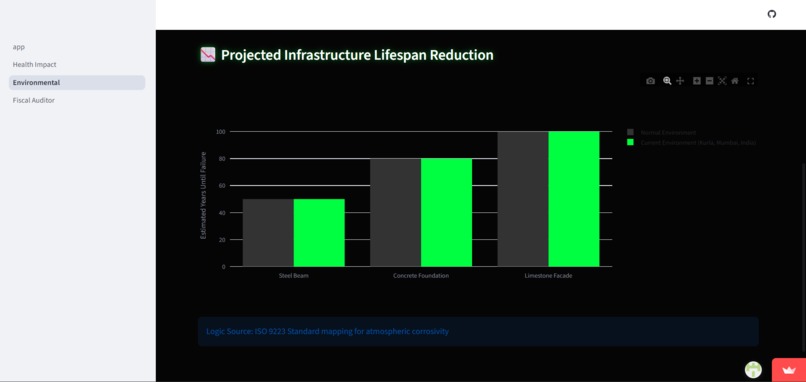
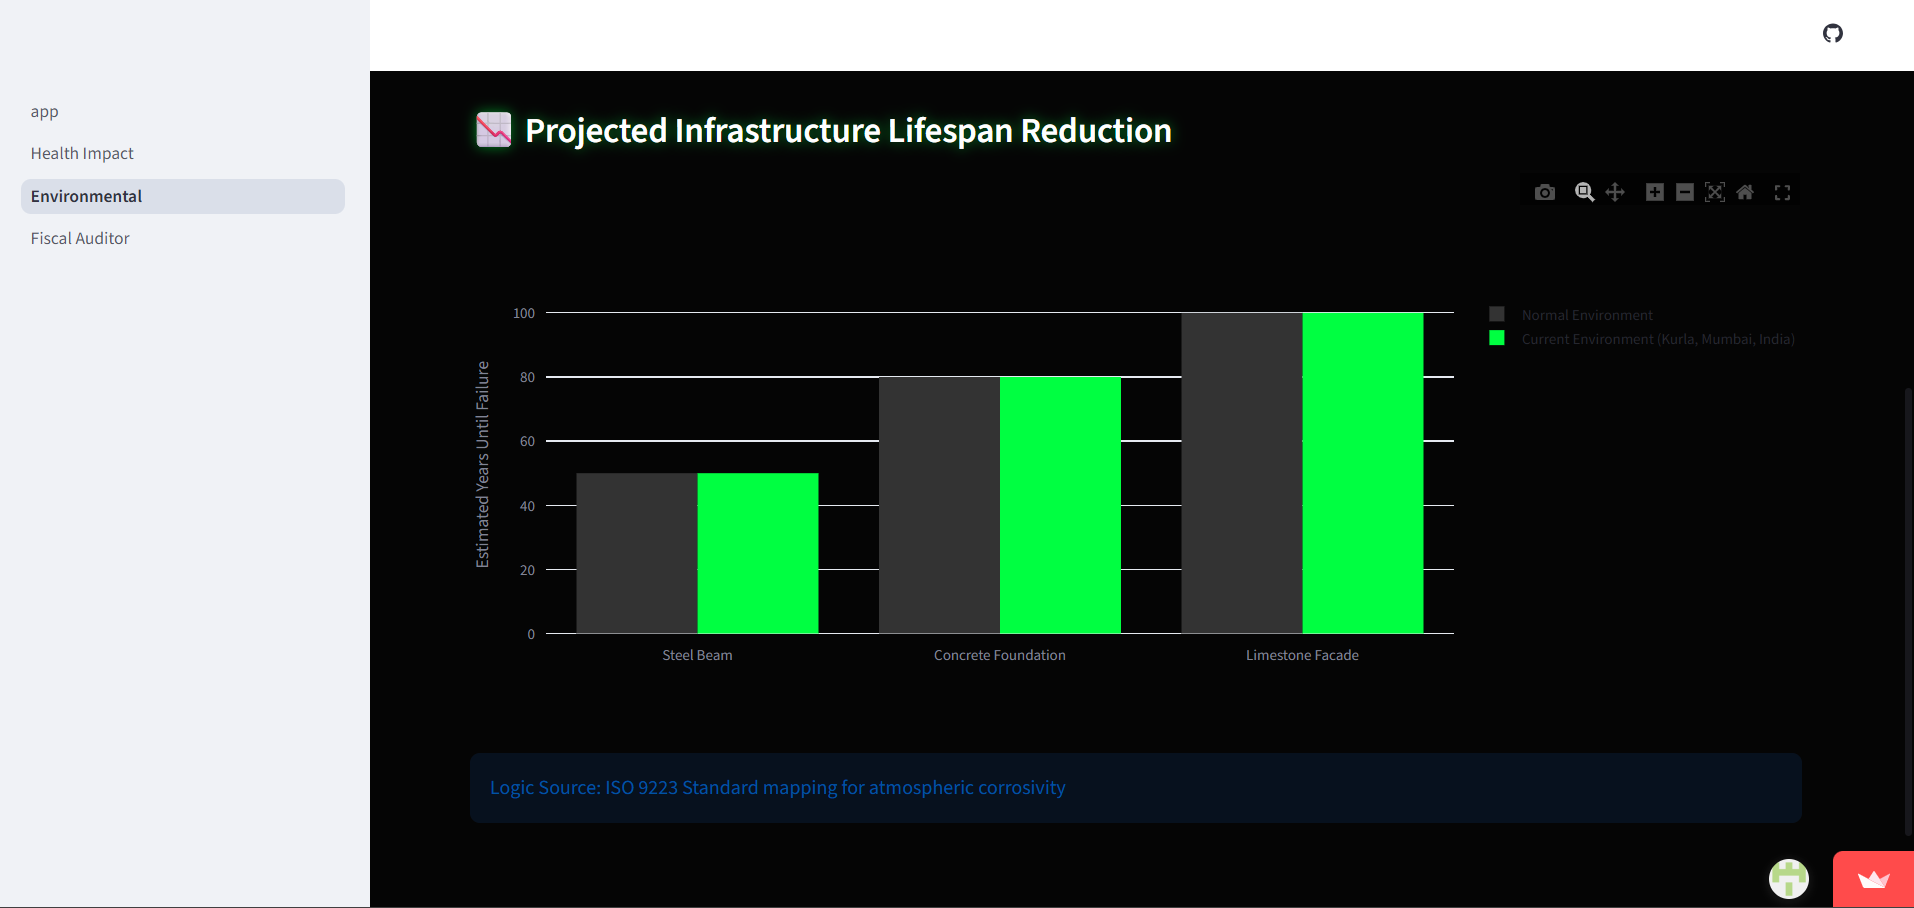
Comparative analysis of expected infrastructure lifespan under normal conditions versus current polluted environment.
-
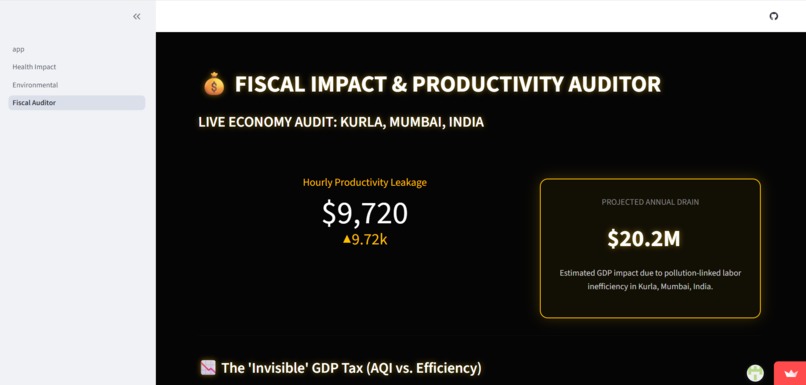
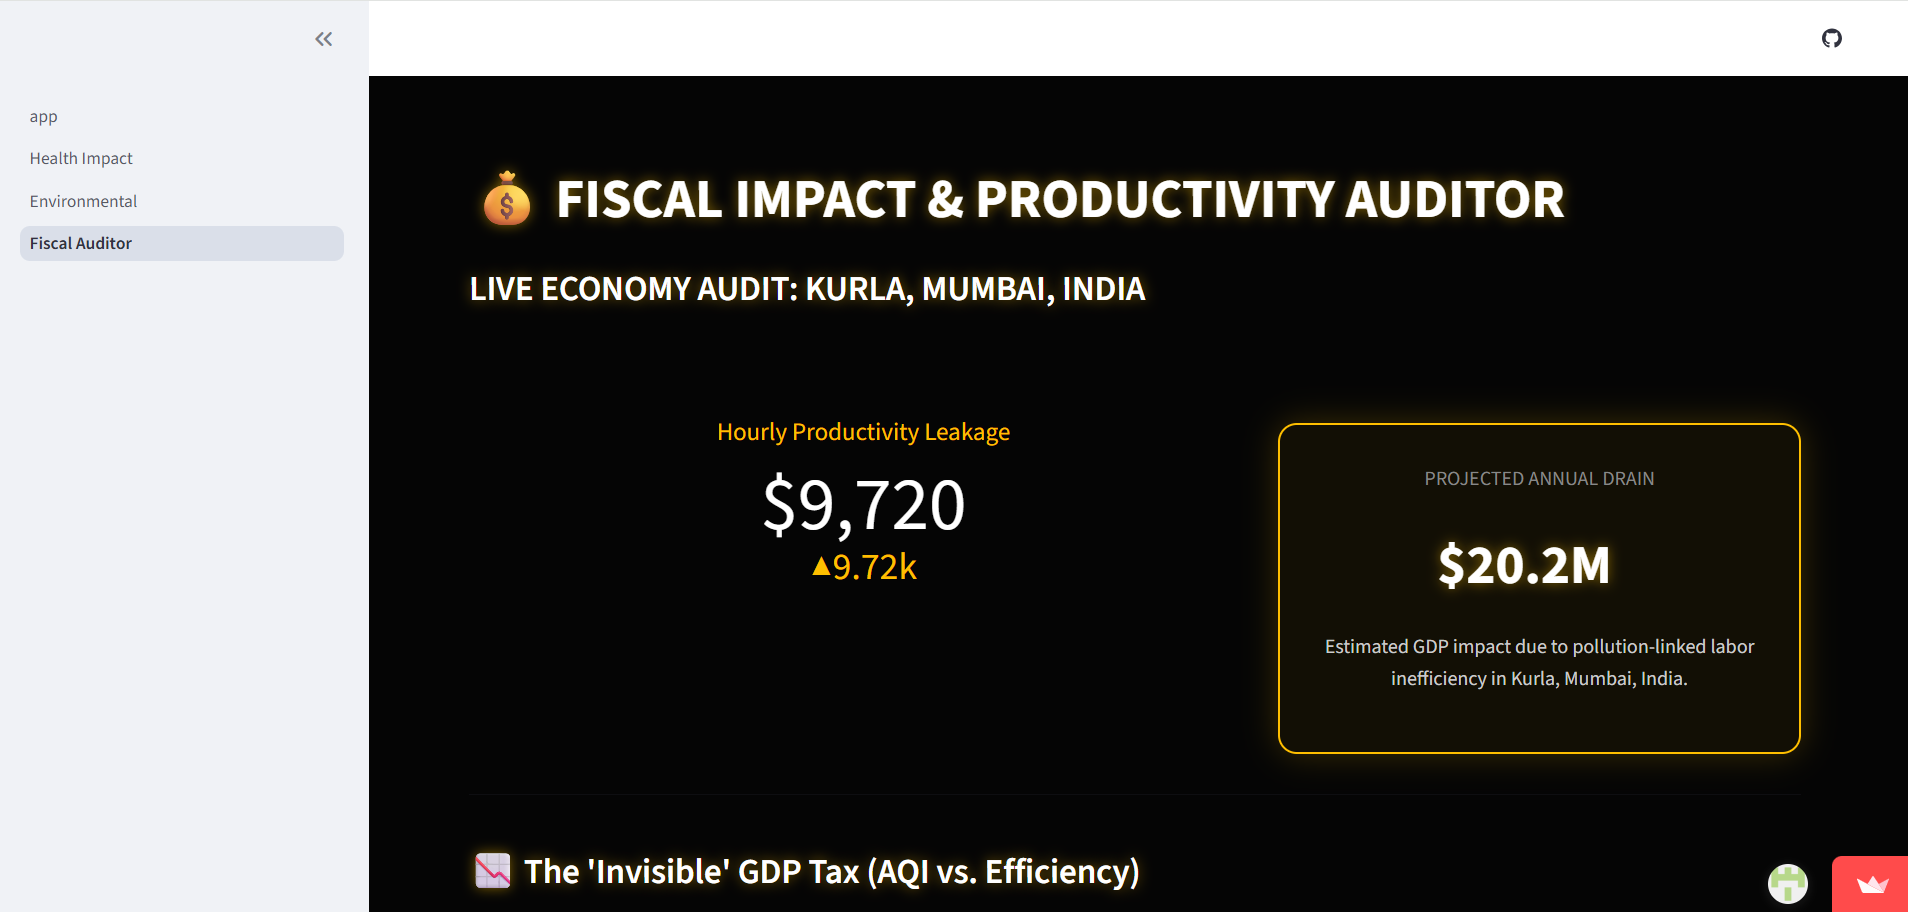
Quantifying pollution-induced productivity loss and translating air quality into real-time economic leakage.
-
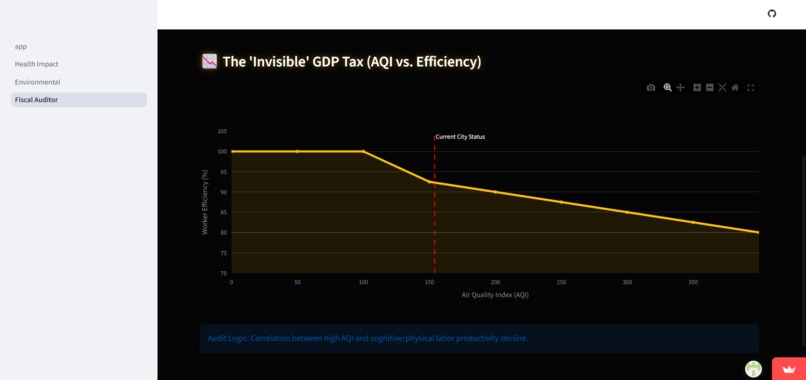
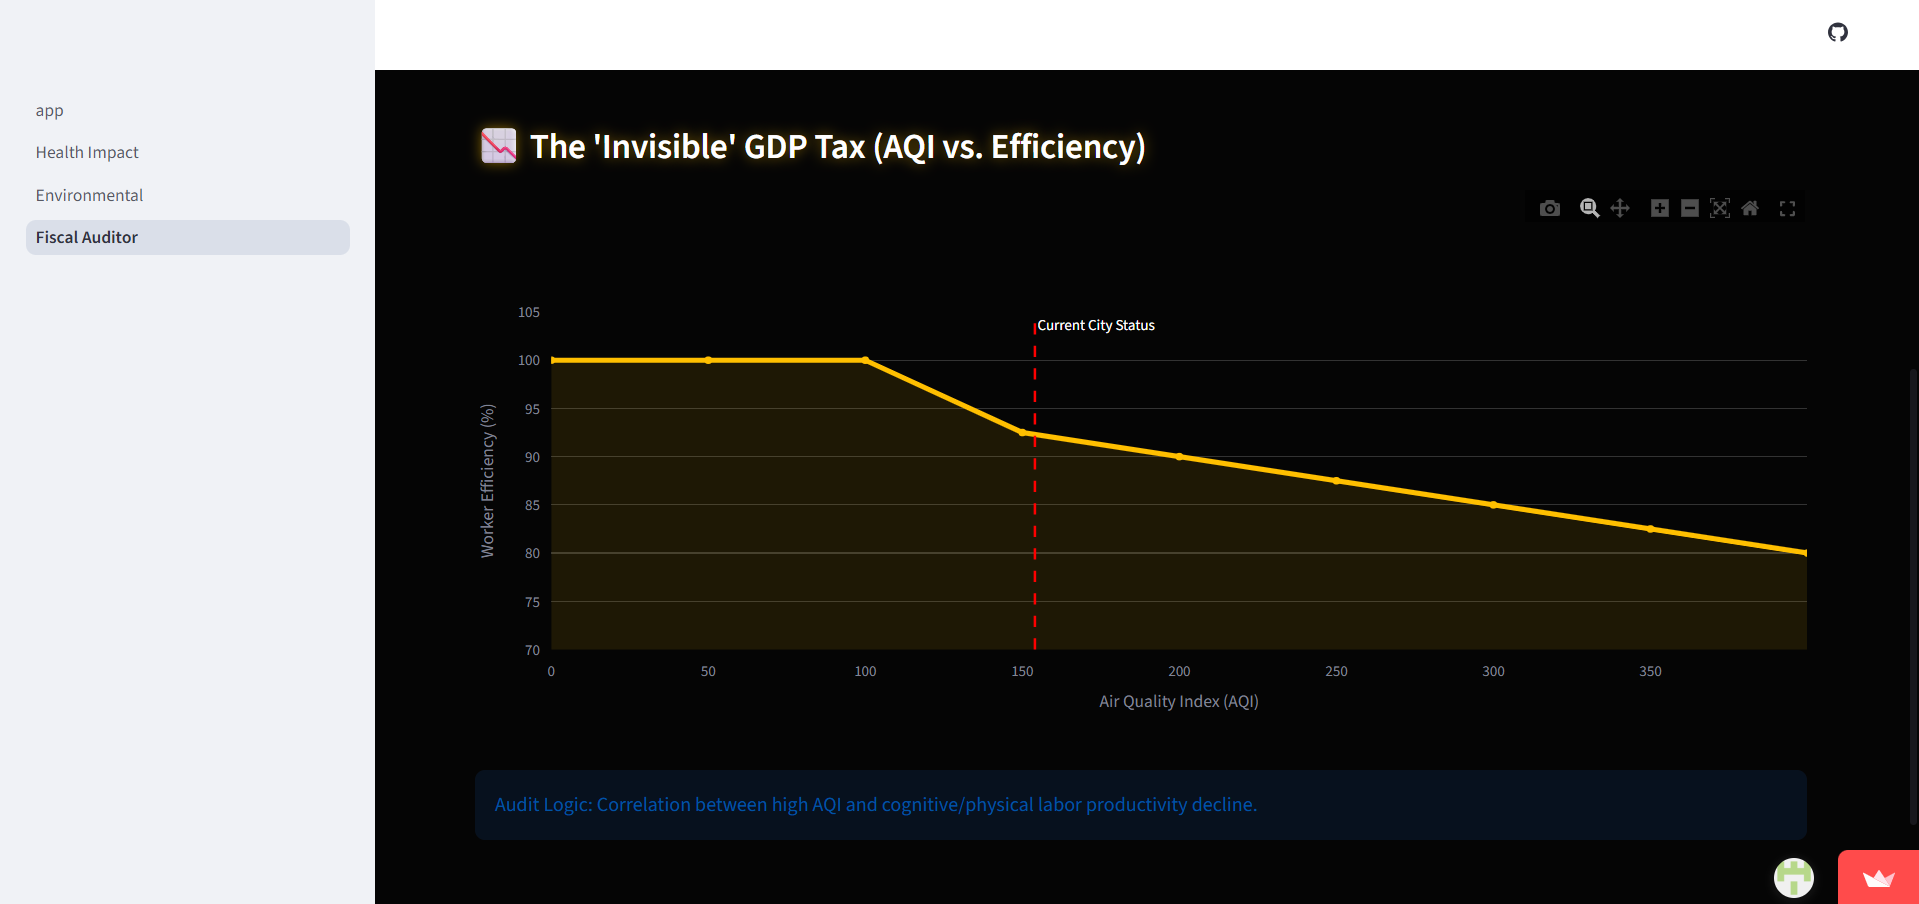
Correlation between rising AQI levels and declining worker efficiency, revealing pollution as a hidden tax on urban GDP.
Inspiration
Air pollution is often treated as a simple weather metric, like temperature or humidity. However, we realized that an AQI of 150 isn’t just a number—it’s a biological hazard, an ecological debt, and a fiscal drain on a city's economy. We were inspired to build a tool for the AR for Earth challenge that doesn't just "monitor" the air but "audits" the real-world consequences of pollution.
What it does
EcoAir Impact Monitor is an end-to-end AI Auditor that translates raw atmospheric data into actionable intelligence through a Triple-Audit Framework:
- Biological Audit: Calculates the respiratory strain and tissue load based on $PM_{2.5}$ and $O_{3}$ levels.
- Ecological Audit: Quantifies the "silent debt" of lost carbon sequestration in local greenery caused by pollutants.
- Fiscal Auditor: Predicts the hidden economic burden on healthcare systems due to pollution-related admissions.
How we built it
We architected the suite using a modular Python stack:
- Backend: Real-time data integration using the OpenWeather Air Pollution API to track $PM_{2.5}, PM_{10}, NO_{2},$ and $O_{3}$.
- Frontend: A multi-page Streamlit dashboard designed for high-speed data rendering.
- Visualization: Interactive gauges and trend analysis built with Plotly.The Math: We implemented ecological models to estimate environmental loss:$$L_{CO2} = \sum (Area_{green} \times \text{Pollution Factor})$$And fiscal burden ($F_{b}$) based on the deviation from WHO safety limits ($35 \mu g/m^3$):$$F_{b} = \beta \times \max(0, PM_{2.5} - 35)$$
Challenges we ran into
The biggest hurdle was Data Translation. Turning raw $\mu g/m^3$ into "Fiscal Cost" required deep research into healthcare coefficients. Technically, we also navigated complex Python Indentation and Syntax logic while nesting our "AI Auditor Recommendation" engine within the Streamlit multi-page framework. Ensuring that the app remained responsive while performing real-time calculations was a major focus.
Accomplishments that we're proud of
We successfully transformed abstract scientific data into a tool that speaks to three different audiences: doctors, environmentalists, and city treasurers. We are particularly proud of our AI Recommendation Engine, which provides clear, safe-zone vs. high-alert guidance based on biological limits rather than just raw numbers.
What we learned
We gained a deep understanding of how air quality directly affects urban economics. On the technical side, we mastered Multi-page Streamlit architecture, real-time API pipeline management, and the importance of clean, version-controlled code on GitHub.
What's next for EcoAir Impact Monitor
We plan to integrate Historical Predictive Auditing, using machine learning to forecast the "Fiscal Drain" of a city a week in advance. We also aim to add AR (Augmented Reality) overlays, allowing users to point their phones at the horizon and see the "Biological Audit" of the air they are currently breathing.

Log in or sign up for Devpost to join the conversation.