-
-
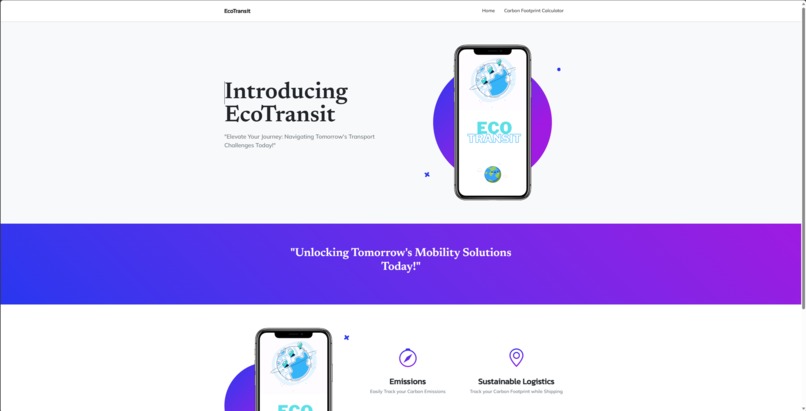
Home Page
-
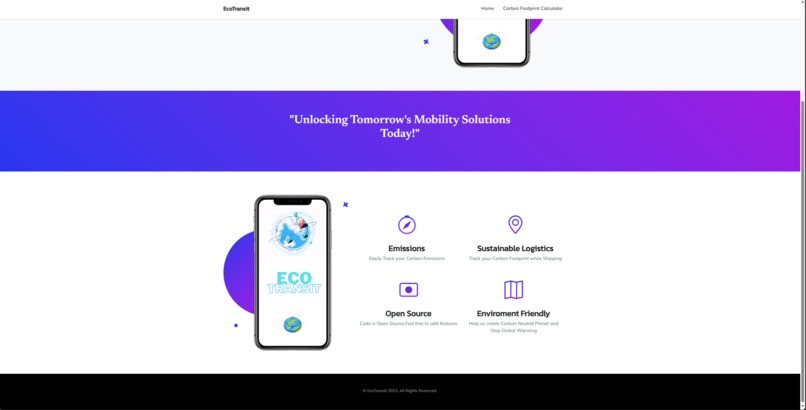
Home Page
-
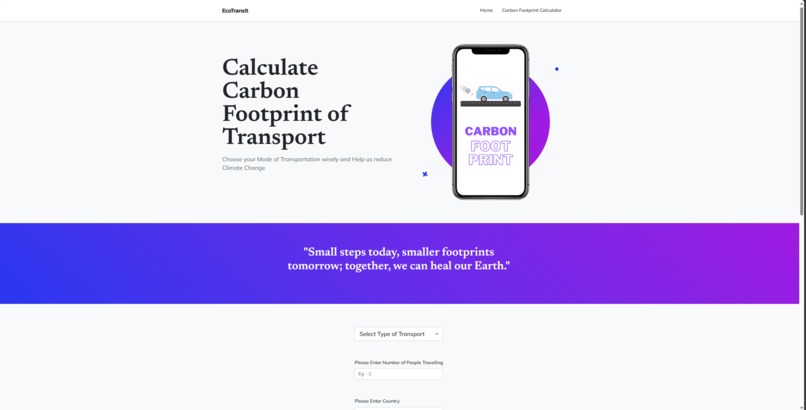
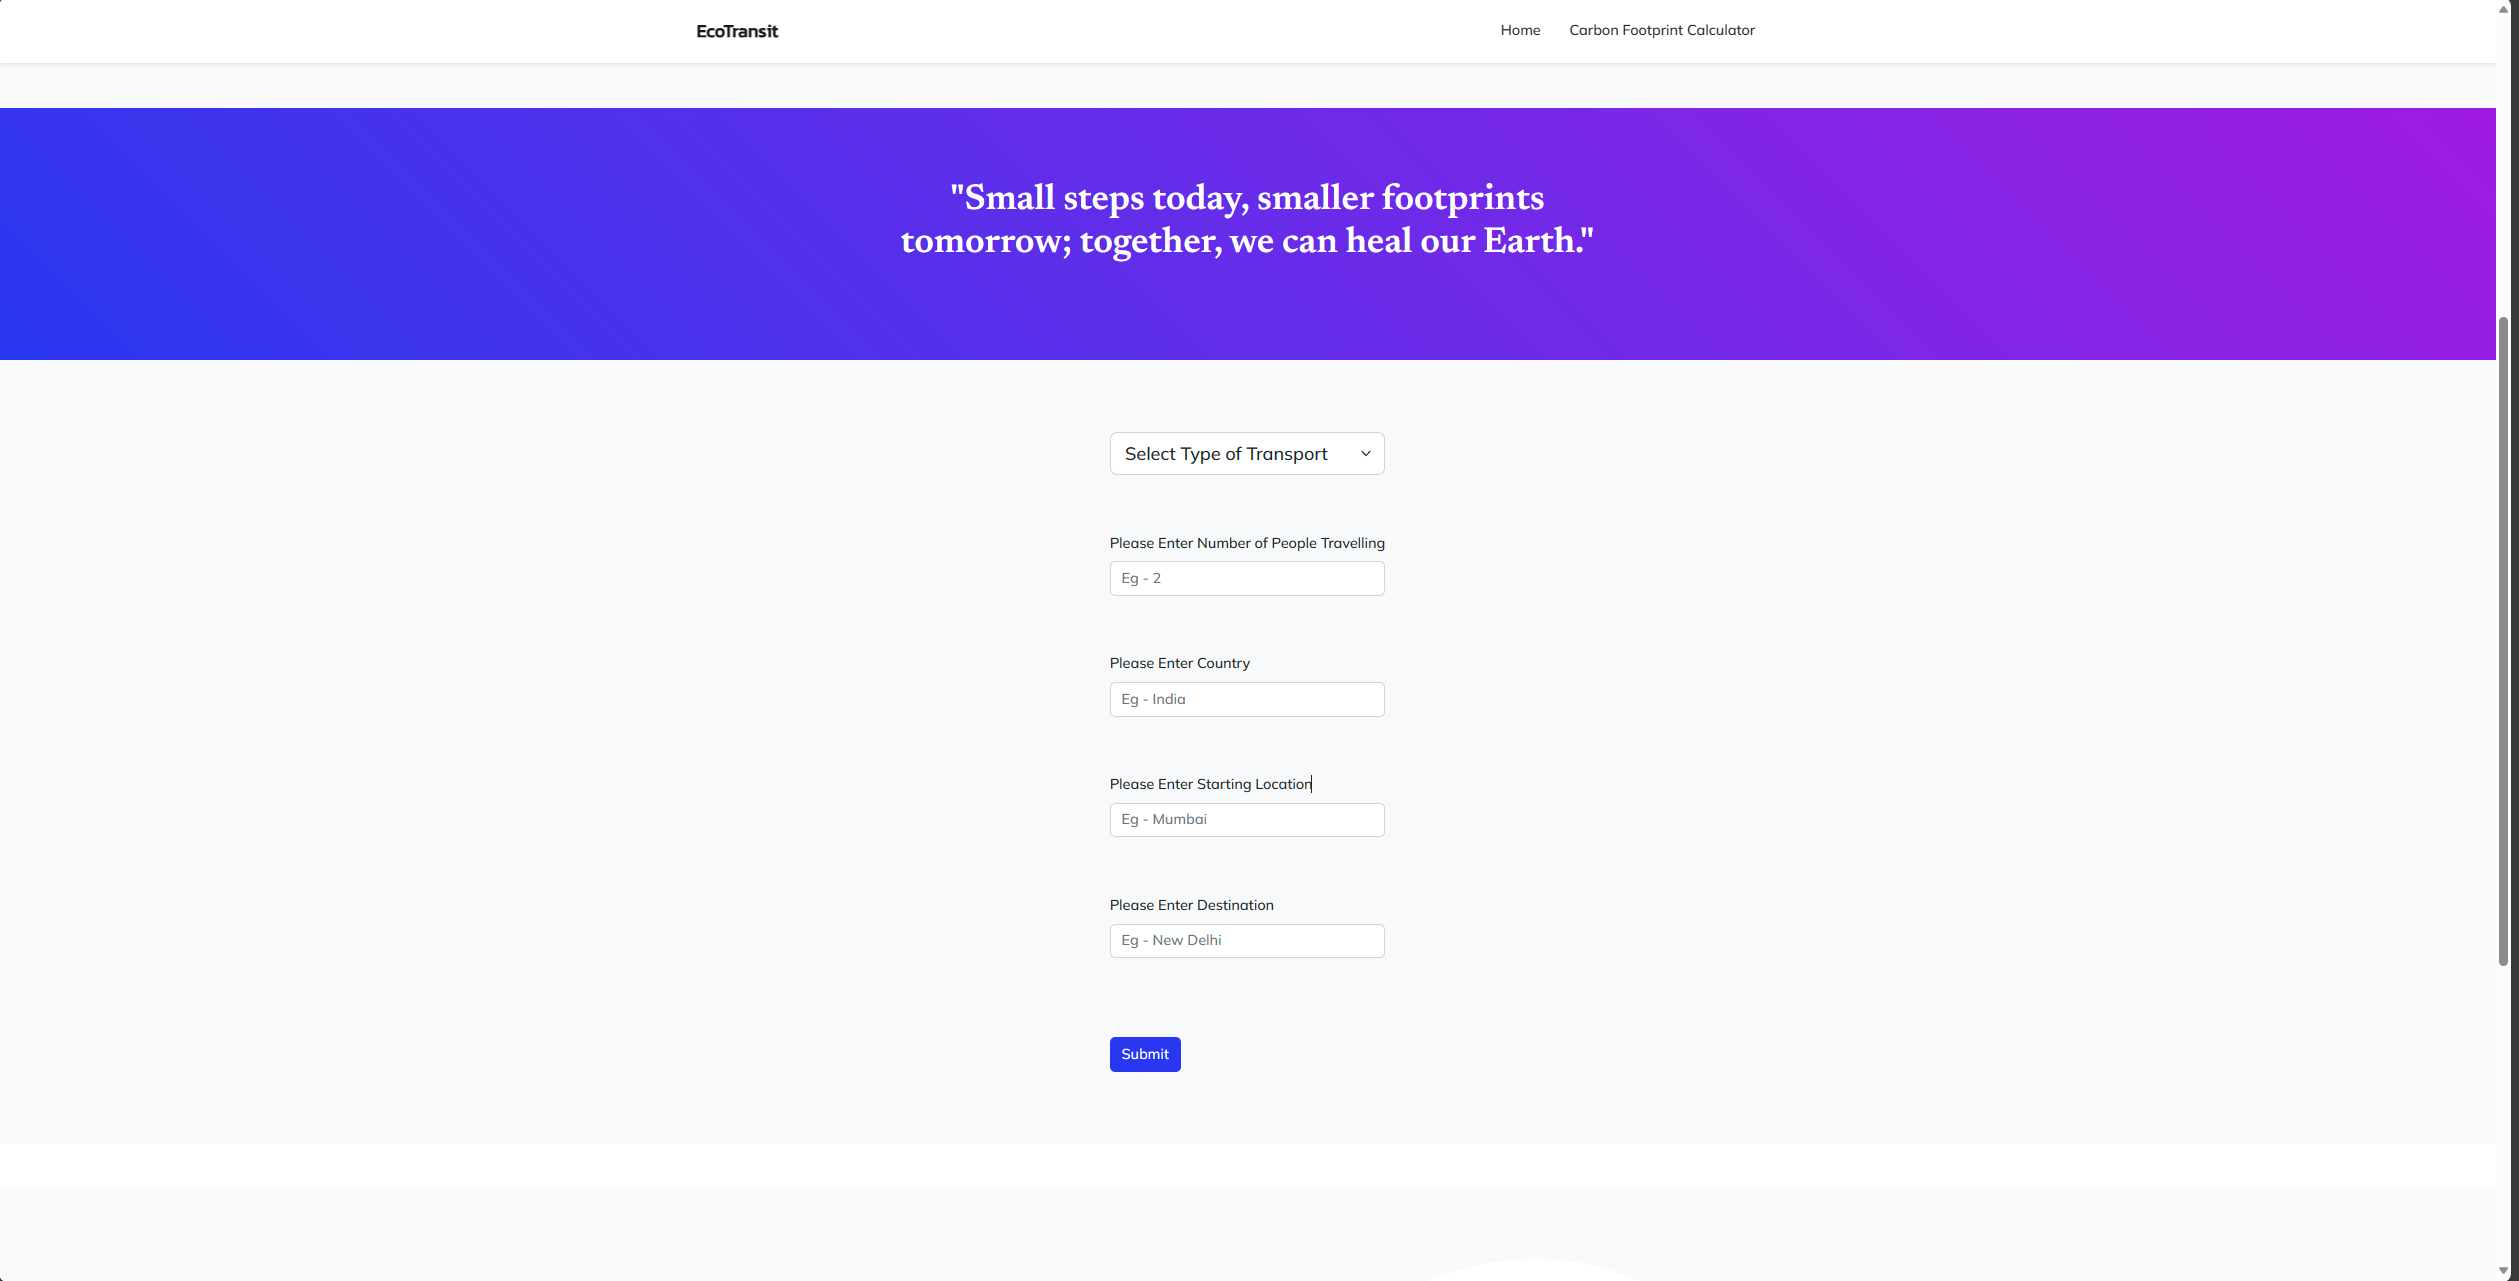
Calculator Page
-
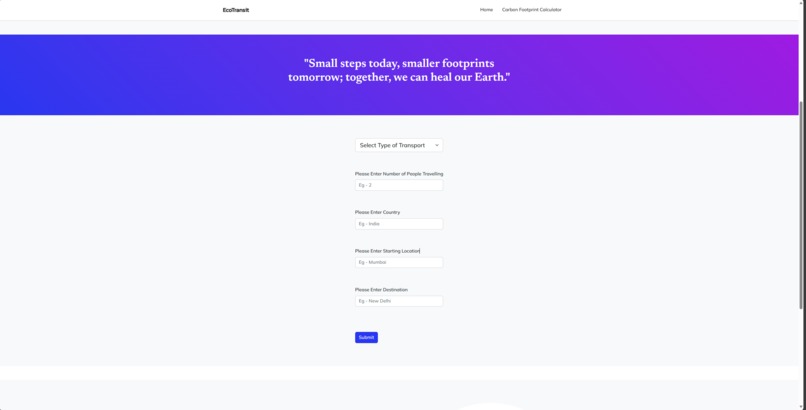
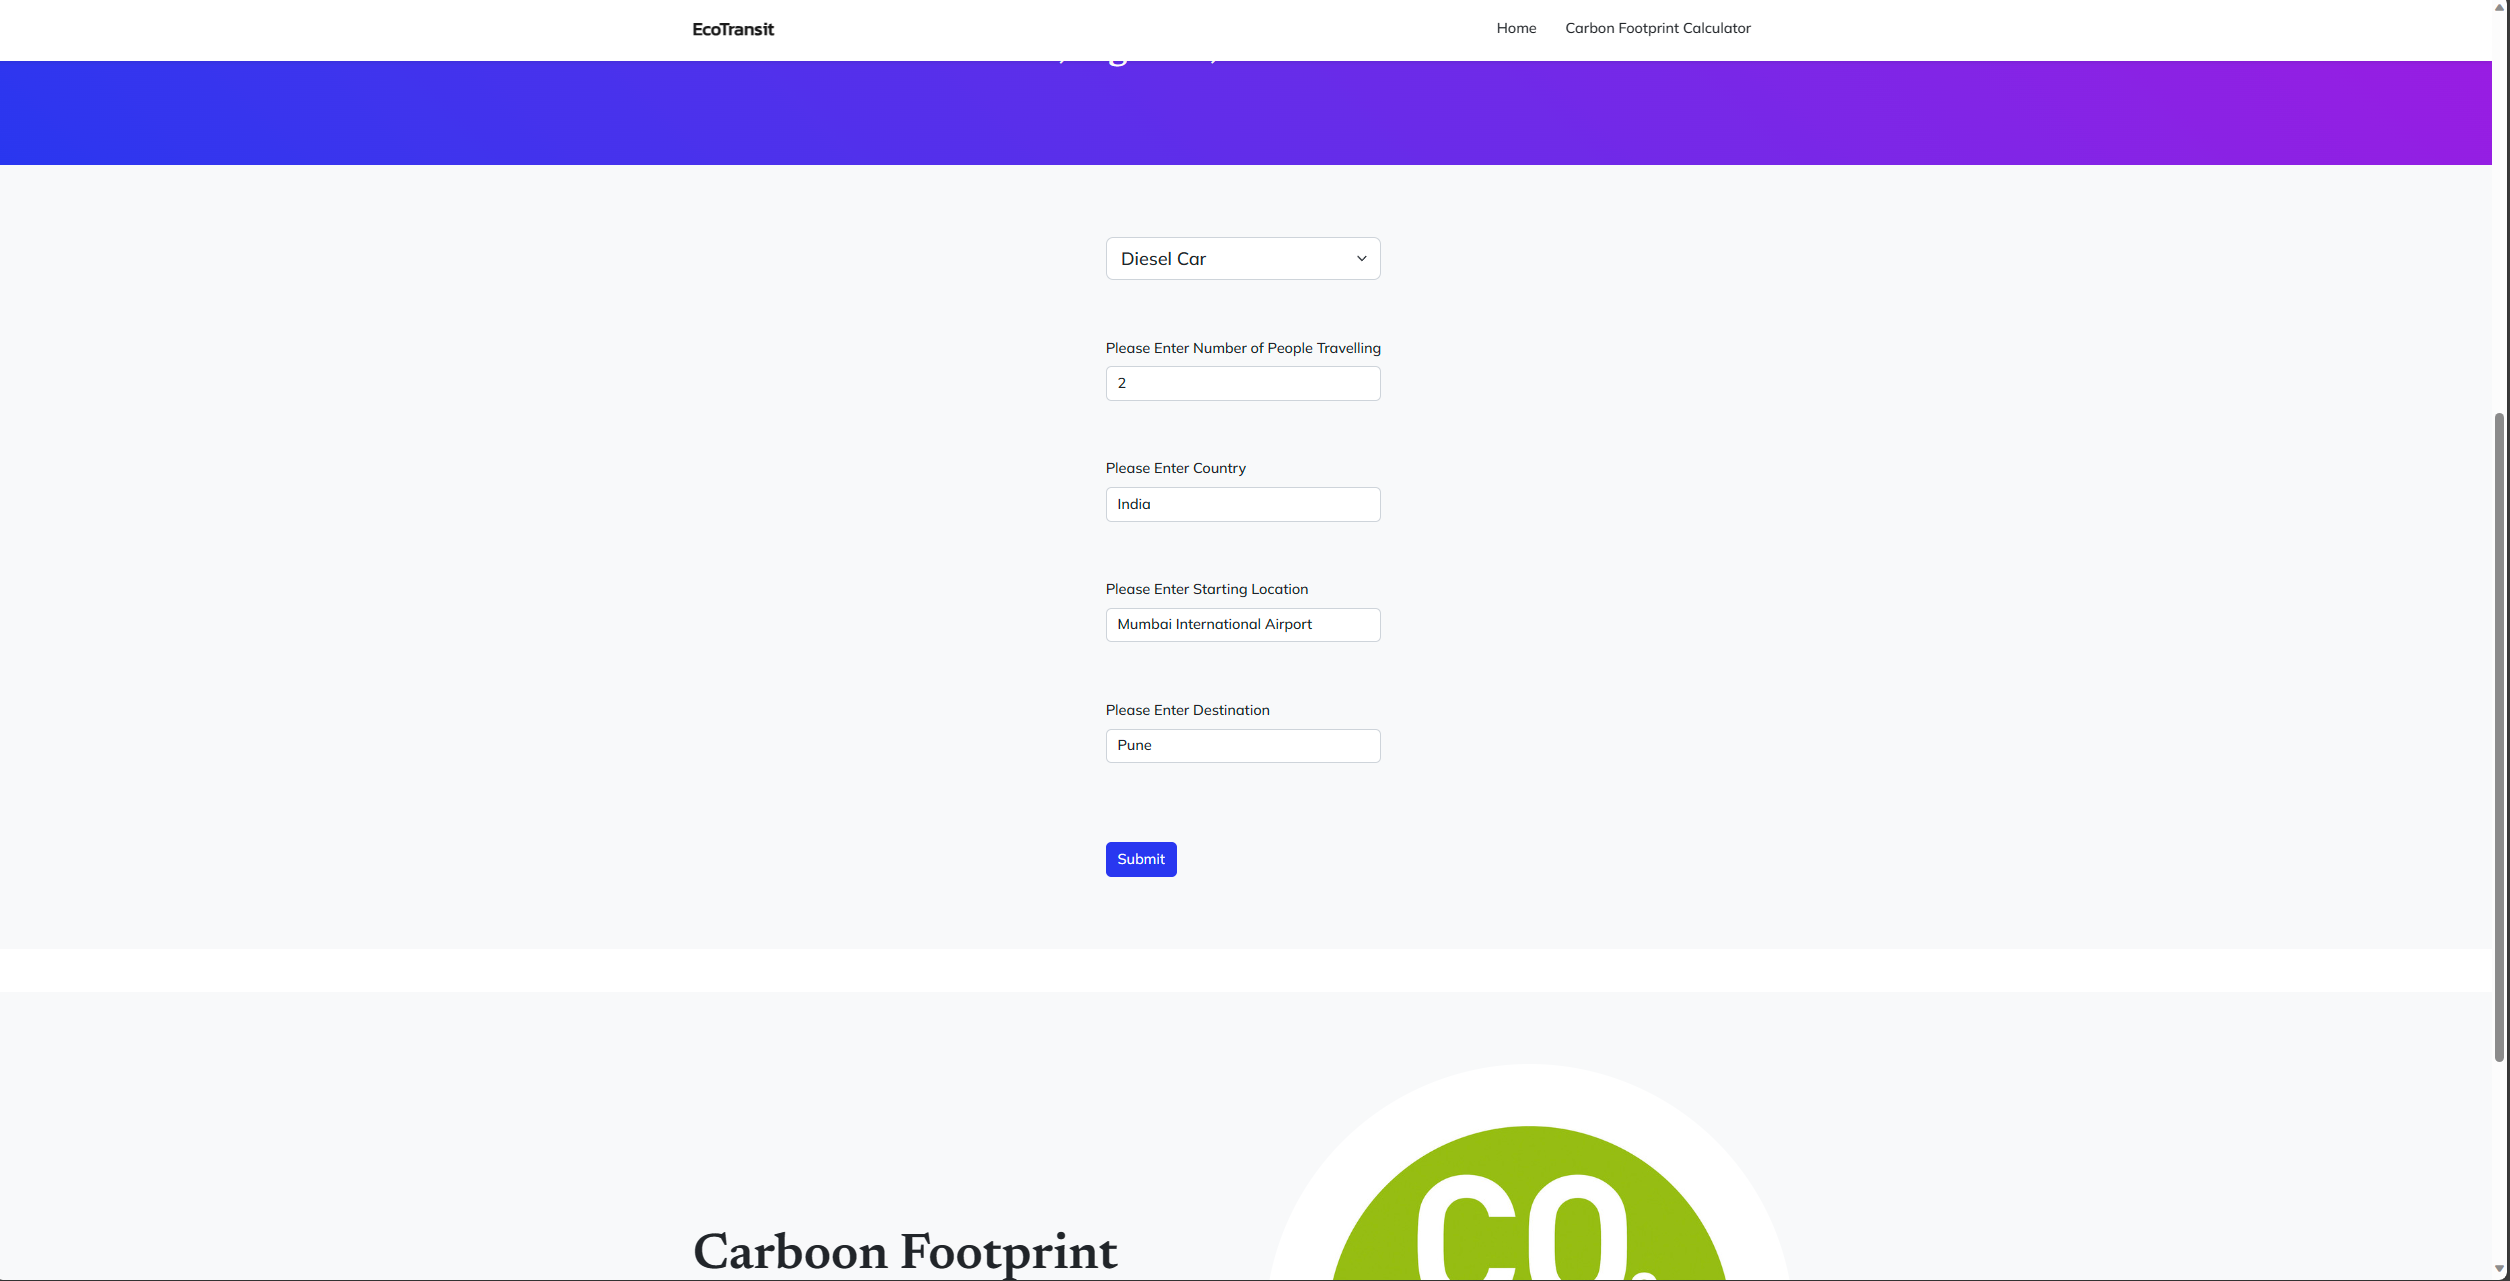
Input Values
-

Input Values
-

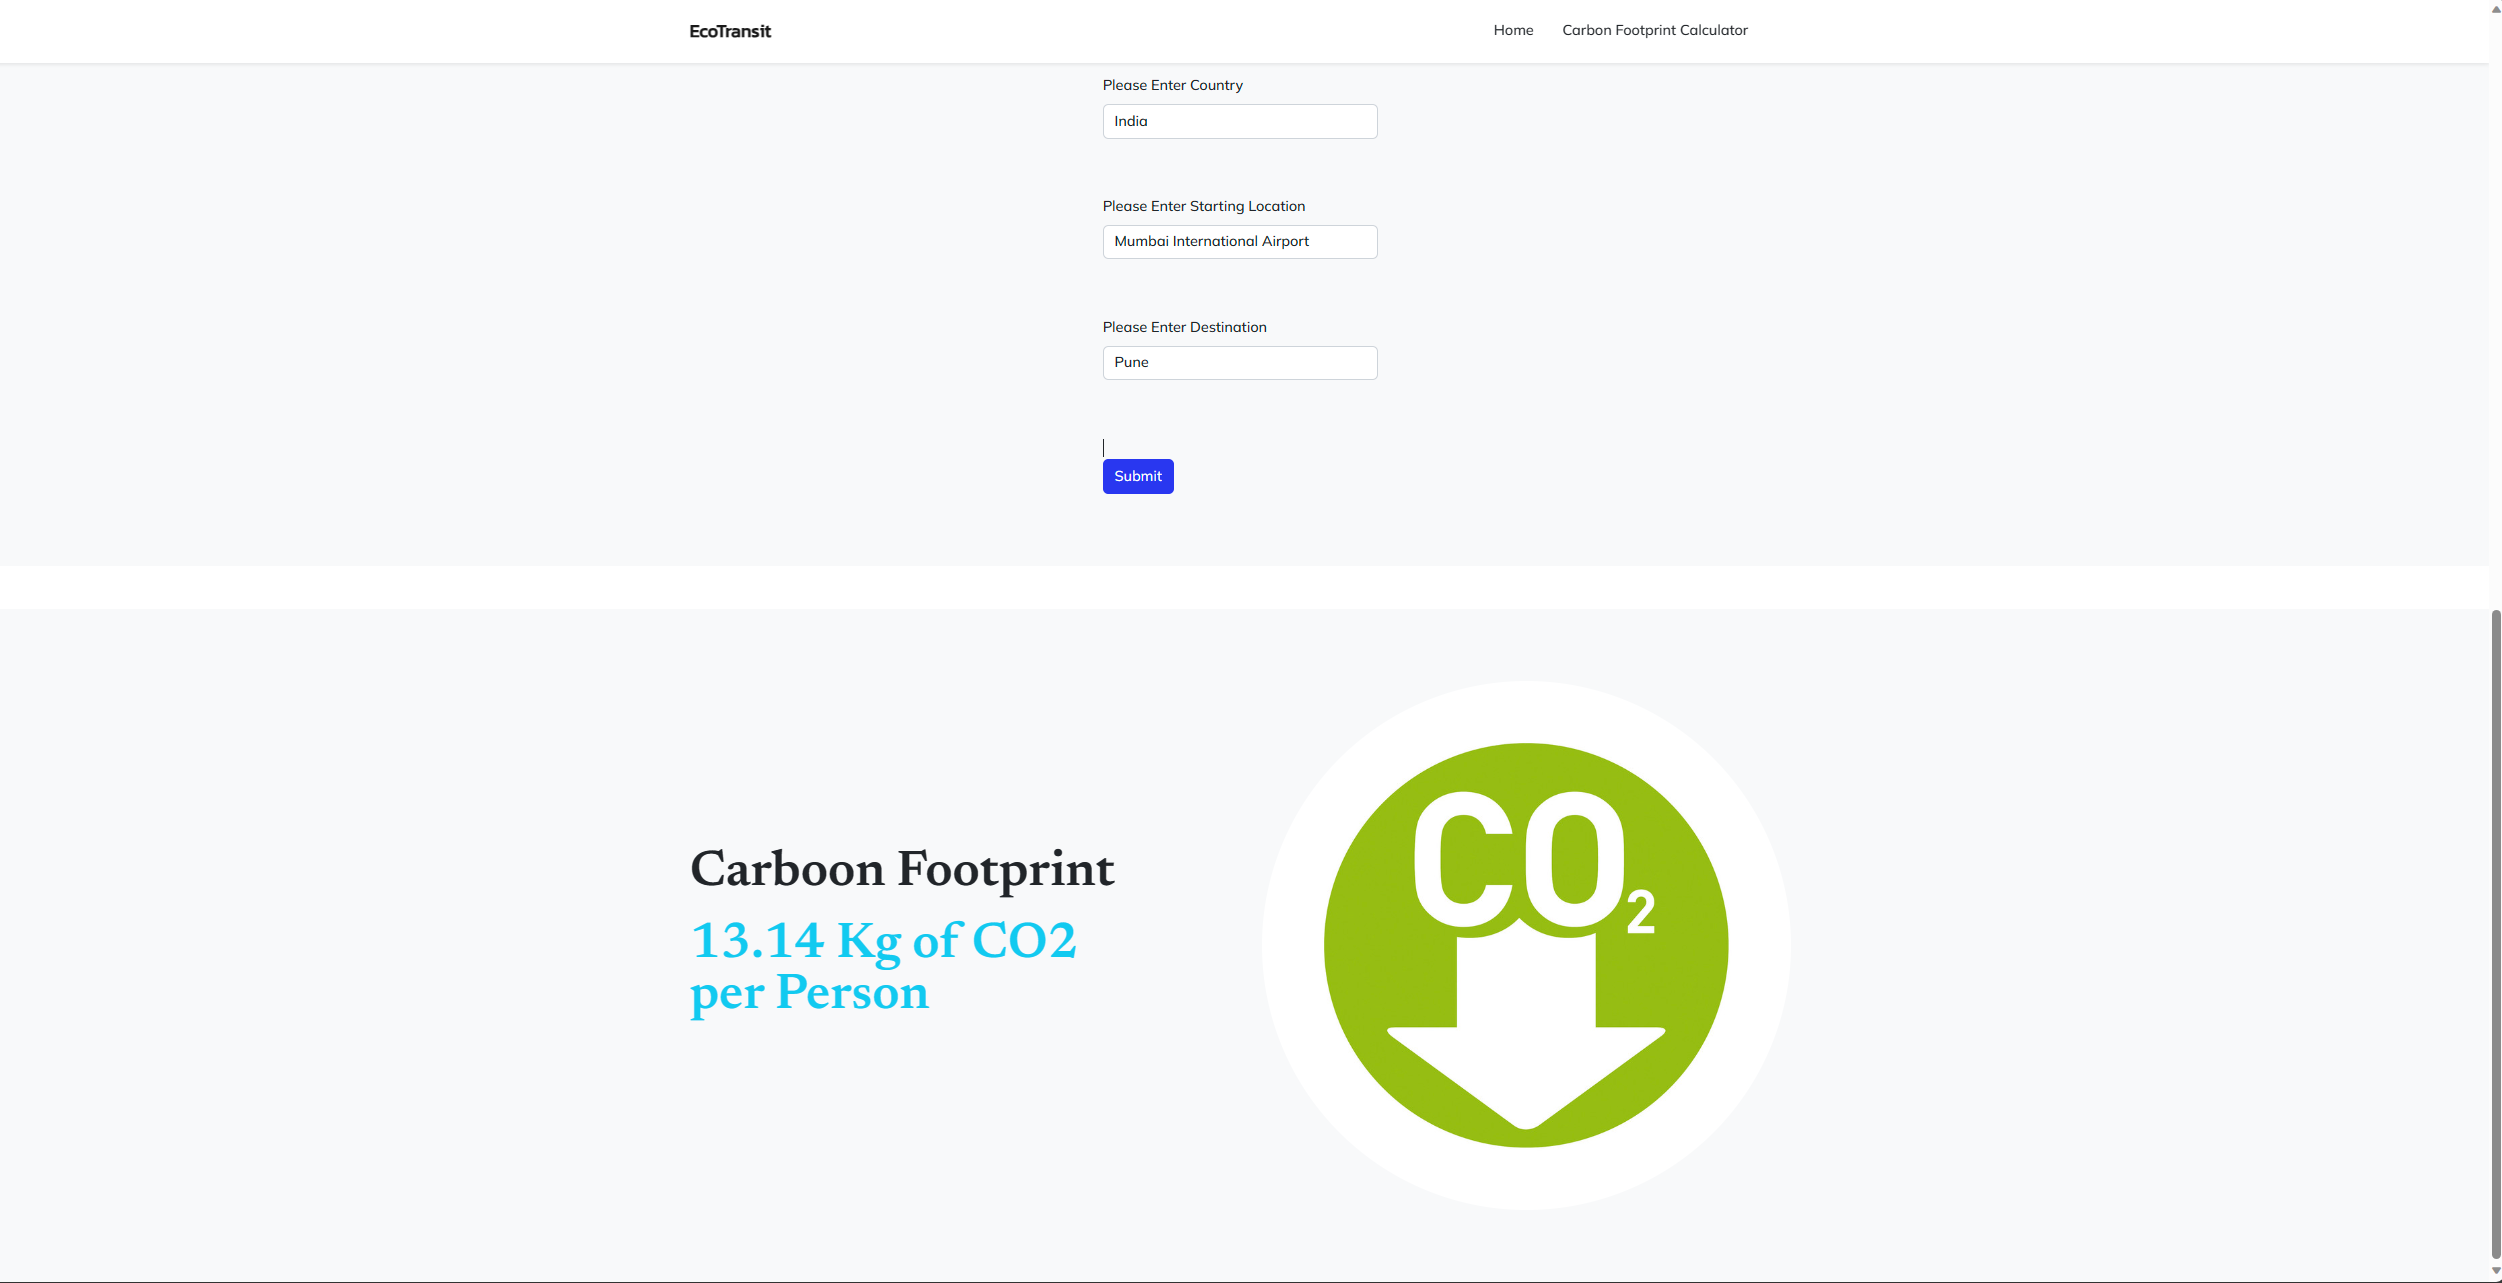
Result


EcoTransit
Inspiration💡
In today's world, climate change is an undeniable reality, and it's our collective responsibility to take meaningful actions to combat it. One significant contributor to carbon emissions is the transportation sector, with vehicles emitting tons of CO2 into the atmosphere every day. But what if we could empower individuals and organizations to make greener transportation choices by providing them with a tool to calculate and reduce their carbon footprint? This is the inspiration for our hackathon project : "EcoTransit".
What it does ❓
EcoTransit is a revolutionary project that aims to calculate the carbon footprint of a vehicle, whether it's a Diesel Car,Petrol Car, Bus, or Motorcycle. It helps you calculate the total carbon footprint of the journey that you're going to make.Just input your Destination,Origin,No of Person Travelling Together and Type of Vehicle that you're choosing to travel and you'll easily get your total carbon emission that you'll make over the journey.
How we built it❓
We are using Flask as our Backend.We have used MapBox API to calculate the total distance between places.The Total Road Distance is then inputted into a formula which we created using an help of some articles and research papers.
Once the calculation is complete in the Backend, it will show your total Carbon Footprint on the Web.
Challenges we ran into🎢
During the development of the EcoTransit, we encountered several challenges that required innovative solutions and teamwork. Here are some of the key challenges we faced:
- Less Availiabilty Of Data on Carbon Footprint
- Less Time Availibilty of Time
Accomplishments that we are proud of 🏆
We were able to develop Eco Transit that would be able to make suggestions to empower users to make more sustainable transportation choices.
What we learned📚
We learnt about Mapbox API and a lot about Carbon Footrprint during this hackathon and How to Reduce it as well.
What's next for EcoTransit🔭
We are planning to add feature to help user store their emission data so they can easily see thier transportation emissions at the end of month in for of Beautiful Data Visualisation.

Log in or sign up for Devpost to join the conversation.