-
-
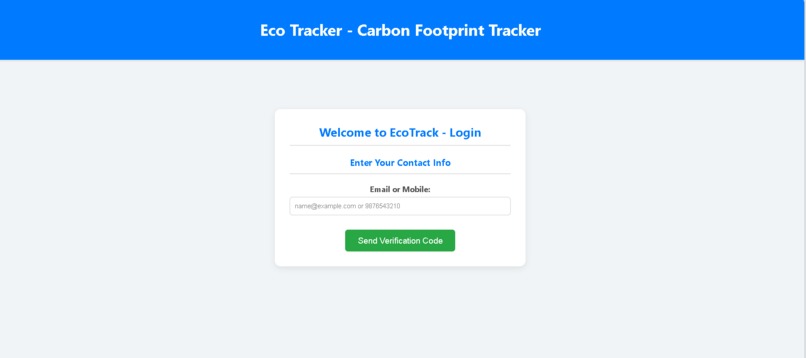
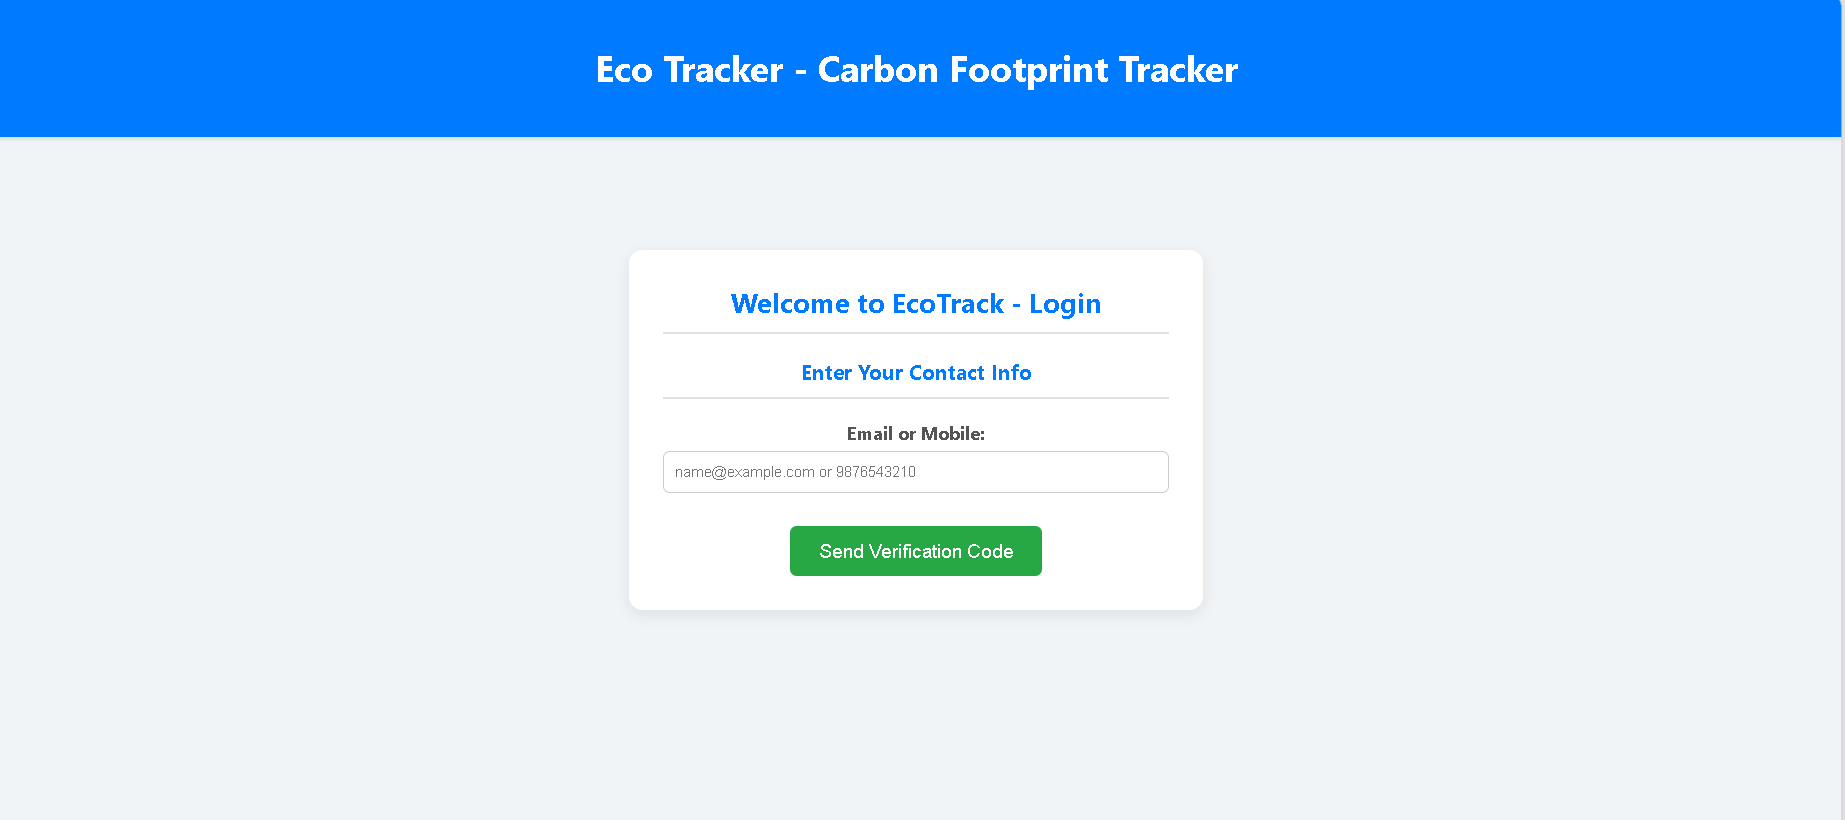
Login_page
-
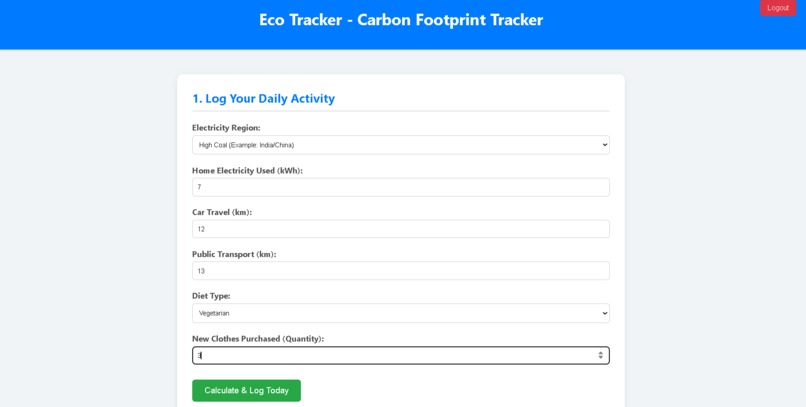
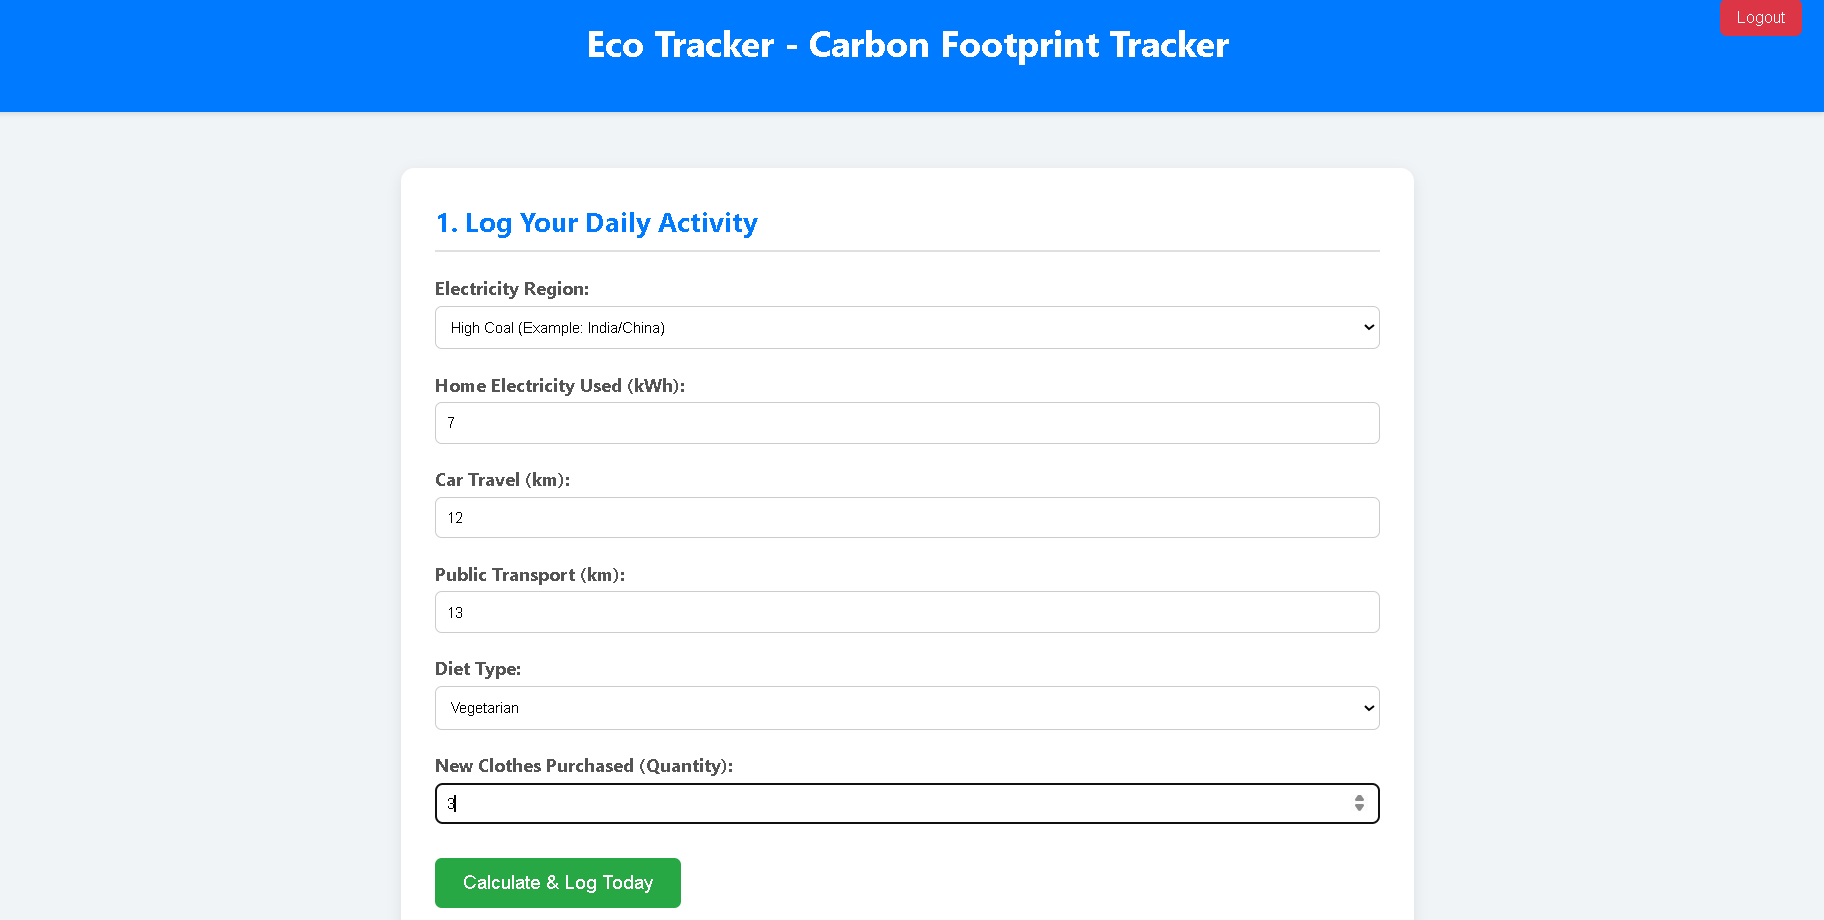
Daily Activity
-

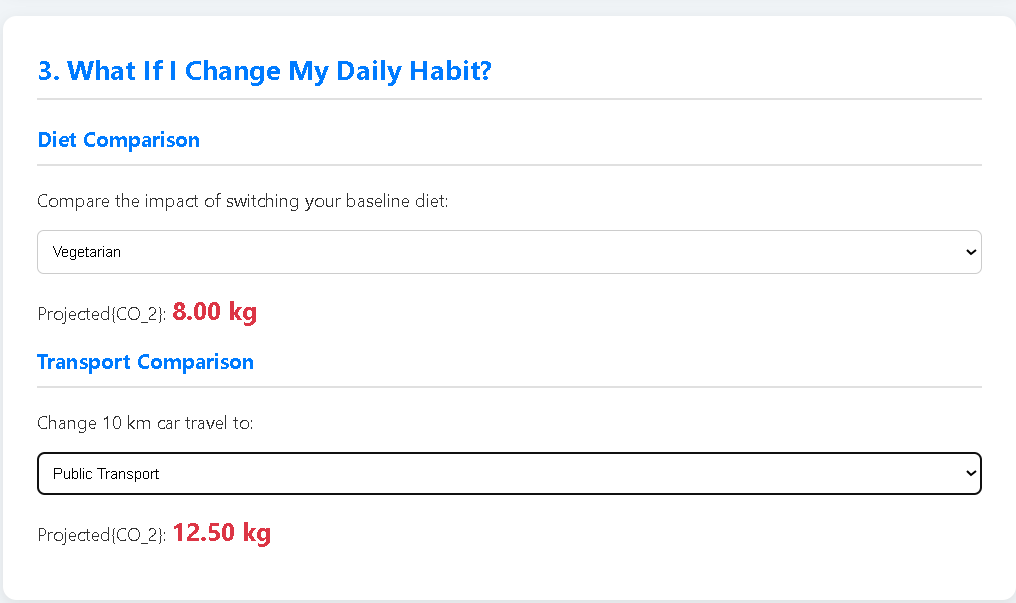
What_if_I_change
-
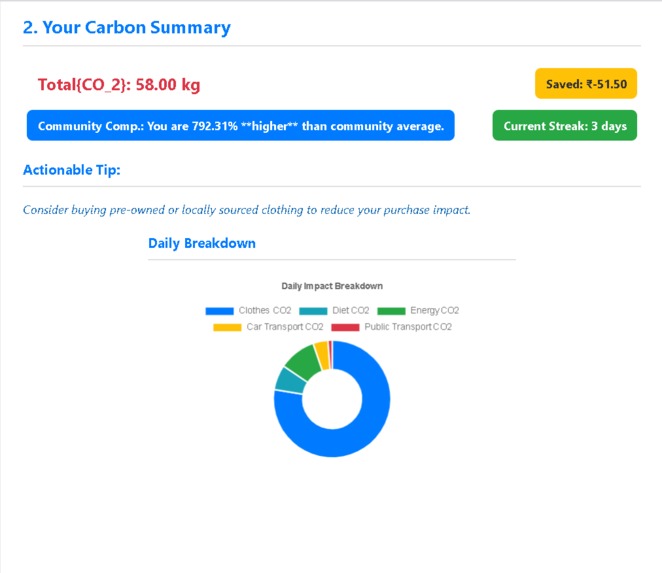
Summary

Inspiration
The core inspiration for EcoTrack stemmed from a simple observation: Individual action is the most overlooked and unquantified factor in the global climate crisis. While large corporations track their carbon output precisely, the average person has no clear, engaging way to measure the environmental cost of their daily commute, diet, or home energy usage. We realized that sustainability efforts often fail due to a lack of transparency and personal motivation. We wanted to build a secure, gamified platform that converts the abstract concept of a 'carbon footprint' into a visible, manageable personal metric, making sustainability accessible and engaging for everyone.
What it does
EcoTrack is a full-stack, personalized carbon footprint tracker designed to drive behavioral change through real-time data and gamification. Key Features:
- Secure Authentication: Users log in using a secure Mock OTP System (Email/Mobile) to ensure data persistence and security.
- Granular Logging: It allows users to log detailed activities, including Regional Electricity Usage (accounting for different grid CO2 factors), precise travel breakdowns, and consumption habits.
- Real-Time Breakdown (Pie Chart): The main dashboard immediately displays a large, clear Daily Breakdown of the user's {CO2} emissions by category (e.g., transport, diet, energy).
- Advanced Metrics: It provides tangible, motivating stats: a persistent Streak Counter for daily logging, Community Peer Comparison, and an estimated 'Money Saved' metric to tie sustainability directly to personal finance.
- 'What If' Scenarios: Users can interactively test the future impact of lifestyle changes (e.g., switching from driving to biking, or high-meat to vegan diet) before committing.
How we built it
Backend (Server Logic): We used Python with the Flask framework to handle all business logic, CO2 calculation APIs, and routing. We implemented regional emission factors using a Python dictionary for complex, mock calculations.
Database (Persistence): MySQL was used to manage persistent data, including two core tables: the users table (for authentication/OTP) and the daily_logs table (for storing user-specific footprint and streak data).
Frontend (User Interface): We used foundational web technologies—HTML, CSS, and JavaScript—to create a clean, responsive, single-page application experience.
Visualization: We integrated the Chart.js library to dynamically generate the Daily Breakdown Pie Chart, providing immediate and impactful visual feedback upon logging.
Challenges we ran into
Database and User Session: Integrating reliable, user-specific data tracking from MySQL (linking logs to user_id) and managing the mock session/login flow was complex, requiring careful debugging of SQL queries and Flask routing.
Front-End Consistency: Ensuring all dynamic content updates correctly after a single log—including calculating the total {CO2}, updating the streak, refreshing the financial metrics, and simultaneously drawing the Daily Breakdown Chart—required extensive JavaScript promise handling.
Data Visualization: Initially, the chart was drawn outside of its container. We resolved this by using advanced CSS aspect ratio techniques (padding-bottom with percentage width) to ensure the chart remains perfectly responsive and contained, making the final presentation clean and professional.
Accomplishments that we're proud of
Successful Full-Stack Integration: We successfully implemented secure user flow (Login Log Data Persistence) using Python, MySQL, and JavaScript, a major achievement for a hackathon.
Actionable Metrics: We are proud of integrating the financial impact (Money Saved) and community comparison metrics, which turn passive environmental data into competitive, tangible user benefits.
Professional UX: We created a polished, single-page web application with a responsive design and an interactive 'What If' planning tool that significantly enhances user experience and demonstration quality.
What we learned
Server-side Persistence: Deepening our understanding of database design, SQL foreign keys, and using Python/Flask to manage user-specific data transactions.
Front-end Optimization: Mastering CSS techniques to ensure perfect responsiveness and integrating third-party libraries Chart.js, effectively into a dynamic environment.
Feature Integration: The complexity of weaving authentication, calculation, visualization, and gamification all together into a seamless user experience provided invaluable lessons in software architecture.
What's next for EcoTrack
Actual OTP Integration: Migrating the mock OTP system to a real authentication service like Firebase or Twilio to enable true global sign-up.
API Automation: Integrating with publicly available APIs (like those for local electricity grids or transportation services) to automatically fetch initial emission factors, further reducing manual input.
Long-Term Goal Setting: Allowing users to set and track personalized weekly and monthly reduction goals within the app.


Log in or sign up for Devpost to join the conversation.