-
-
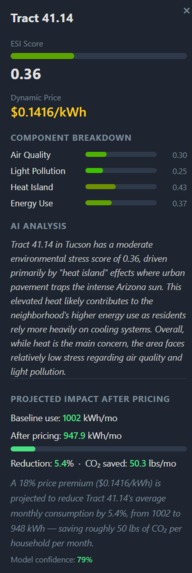
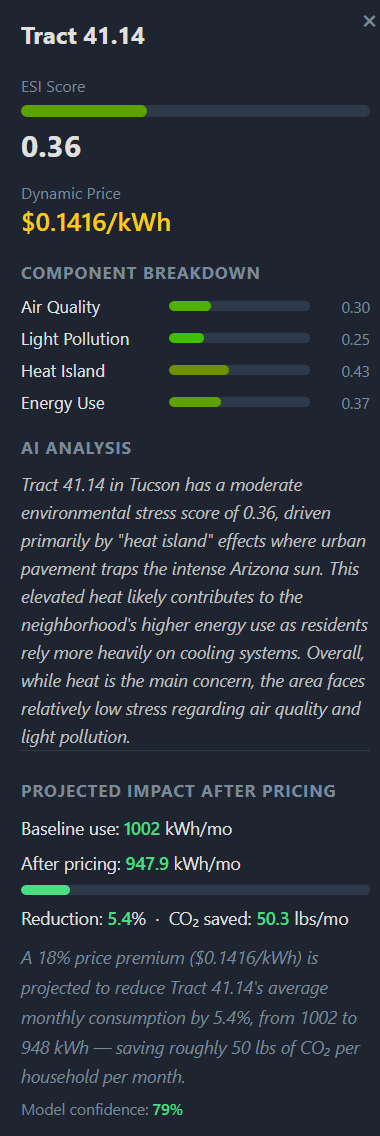
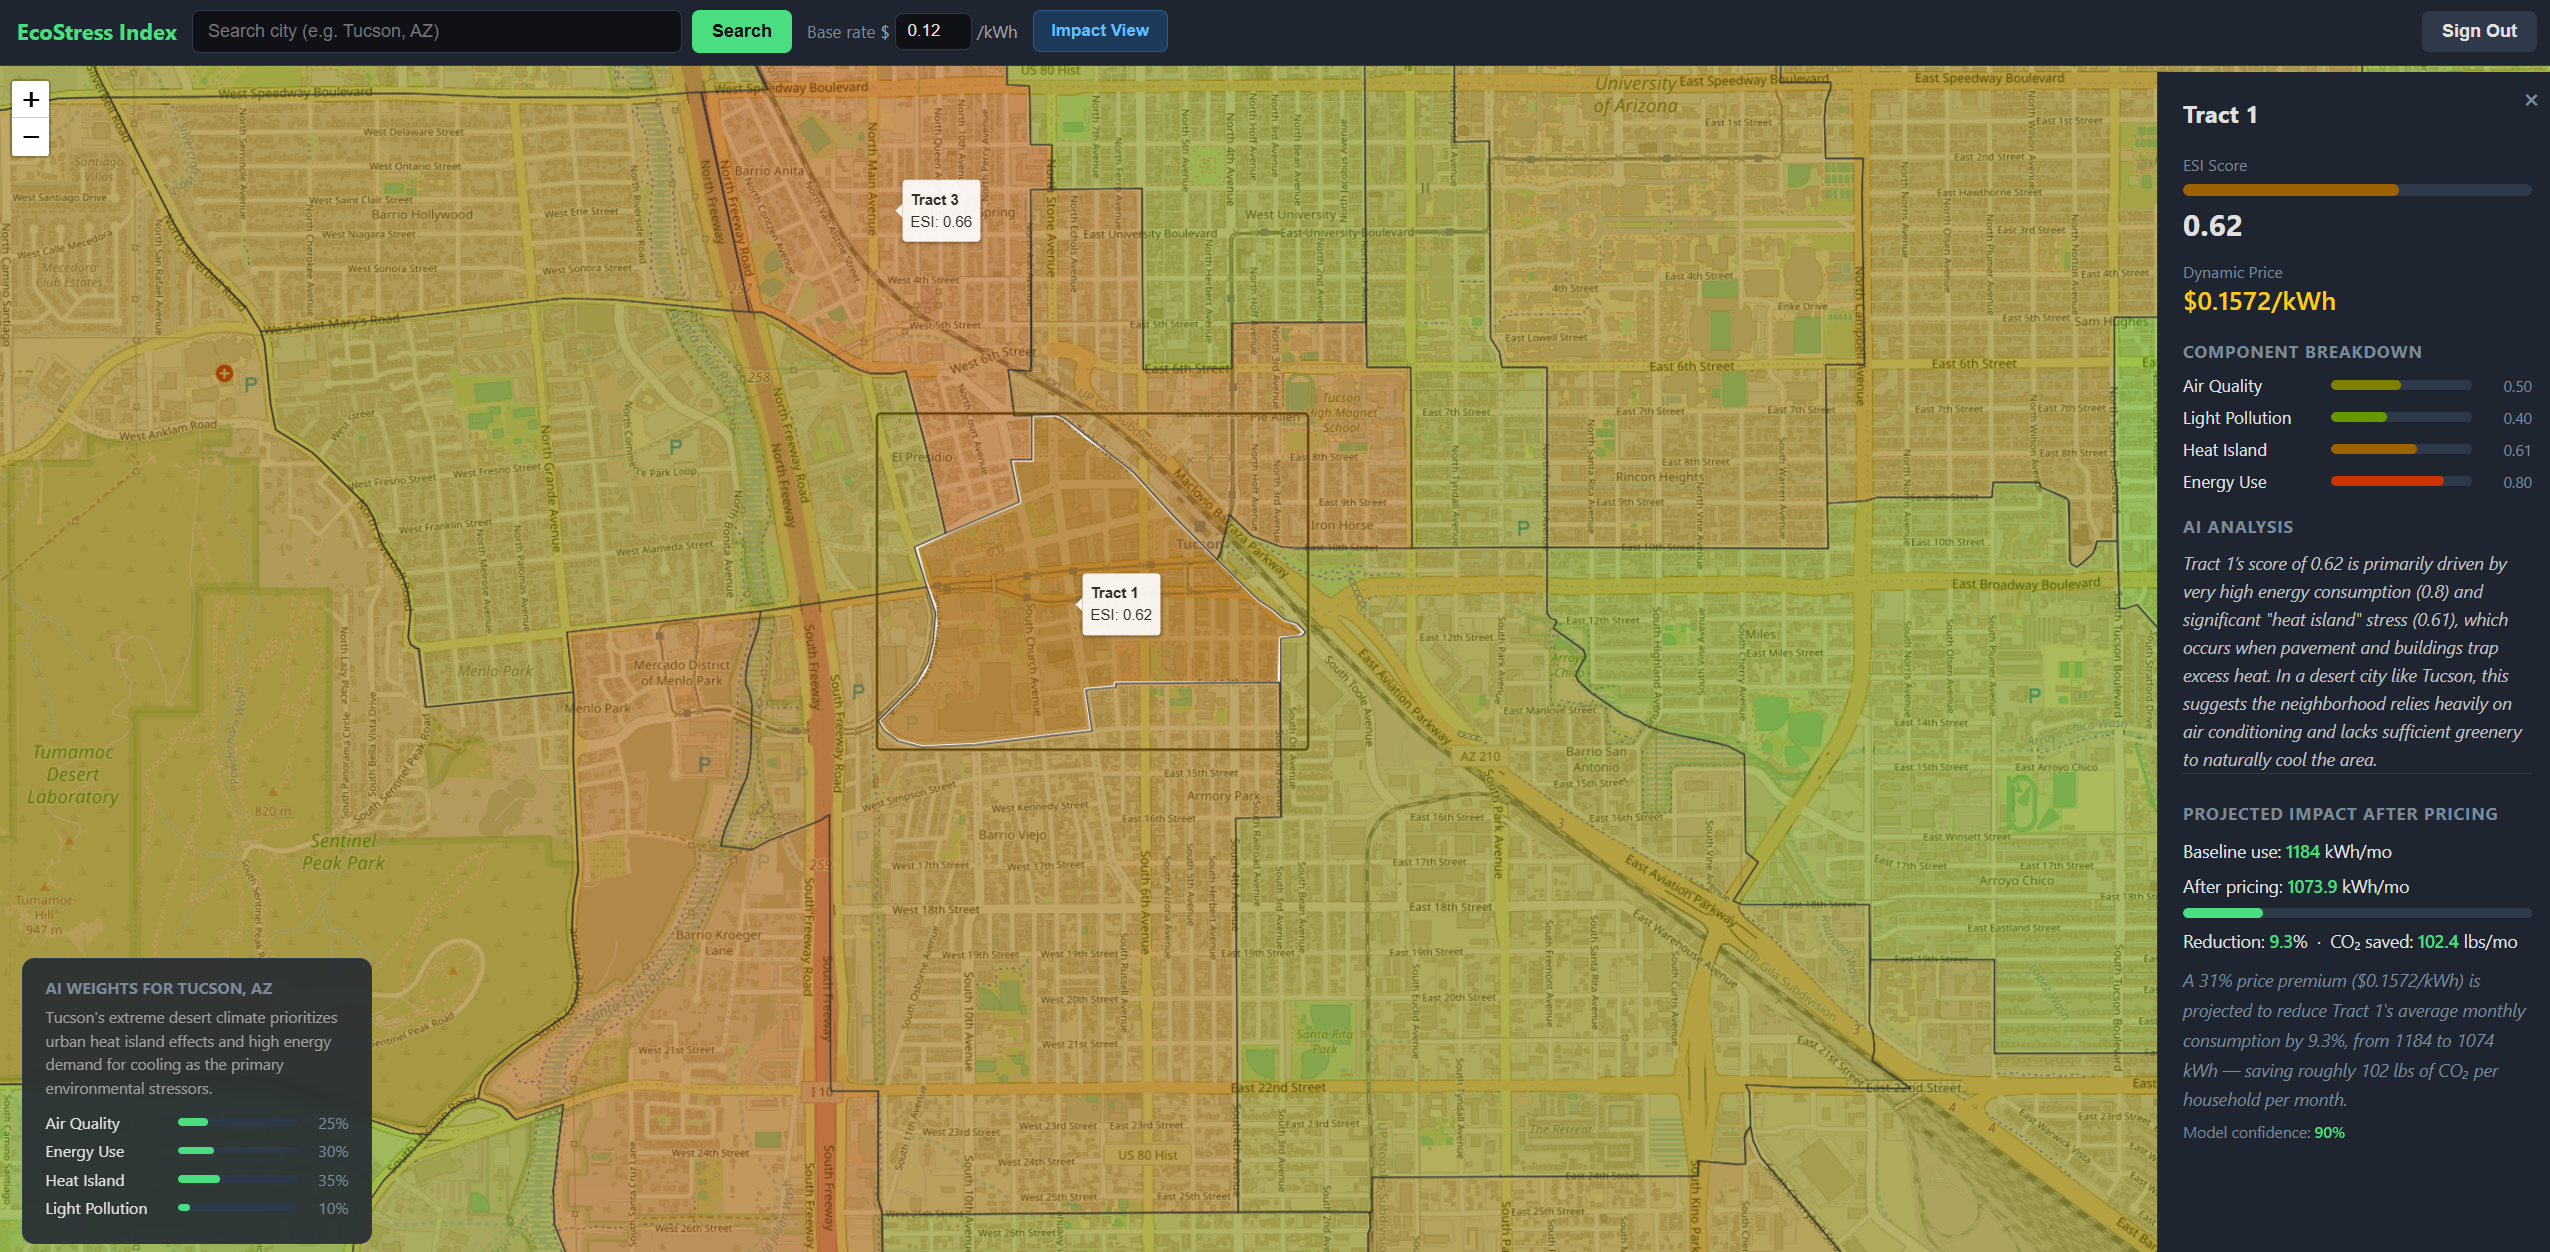
ESI score breakdown
-
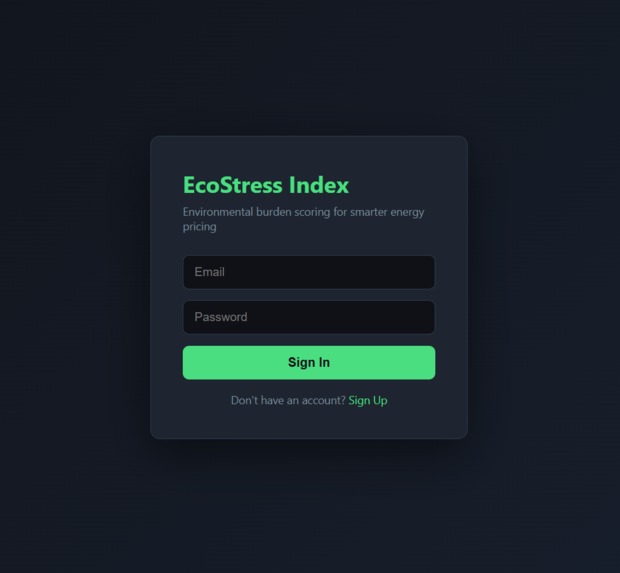
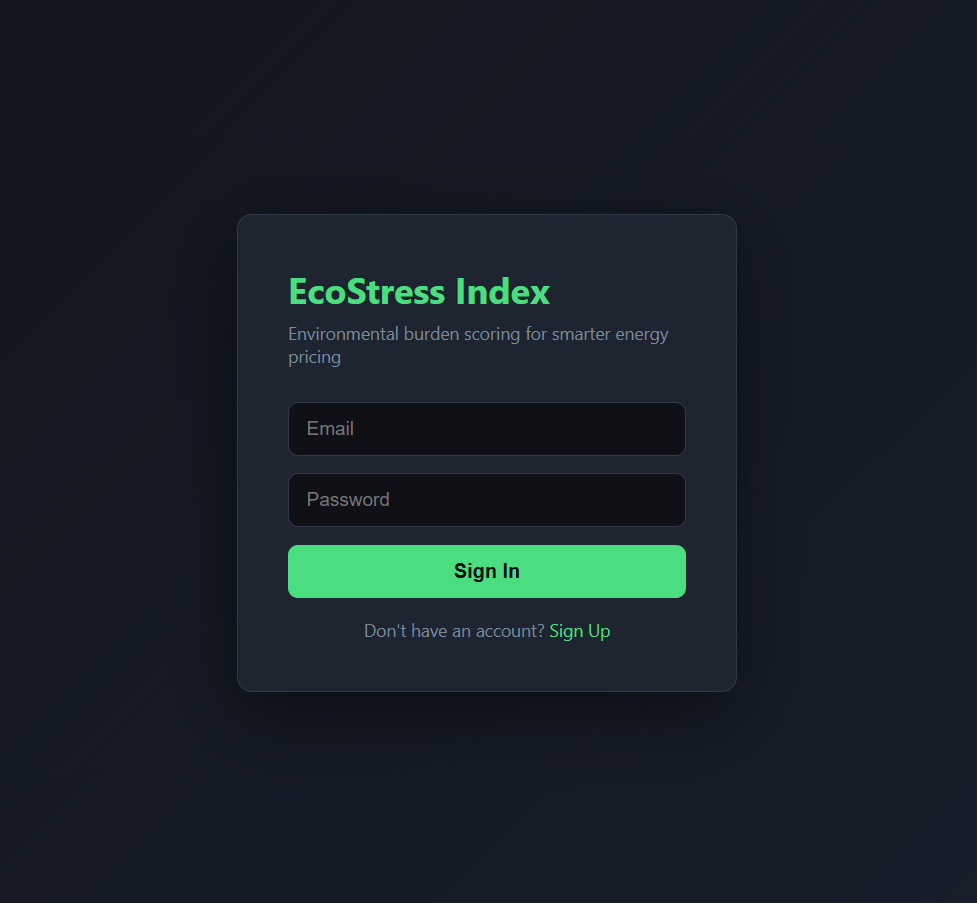
Login
-

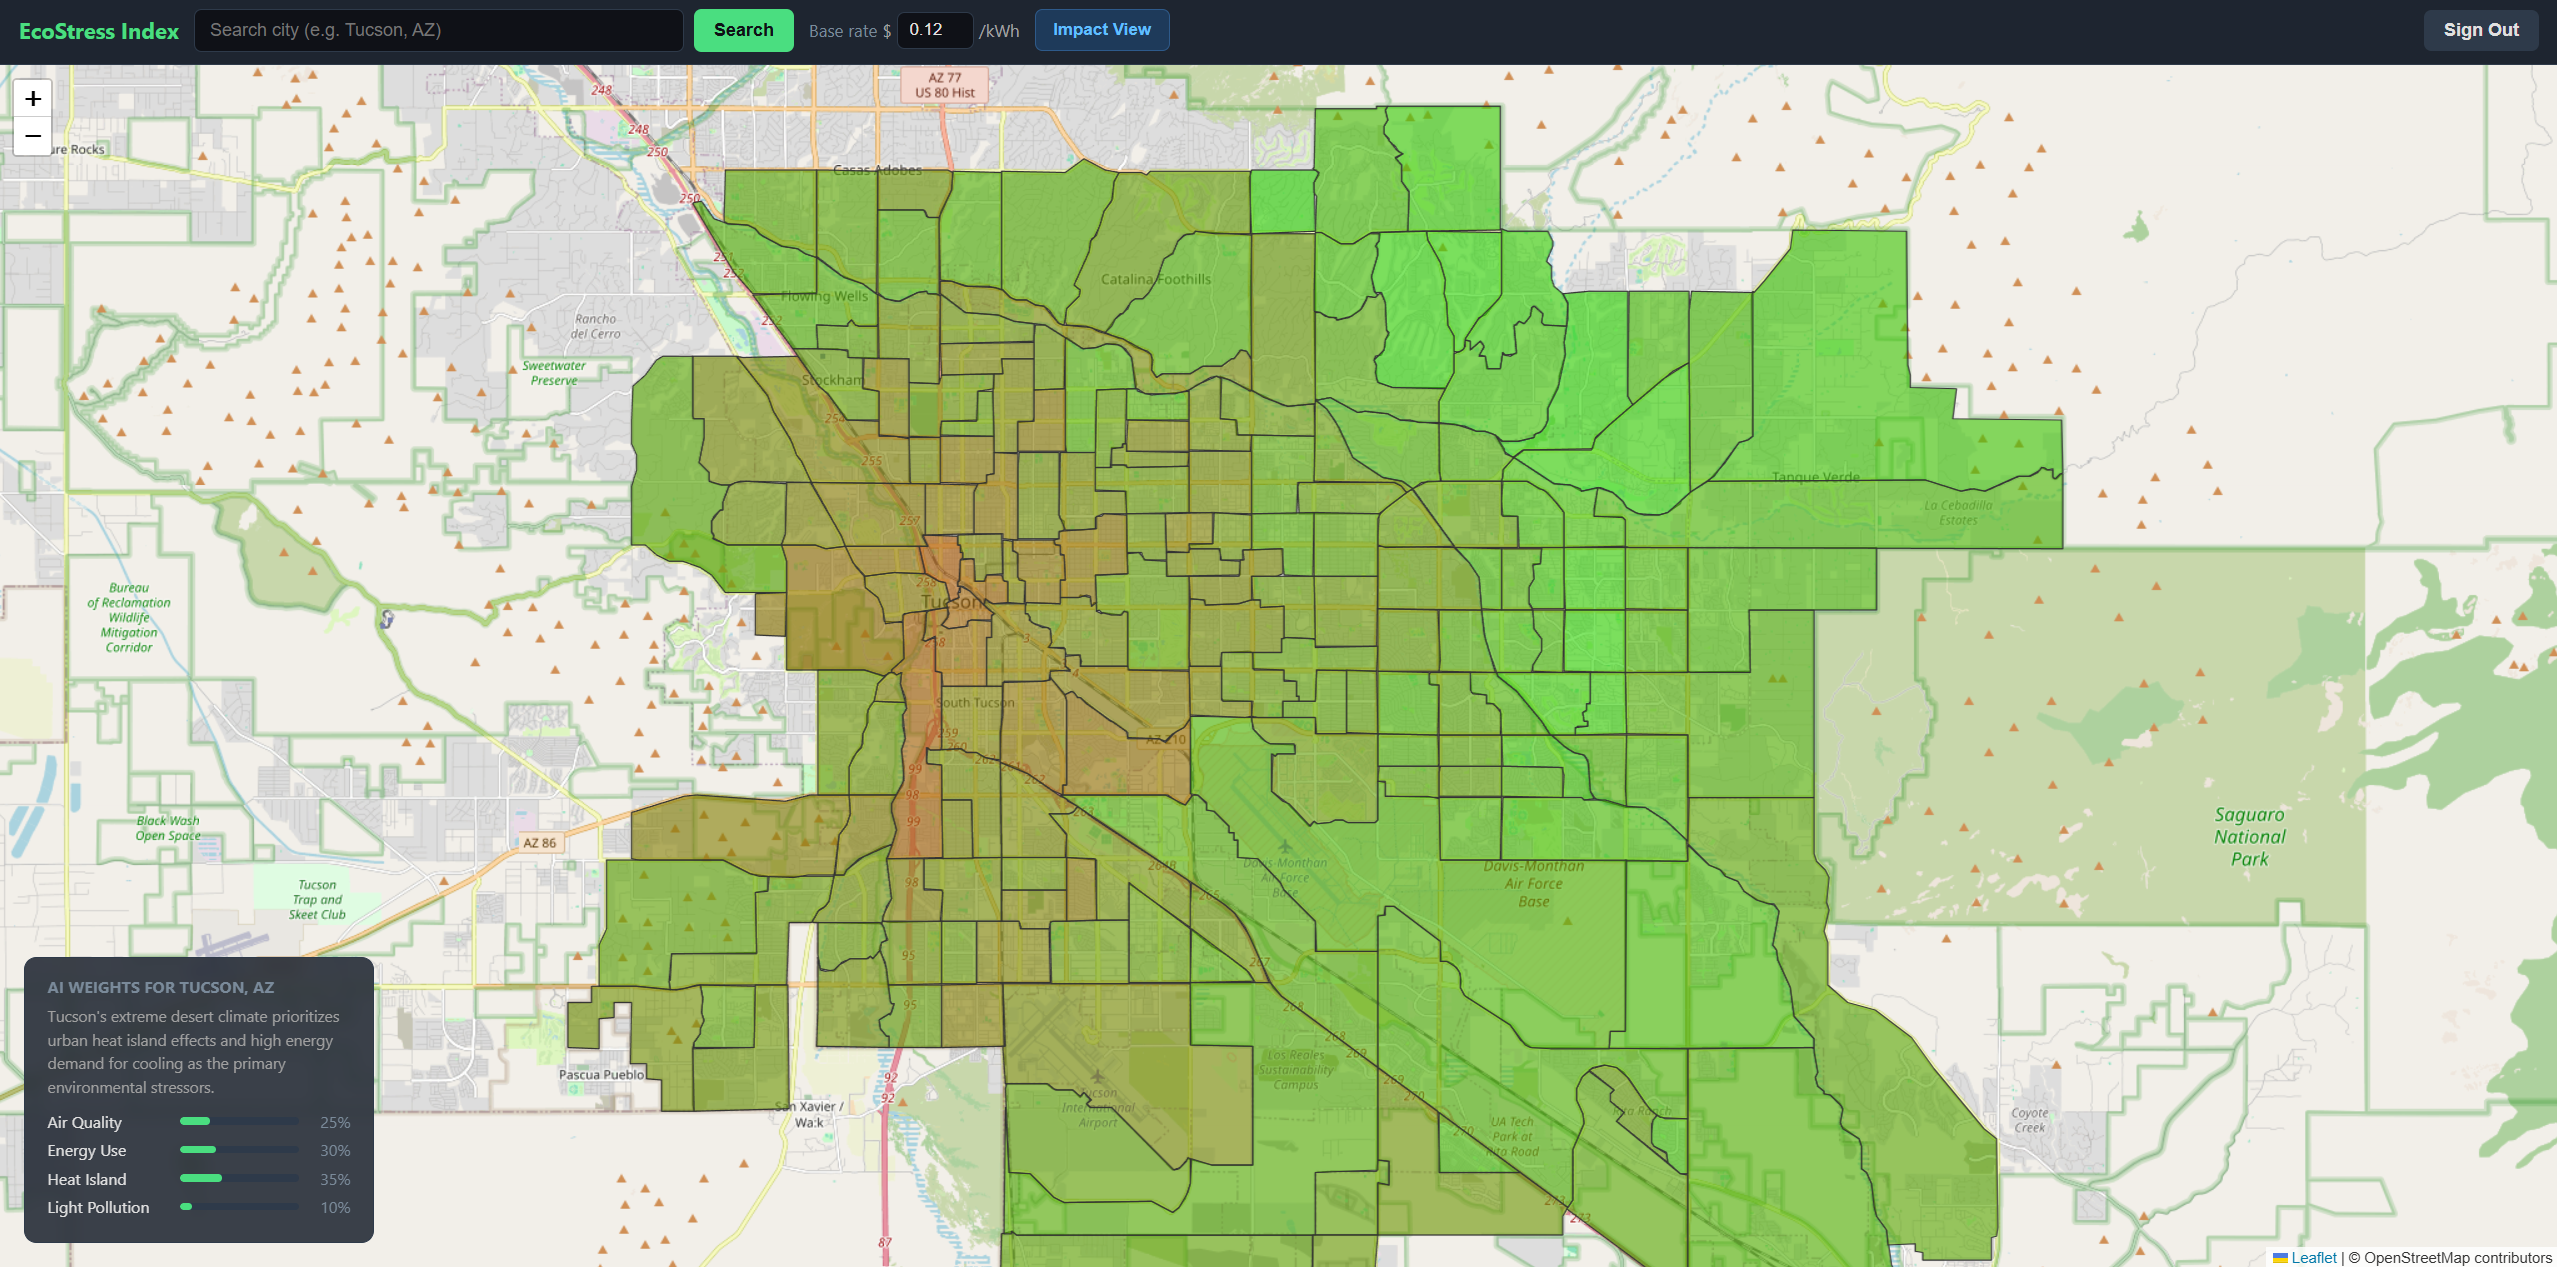
Basic map view
-

Basic map view(zoomed)
Inspiration
Tucson's energy use has climbed steadily for the past decade. Every new device, every extra hour of AC, every lit-up parking lot carries an environmental cost and right now, nobody pays for that cost differently based on how much damage they're doing. We wanted a way to make energy pricing reflect environmental reality, fairly and transparently. That's where the Eco Stress Index was born.
The Idea
We built a web app for electricity companies like Tucson Electric Power that ranks neighborhoods by their environmental footprint and adjusts energy pricing accordingly. Areas with higher environmental impact pay a premium, while cleaner neighborhoods get cheaper rates. This creates a direct market incentive to reduce consumption. Research studies show that when consumers are warned of higher pricing, they reduce energy use by 7–17% ¹. Scaled across a dense urban center, that's a massive improvement.
What It Does
Our app pulls from 7 data APIs to measure four factors per neighborhood: energy use, air quality, light pollution, and heat island intensity. It then uses Gemma 4 to generate geolocation based weights for each factor. In Tucson, heat islands are a large concern. We in the Sonoran Desert and summers routinely exceed 100°F. In Boston, dense traffic make air quality the bigger concern. Gemma 4 reasons about this automatically. From these weighted factors, we compute an Eco Stress Index (ESI) for each neighborhood which is a value from 0 to 1, where higher means more environmental strain. That ESI feeds directly into a dynamic electricity pricing formula. The map renders each neighborhood on a green-to-red scale, and a simulation then models how the new pricing would shift consumer behavior, redrawing the map with projected improvements.
Additional Features
Gemma 4 generates a plain-language analysis for each neighborhood explaining why its ESI is what it is and what the primary drivers are. This is useful for utility companies who want to understand root causes before making pricing decisions. A base rate slider allows for custom pricing configurations, and a city search bar makes the tool usable anywhere in the United States.
How We Built It
We started by nailing down the ESI formula and the dynamic pricing math, then built a Flask backend and connected a Supabase database for authentication and caching. We sourced and integrated 7 environmental data APIs, built the frontend in HTML and CSS, and rendered the map using OpenStreetMap tiles and Leaflet.js. Neighborhood boundaries are drawn from US Census data and rendered as polygons on the map. Gemma 4 handles both the weight generation and the neighborhood level AI explanations. We finished by deploying the full stack and resolving some environment variable mismatches that came up late in the process.
Stack:
Python · Flask · Supabase · Gemma 4 · HTML/CSS · Leaflet.js · OpenStreetMap · PurpleAir · AirNow · NASA VIIRS · NASA Landsat · EIA · US Census
Challenges We Ran Into
Free-tier API rate limits were our biggest technical hurdle, especially with Gemma 4. We had to architect the request pipeline carefully to avoid bottlenecks and keep the app responsive. Deployment also threw us a curveball when environment variables didn't carry over cleanly, but we worked through it and shipped a live product.
Accomplishments We're Proud Of
Shipping a fully deployed, full-stack application in under 24 hours is something that isn't easy with this small of a team. Beyond the technical execution, we built a tool that could meaningfully reduce energy consumption in cities. The simulation layer closes the feedback loop between pricing policy and behavioral change, turning ESI from a score into an actionable decision-making tool.
What We Learned
We got hands-on experience architecting a full-stack app from scratch under real time pressure. We learned how much product decisions matter when building fast. We also deepened our understanding of how AI can be used in multiple contexts in an application, and can be relied on for production.
What's Next for Eco Stress Index
The immediate next step is expanding data coverage and refining the simulation model with real historical consumption data. Longer term, we want to build a utility company dashboard with trend tracking over time so companies can see whether pricing changes are actually changing anything. We'd also like to layer in an environmental justice filter, flagging neighborhoods where high ESI scores correlate with lower income so pricing adjustments can be applied with appropriate safeguards.
¹ Ito, Koichiro, Takanori Ida, and Makoto Tanaka. "Information and Price Variations Reduce Residential Energy Use in the United States." Abdul Latif Jameel Poverty Action Lab (J-PAL), https://www.povertyactionlab.org/evaluation/information-and-price-variations-reduce-residential-energy-use-united-states.

Log in or sign up for Devpost to join the conversation.