-
-

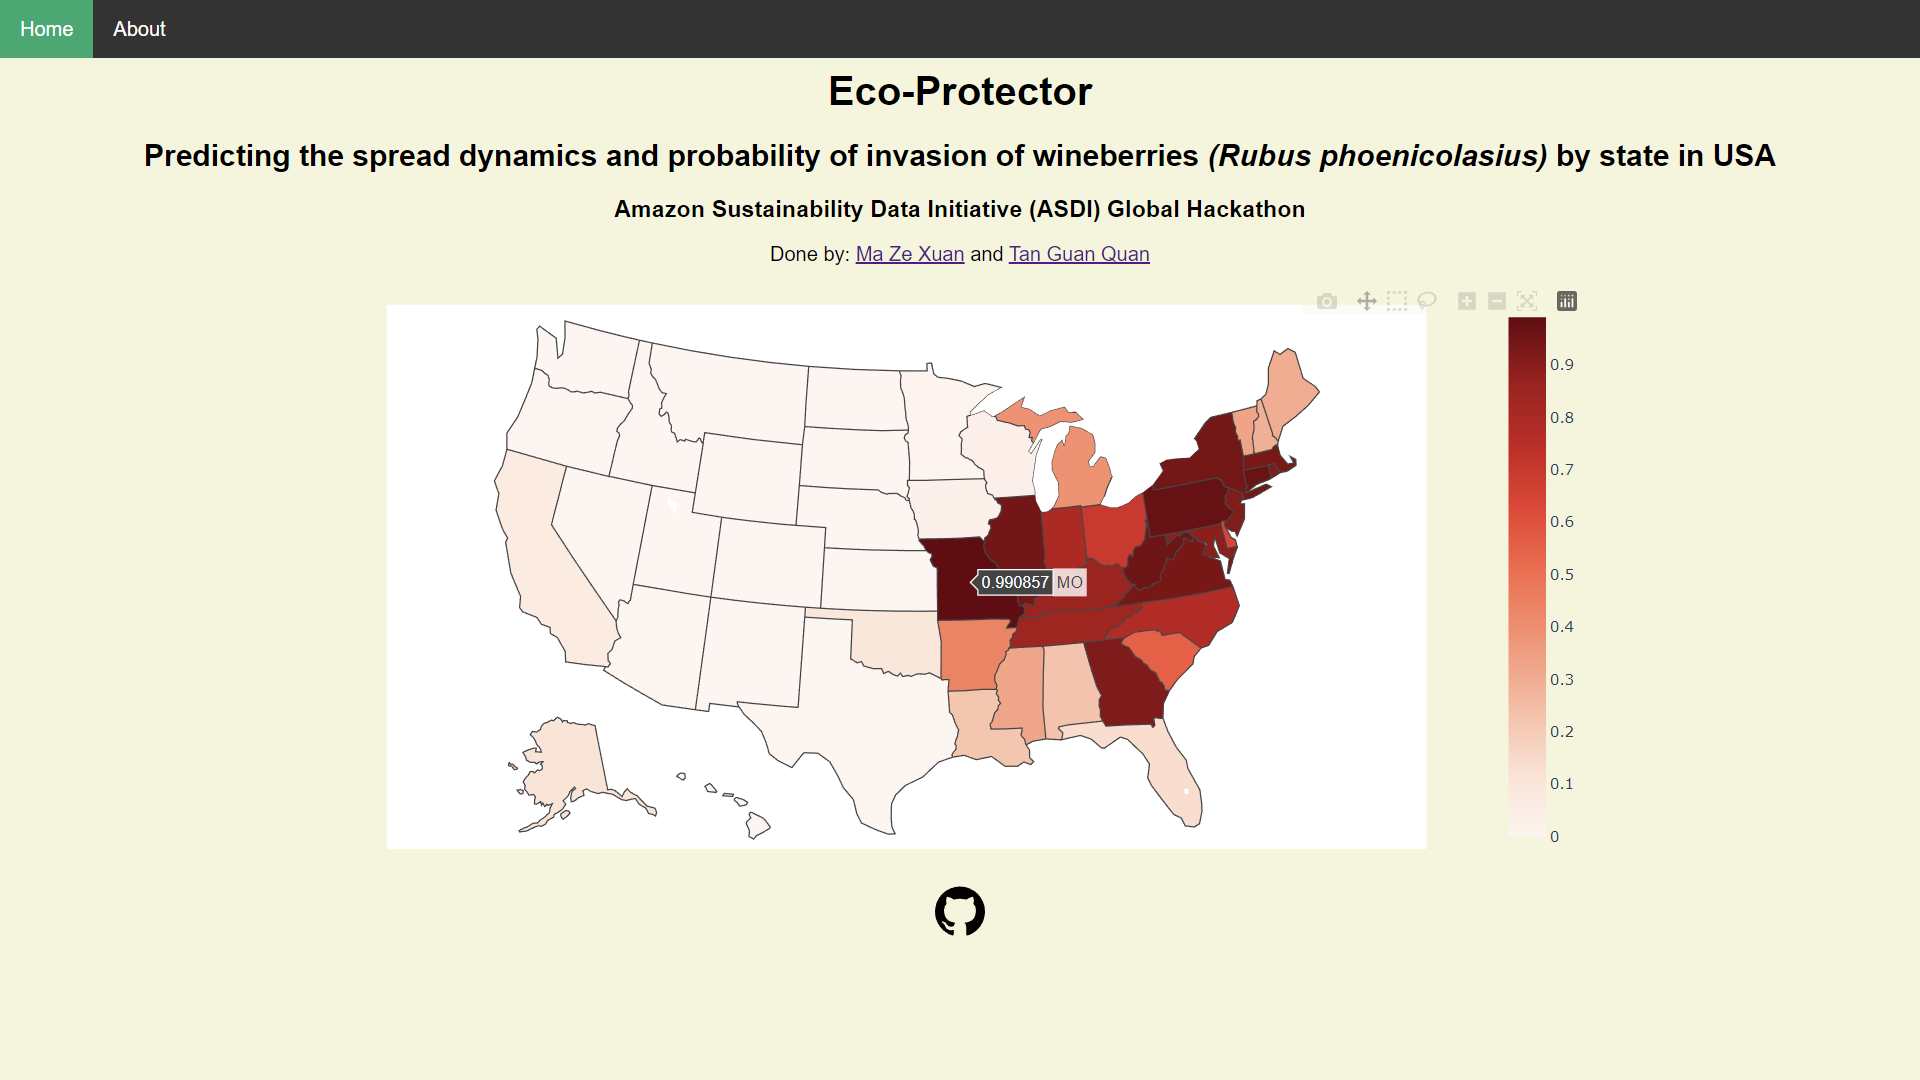
Frontend Display
-
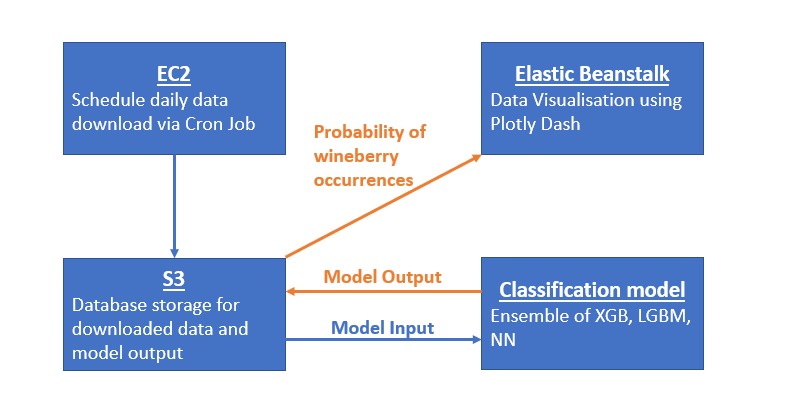
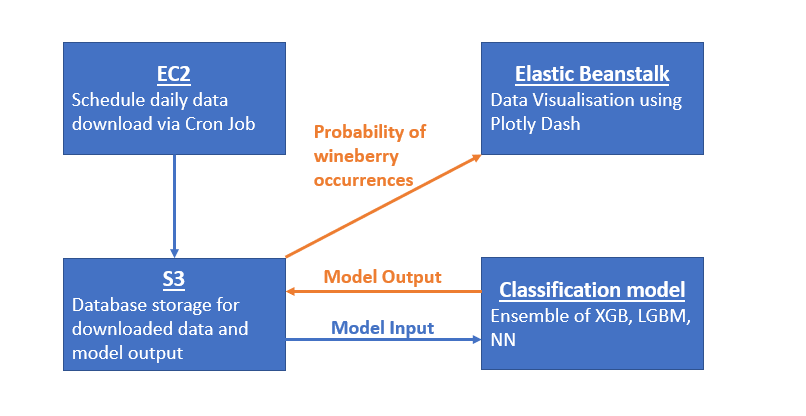
Project Framework
-

Eco-Protector Logo

Inspiration and UN Sustainable Development Goals (UNSDGs)
Life on Land (Biodiversity) is one of the UNSDGs that is least talked about. This is because the impacts and effects of biodiversity loss are often long term and hence not very obvious to many of us. This does not mean that the effects of the loss Biodiversity should not concern us. Biodiversity loss often mean worsening climate change since many ecosystems trap carbon dioxide and when ecosystems are heavily impaired, it could also mean that we may not be able to enjoy some of the food that we enjoy now.
Our inspiration stems from a previous project done on biodiversity preservation and species distribution modelling. I had the idea then that the species distribution of any plant or animal is highly dependent on the balance of its ecosystem. But what if there was a disruption of this ecosystem? What would happen to the distribution of the particular species then? Unfortunately, the idea only remained as a possible extension and was not implemented. We're thankful that this competition provided us the platform to transform what was then a small extension/idea into a full fledged project. We hope that through our project, we can highlight the importance of our Biodiversity and also explore more creative ways to mitigate biodiversity loss and protect our ecosystems.
What it does
This project is an investigation of the spread dynamics of an invasive species, essentially, it analyses the "spreadability" of an invasive species from an affected to unaffected area. More specifically, our exploration focuses on the spread dynamics of wineberries (Rubus phoenicolasius) of affected states in the US. This is done by examining environmental factors affecting plant growth such as solar radiation, soil moisture, temperature, etc... in the different locations and predicting the probability of the presence of wineberries in these areas.
How we built it
Data Generation
1) ASDI Dataset : NOAA Global Historical Climatology Network Daily (GHCN-D)
- Collect Daily Temperature Data for all the US states
2) Global Biodiversity Information Facility (GBIF)
- Collect Wineberry (*Rubus phoenicolasius*) occurrences in all US states from (2009 - Present) to generate presence data.

- Absence data is then obtained by sampling the 50 US states equally to pull non-occurrence data over the same period of (2009 - Present)

- This allows us to have a balanced dataset
3) NASA Power Project Data Catalog
- Collect solar and meteorological data such as Solar Radiation, Wind Speed, Pressure, etc...
The datasets are combined and stored the AWS S3 Cloud Database which allows for easy retrieval during model training.
Modelling and Post Processing
We built an ensemble of 3 Models : XGboost (XGB), LightGBM (LGBM) and a Neural Network (NN) on a binary classification task which takes as inputs the environmental feature set discussed in the above section to predict wineberry occurrences. We then convert the logits to a value between (0 and 1), representing the probability of occurrence then evaluating our model's results using AUC (Area Under ROC Curve). Our Models are able to achieve about a cross validation and test score of approximately 0.96, which represents an accurate set of predictions. The imperfect score also tells us that there is a probability of the spread of wineberries to other states in the US that are not affected.
The results are then extracted and averaged over all 50 states to generate an average probability of wineberry occurrences. This final result is plotted on an interactive map using Dash and deployed on AWS Elastic Beanstalk.

In addition, we were able to setup an EC2 cron job to schedule automated daily data downloads, allowing us to update our results and visualisations daily to ensure that the predictions we make are up to date.
Challenges we ran into
Brainstorming for an idea was one of the biggest challenges for us. There are many ideas out there and we wanted to come up with something creative, something that will have an impact. Hence we decided to work on an area that has not really been explored.
Aside from thinking of useful ideas, finishing the project in time was a huge challenge for us as well. As students, we have a tight academic schedule and it was tough to spend time on the project and discuss our ideas together.
Accomplishments that we're proud of and What we learned
Having began the hackathon just about 2 weeks before its deadline, we are happy with how much we are able to achieve especially after we spent almost a week on deciding on our project.
This project has been an amazing opportunity for us to explore the Amazon web services. In particular, we tried out Amazon Sagemaker, Elastic Beanstalk, Amazon S3 Database and setting up Cron Jobs through Amazon EC2. We were pleasantly surprised at how easy it was to develop and deploy models and projects on AWS and we will likely be using many of the AWS products we have used in our future projects and trying out new ones.
Conclusion and What's next for Eco-Protector
Given that this is just a prototype built in a little more than a weeks time, we plan on expanding it to be able to include any invasive species with sufficient data available on GBIF and in any area of interest (not just the US). We also plan on building more descriptive analysis to allow users to better understand the issue at hand. We hope that our project can bring change and shed light on the importance of preserving our Biodiversity.
Built With
- amazon-ec2
- amazon-elasticbeanstalk
- amazon-web-services
- css
- python
- python-dash
- tensorflow


Log in or sign up for Devpost to join the conversation.