Inspiration
We stumbled across the idea for this project while talking about the new innovation of vertical wind turbines. We realised that nowadays there are so many different options for renewable energy that it can be hard to make the right choice!
What it does
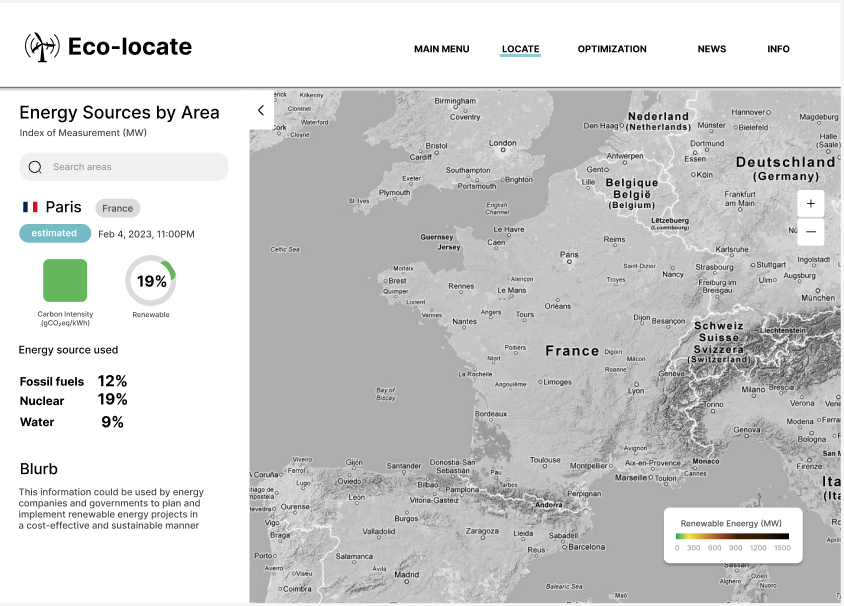
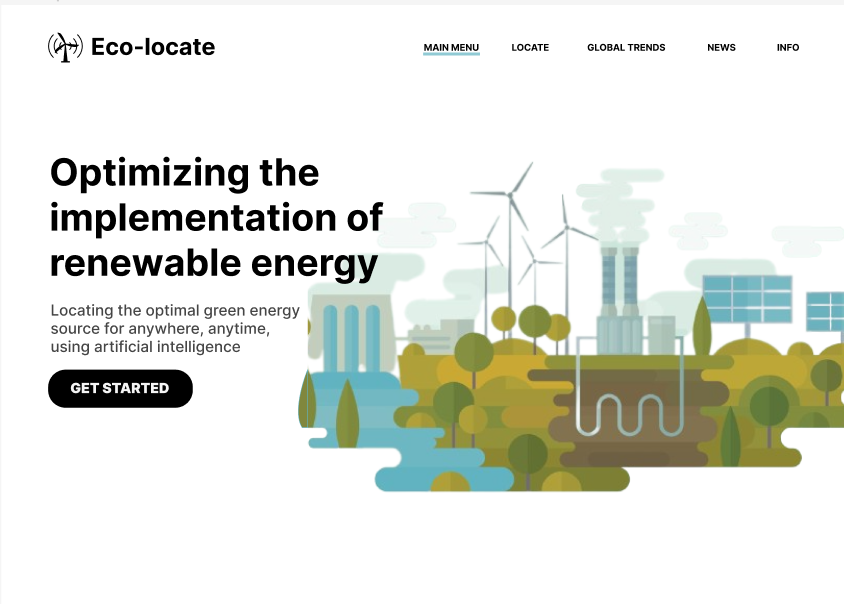
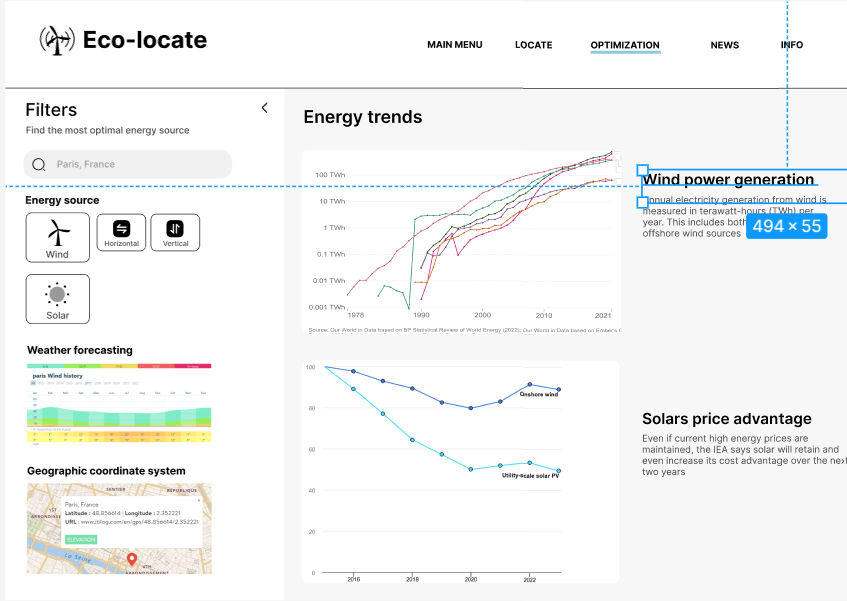
Our tool allows the user to drop a pin on a map, and see an overview for how to build renewable energy sources in that space. The tool highlights open space, with a colour code to represent which renewable energy device is a best fit for the location. That decision is made based off a plethora of meteorological data including wind speeds, cloud coverage, daily sunshine, solar radiation, and more! It also gives an overview of energy consumption and production in that area, as well as what percentage of it is renewable, so that land developers can make financially sound choices.
How we built it
Our tool uses several layers of rich technology to bring together one vision, including 6 APIs, a VM, and a neural network. The sleek web page was made on Figma and exported to HTML and Typescript to display on the web in a Node.js environment. All map elements, both interactable and static, are brought to life via the Google Maps API, where the Javascript API handles the dynamic map, and the Static Maps API generates images for the neural network. A Tensorflow NN takes the static maps and parses them using a rich Unet model, trained on over 2500 sample images from the LoveDA dataset. This was done in a Google Cloud VM in order to maximise training efficiency, and overcome RAM bottlenecks. The neural network then outputs a mask representing geographic segmentation such as buildings, vegetation, water, and more. In the meantime, the pin coordinates are also used to pull meteorological data from the Solar Radiation, Historic Weather, and Current Weather APIs from OpenWeather, as well as energy data from the ElectricityMaps API. The API data and the NN mask are then fed into a function that determines which renewable energy sources best fit each segment of the mask. The function then outputs the original static image, this time with colour-coded highlighting to represent the decision. The highlighted image can then be viewed in our lovely UI where it's paired with energy data for land developers to make informed decisions.
Challenges we ran into
The biggest problem that we ran into was integrating the many facets of our program. We absent-mindedly set up an elaborate neural network using TensorFlow Core, not realising that we should have used TensorFlow JS until it was too late. Interoperability between Python and Typescript is virtually non-existent, effectively blocking our NN from the rest of our tool. Other challenges included API paywalls, and finding training datasets. We found an amazing dataset, though it was limited to 72 quite gray photos of Dubai, meaning the model it produced had very poor results on greener imagery. Ultimately we had to train our own model on the LoveDA dataset, which proved to be a tall task because of efficiency issues, with regards to both memory and time.
Accomplishments that we're proud of
To be frank, we're extremely proud of the progress we made on such an elaborate task. None of us had any prior experience using JS, TS, or Node.js, and the TensorFlow experience between us is also little to none. Despite this, we produced a multitude of finely working components. The only way we could have improved is if we were able to successfully link them together, and we think we could definitely get this done with a bit more time. We tackled a very tricky and thorough idea, and produced a very thorough solution, missing only one element. We're extremely proud of how well we did despite how much we were learning.
What we learned
We learned a lot about building web-apps, since it was the first time for all of us. Learning about Node.js was very interesting, and we enjoyed learning about the advantages of TS over JS. Mostly it was eye-opening to do a deep-dive into neural networks, and get our hands dirty learning about what makes them tick. We enjoyed researching different NN models and ultimately settling on a Unet. We also learned a couple harsh lessons about making wise decisions early in a project's creation, like maybe checking if your project's most important API has a native language module...
What's next for Eco-locate
We fully intend to finish the project to production quality. After developing a working tool we would like to scale our project to allow for more data, and more accurate data. We would like to pursue our original plan of replacing the mask analysis function with another neural network, for a more detailed breakdown. We would also like to implement features that allow for more detail, such as lowering the likelihood that an area surrounded by trees is assigned solar panels, because of the increased daily shade.
Built With
- figma
- google-cloud
- google-maps
- jupyter
- linux
- node.js
- openweather
- python
- segmentation
- tensorflow
- typescript
- vm


Log in or sign up for Devpost to join the conversation.