-
graphsdata

Inspiration
We've noticed that many people aren't aware of just how much damage their actions are doing to the environment. Our goal with this project was to create an easy way for people to track their emissions over time, so they can make goals and work towards lowering their emissions.
What it does
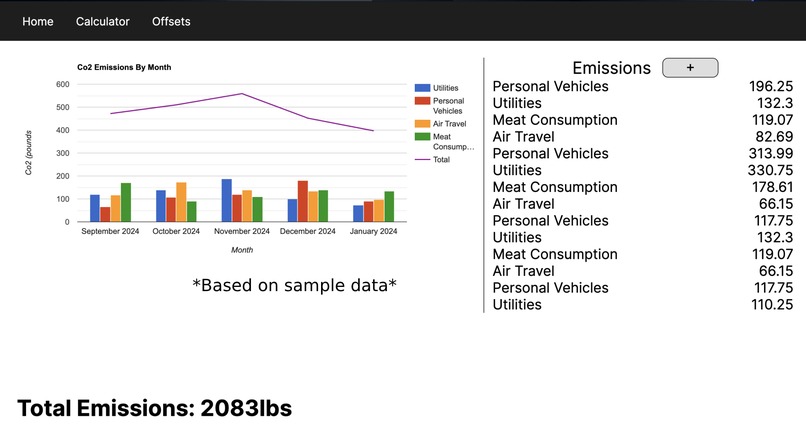
Our project allows users to input their daily activities and it calculates the carbon emissions for those activities. This way, they can set goals and work towards lowering their total carbon emissions.
How we built it
We used ReactJS and NextJS to build our UI, and the Carbon Interface API to get our data. We used Google Charts to create the charts.
Challenges we ran into
We had some trouble creating our UI, as we don't have a lot of experience creating complicated user interfaces, but we're pretty happy with what we came up with in the end.
Accomplishments that we're proud of
We were running into an error early on that had to do with LocalStorage, which is what we used to store user data. It turned out that we weren't parsing the data correctly, and it was coming back undefined. Eventually we figured out the issue which is what allowed us to finish the project.
What we learned
We learned how important it is to do research and have a good plan before starting to build. Our original idea was a carbon offset calculator, but we realized that most of our offset ideas were to donate to organizations that removed trash and planted trees. The problem with this is that we realized that we can't ask people to donate thousands of dollars to offset their emissions. Instead, we decided to pivot towards calculating their emissions over time so they can visualize their emissions and work towards lowering them.
What's next for Eco Emissions Calculator
Next, we're planning to make a mobile app to make it even easier for users to track their carbon emissions. To do this, we'll have to implement an authentication system with a database, but that shouldn't be too difficult considering where we are now. We're also hoping to add more ways for people to visualize their data so that they can better understand how their actions are affecting the world around them.
Built With
- javascript
- nextjs
- react


Log in or sign up for Devpost to join the conversation.