Inspiration
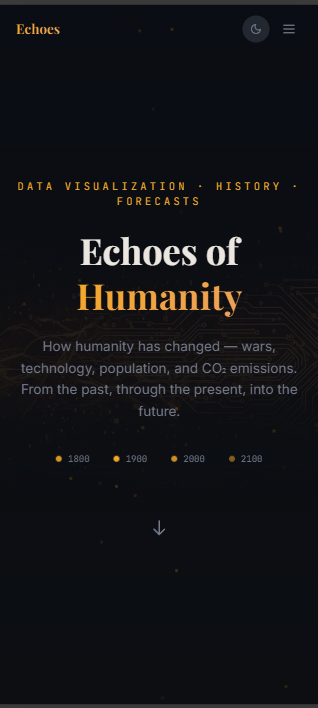
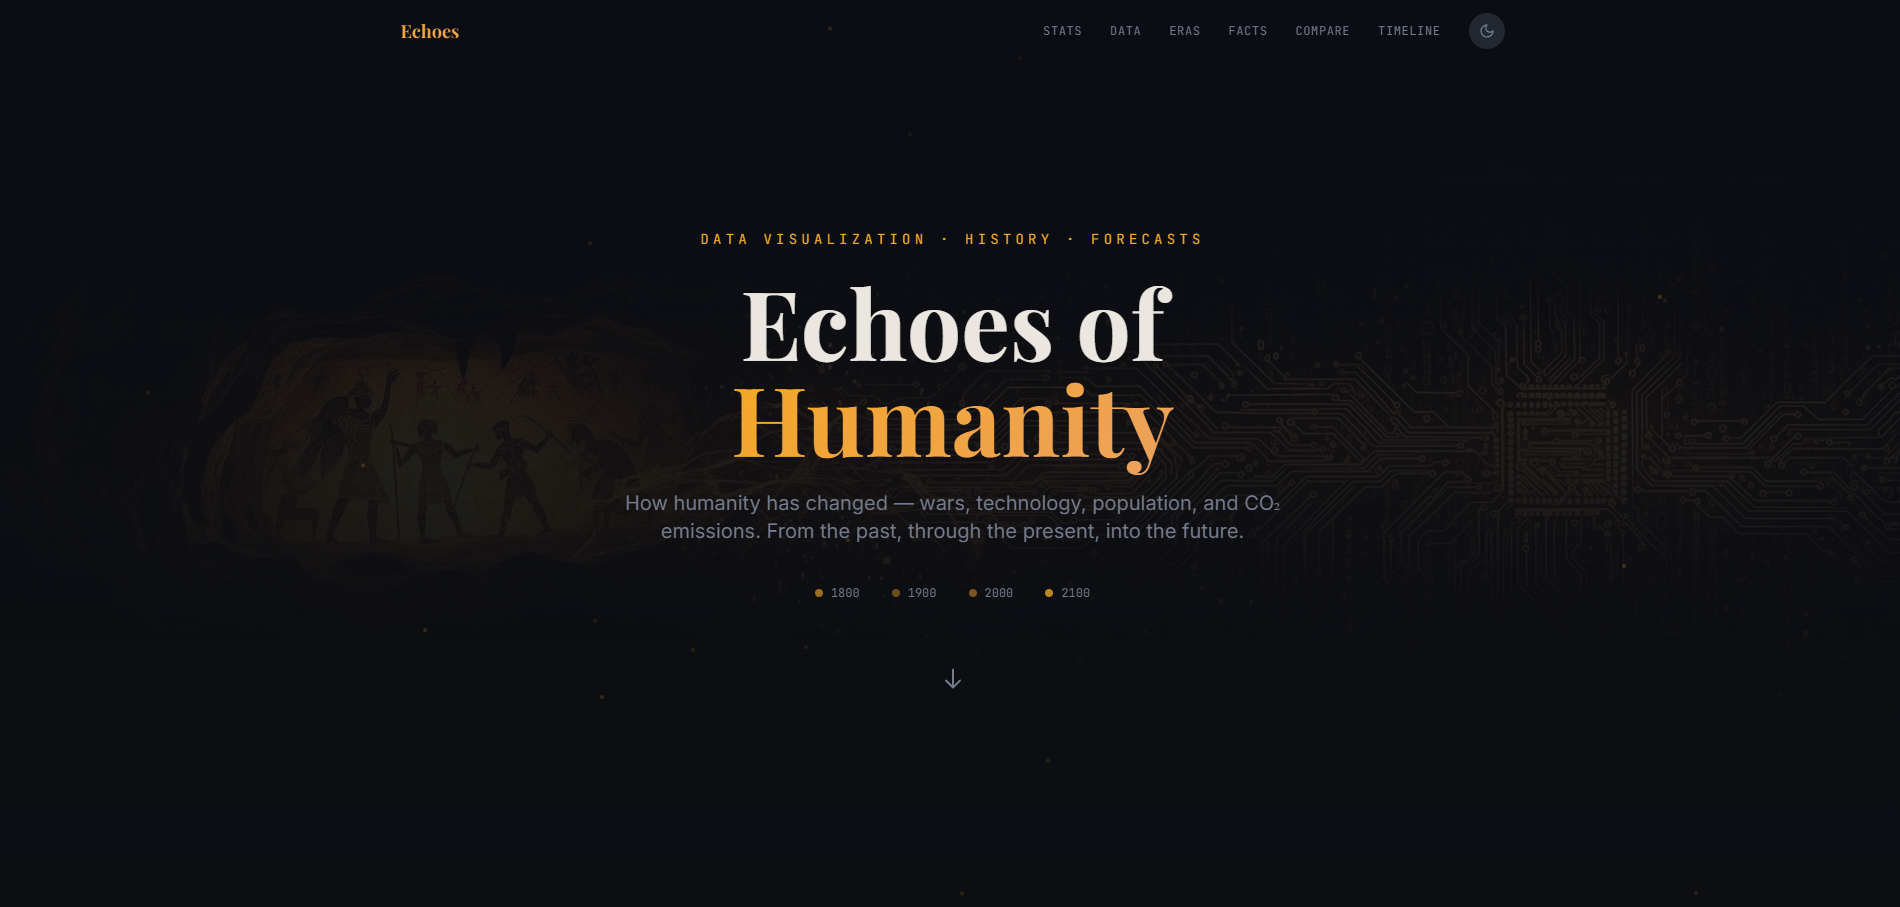
When you look at the grand scale of human history, the acceleration of progress over the last two centuries is absolutely staggering. We went from striking flint to splitting the atom, and from cave paintings to artificial intelligence. Inspired by this journey—where the echoes of ancient ancestors seamlessly blend into modern circuit boards—I wanted to create an interactive experience that visualizes how humanity has changed.
What it does
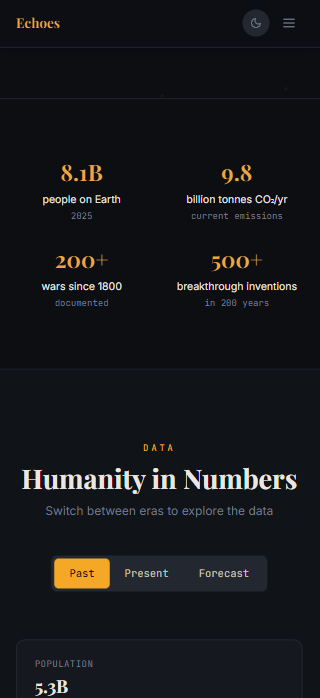
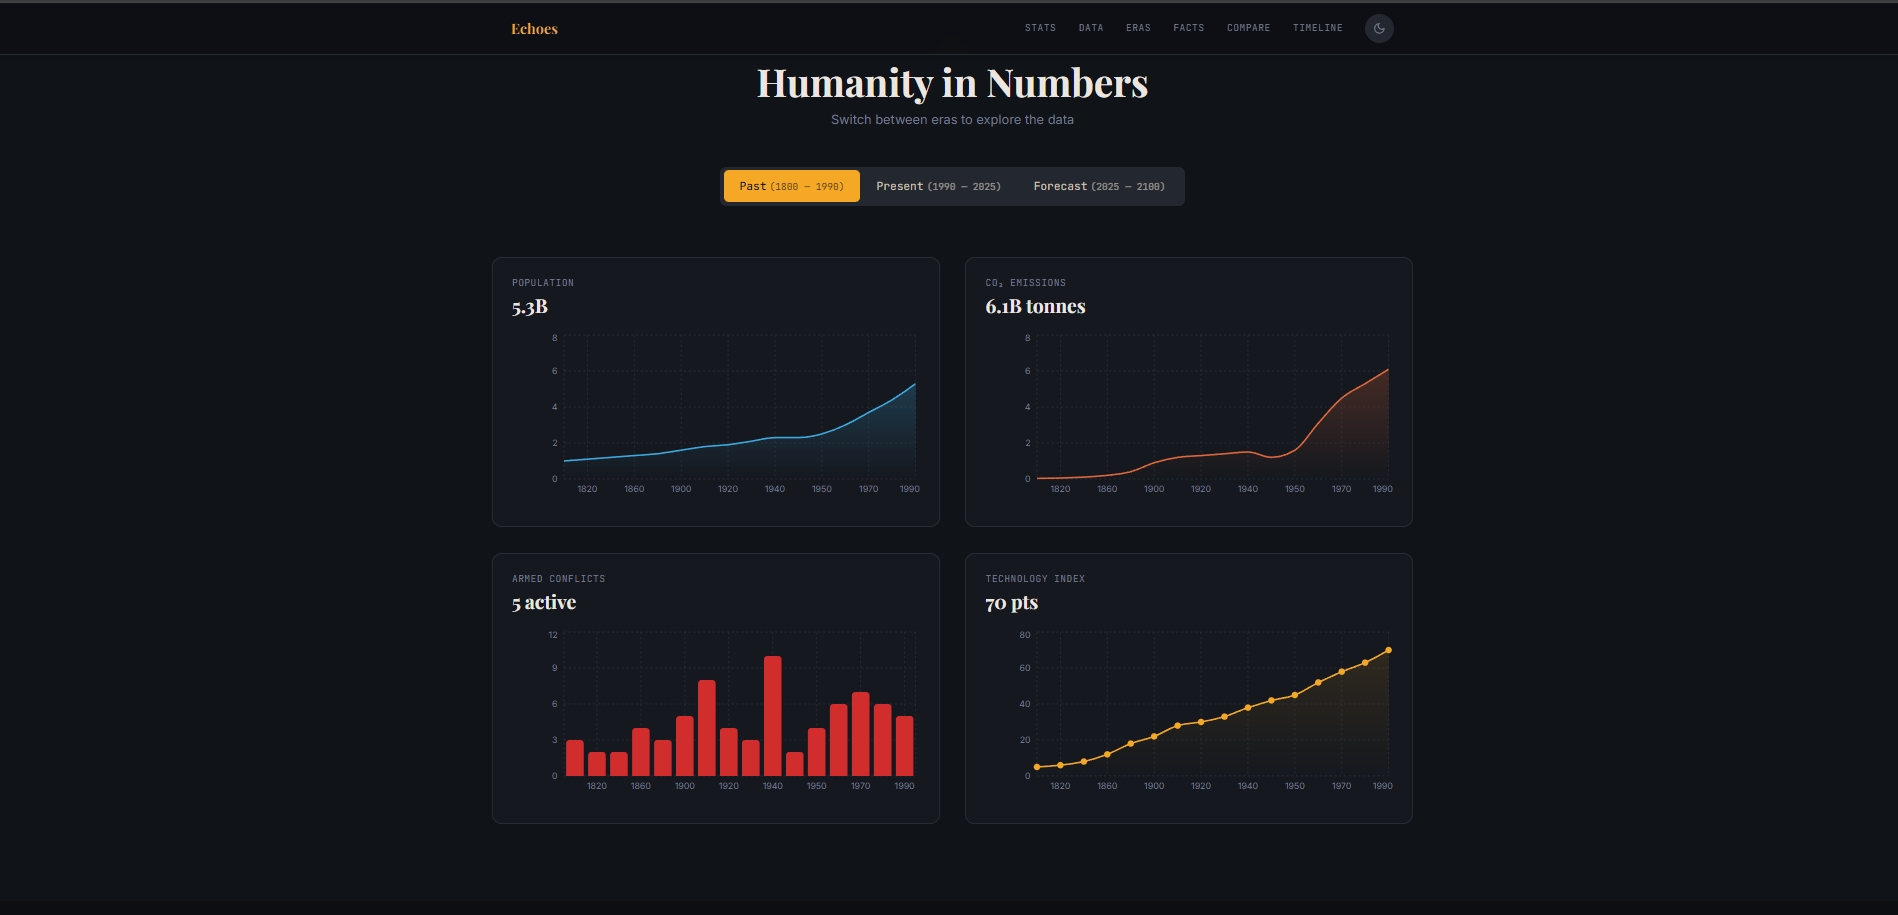
Echoes of Humanity is an interactive data visualization dashboard that tracks our journey from 1800, through the present, and into the forecasted future of 2100. It allows users to explore:
- Humanity in Numbers: Interactive charts displaying Population, CO₂ Emissions, Armed Conflicts, and a Technology Index across different eras (Past, Present, Forecast).
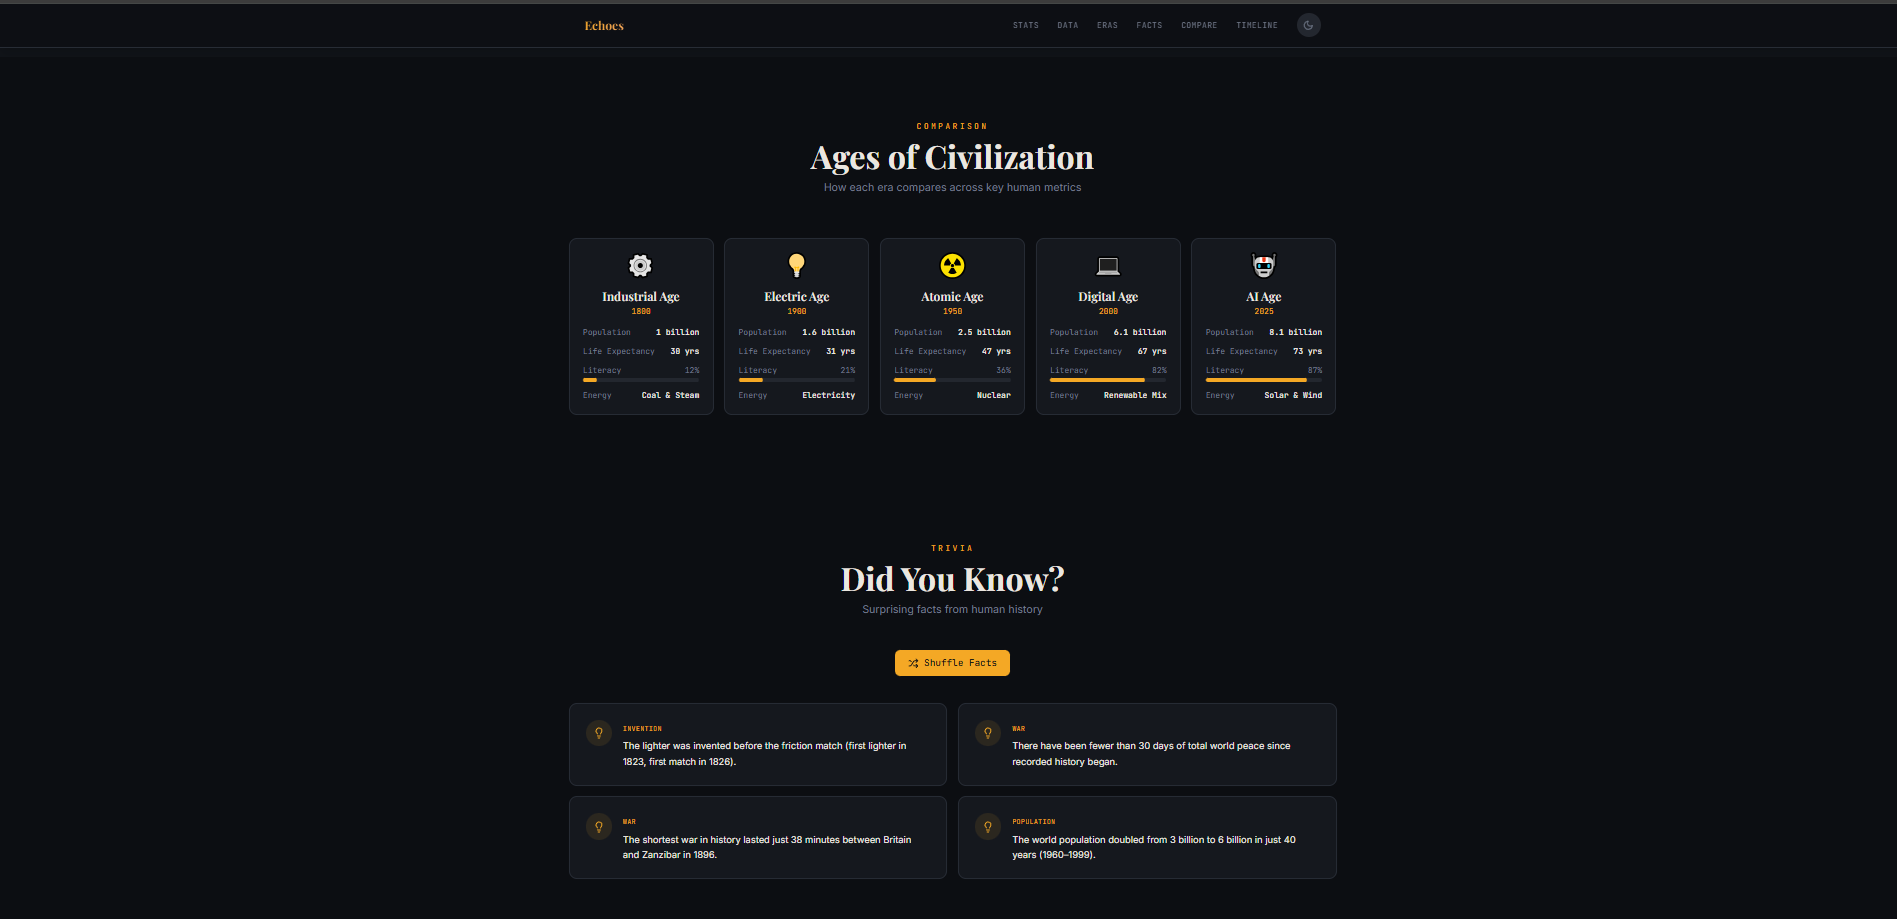
- Ages of Civilization: A comparative view of key metrics (life expectancy, literacy, energy sources) across different epochs: Industrial, Electric, Atomic, Digital, and the emerging AI Age.
- Trivia & Facts: A dynamic, shuffleable collection of surprising historical, biological, and technological facts.
- The Changing World: An interactive timeline slider that lets users travel from 1900 to 2025, watching global metrics (like daily calories, urban population, and working hours) update in real-time.
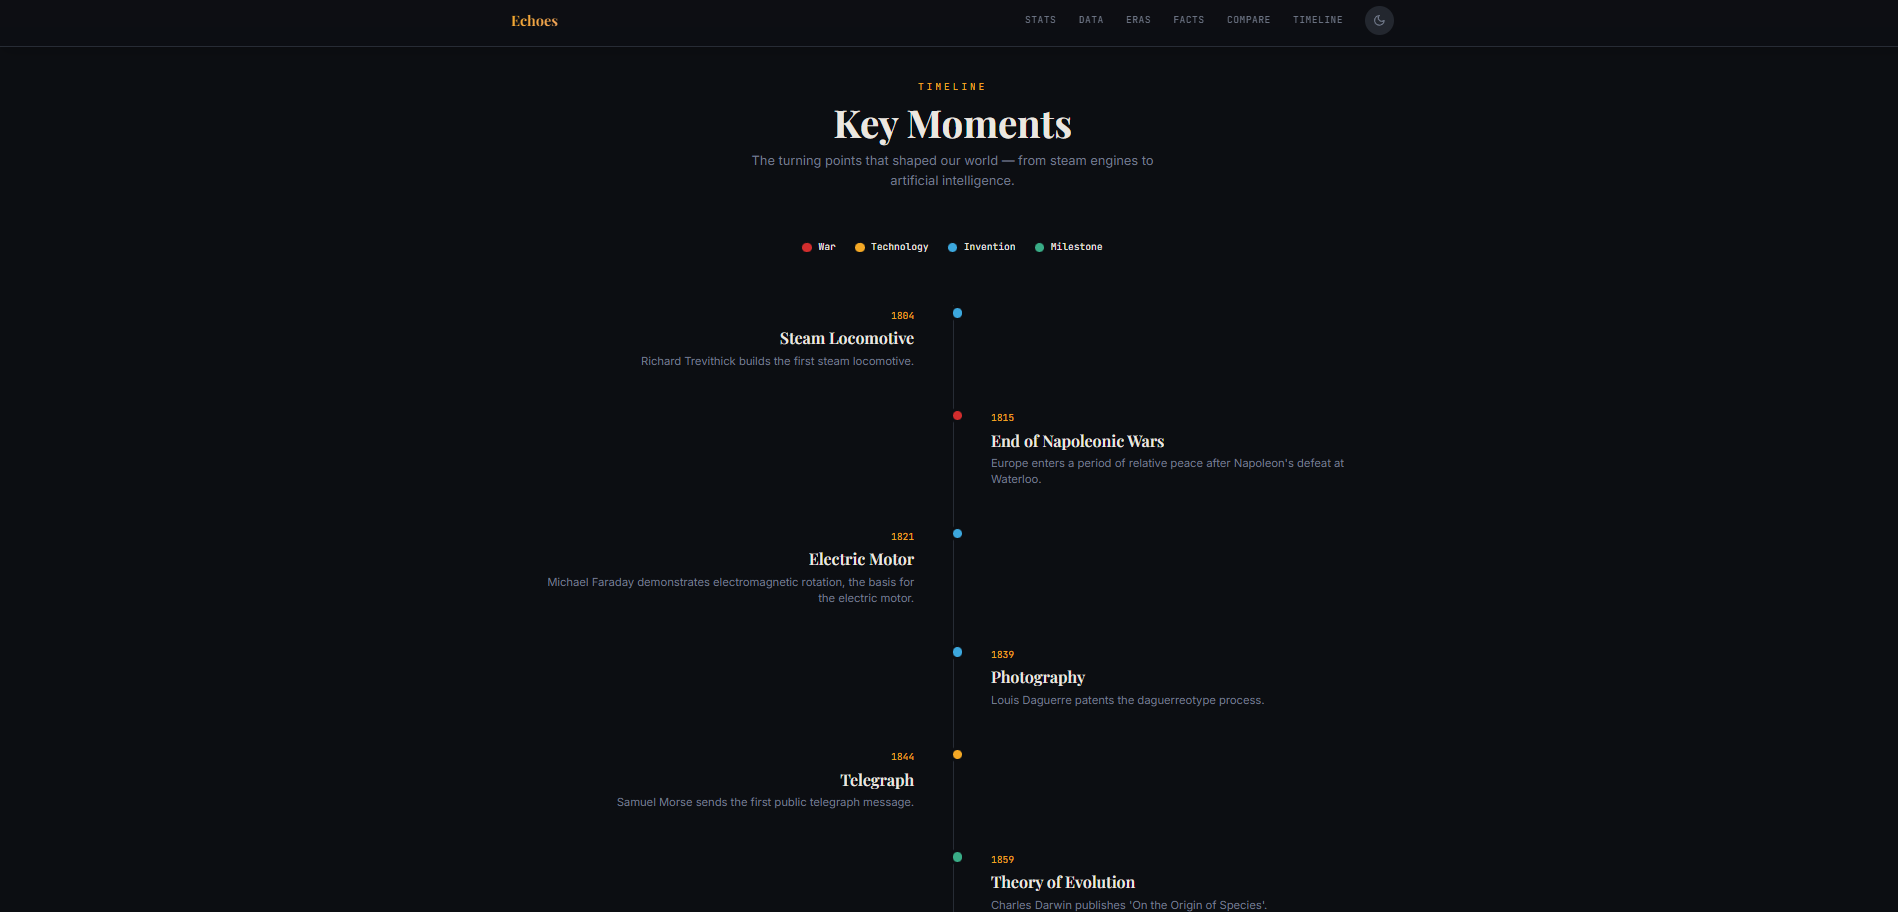
- Key Moments: A curated timeline of the turning points that shaped our world, categorized by Wars, Technology, Inventions, and Milestones.
How I built it
The project was built as a modern, high-performance web application:
- Frontend: React (with TypeScript) powered by Vite for lightning-fast hot module replacement and building.
- Styling & UI: Tailwind CSS combined with
shadcn/uicomponents for a sleek, dark-themed, and responsive design. - Animations:
framer-motionwas heavily utilized to create fluid transitions, especially for the interactive timeline slider and the pop-layout animations of the trivia cards. - Data Visualization:
rechartswas used to render the clean, interactive line and bar charts for historical and forecasted data.
Challenges I ran into
One of the main challenges was designing a UI that could present a massive amount of historical data without overwhelming the user. I had to carefully balance layout, typography, and color (using a specific palette for wars, tech, and population) to keep the dashboard legible. Another technical challenge was synchronizing the state of the "Time Travel" slider with multiple animated metrics components, ensuring the Framer Motion transitions fired smoothly without layout shifts.
What I learned
I deepened my knowledge of advanced React state management and component composition. I also learned a lot about data storytelling—how to take dry statistics (like CO₂ emissions or life expectancy) and wrap them in an engaging, interactive narrative that gives the user a sense of perspective on human evolution.
What's next for Echoes of Humanity
I plan to add more granular data sets, expanding the interactive map features to show regional differences rather than just global averages. I'd also love to integrate a dynamic backend to pull live data updates for the "Present" and "Forecast" sections.
Built With
- react
- typescript
- vite

Log in or sign up for Devpost to join the conversation.