-
-
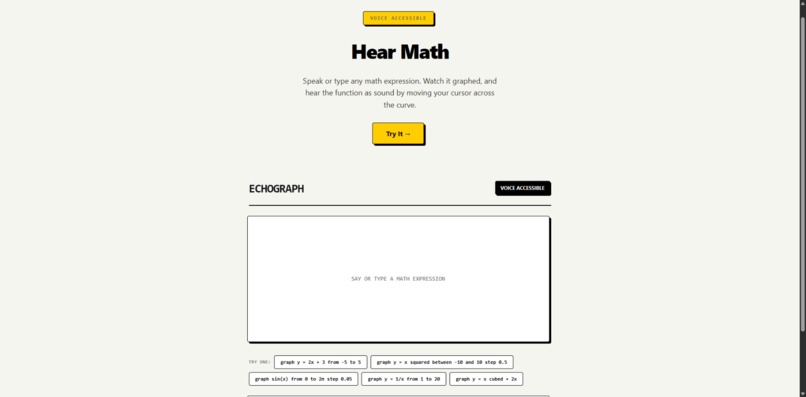
Single page webapp
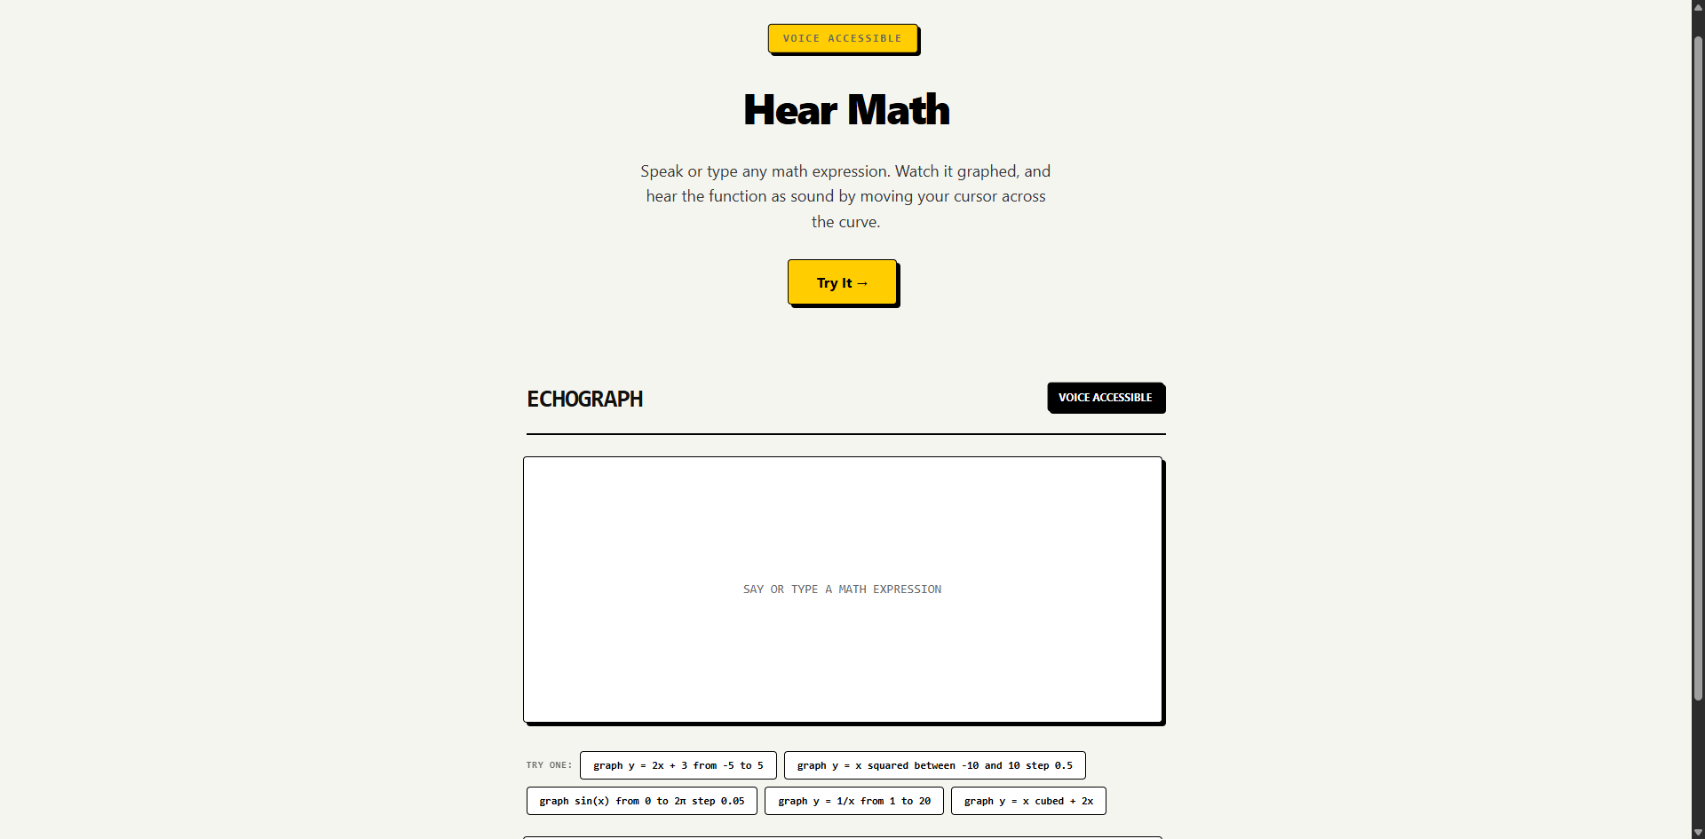
About EchoGraph
I was inspired by a conversation with a blind friend who loves math but struggles with visual graphing tools. They told me they rely on mental models and someone describing curves aloud. I wanted to build something that lets anyone feel math through sound.
I learned that sonification is surprisingly intuitive, the human ear is incredibly good at detecting pitch changes, which map naturally to y-values. But scaling a function's range into audible frequencies without clipping or losing detail is tricky. I also got deeper into React refs and pointer events for the touch‑drag interaction on mobile.
The app is built with React + Vite on the frontend and a Vercel serverless function that calls Groq's LLaMA 3.3 70B to parse natural language into structured math expressions. math.js evaluates the function on the client, and Tone.js generates the audio sweep. The UI is neobrutalism, thick borders, bold shadows, yellow accents.
Biggest challenge: making the pointer‑tracking work smoothly on mobile. The browser doesn't fire pointermove continuously during a touch‑drag without explicitly capturing the pointer. setPointerCapture and touch-action: none fixed it. Also handling edge cases where mathjs throws cryptic errors from malformed expressions, I wrapped those in a try‑catch with a user‑friendly message.

Log in or sign up for Devpost to join the conversation.