-
-
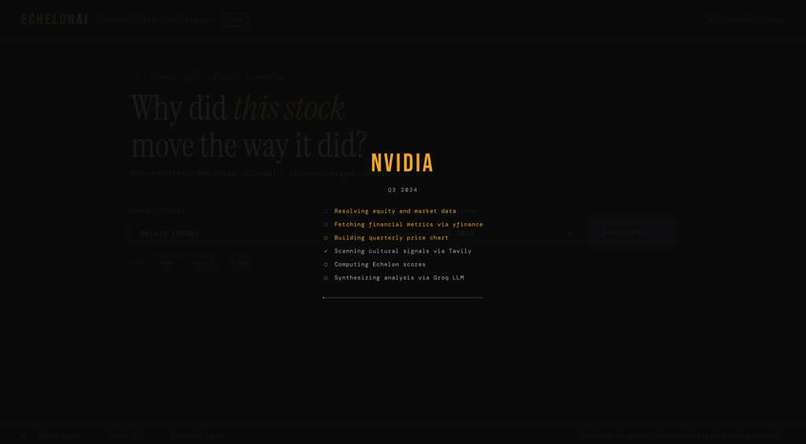
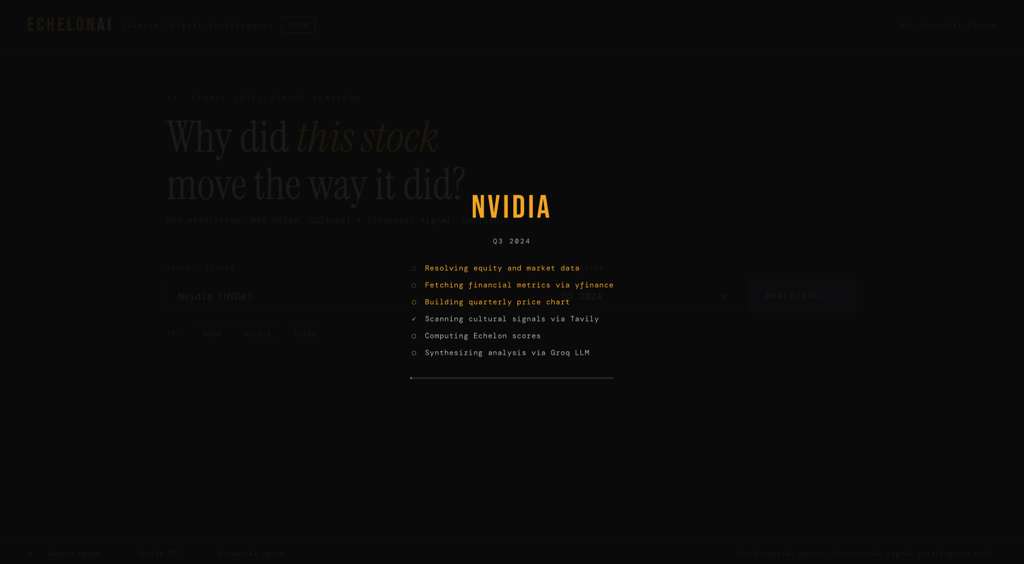
Agents Running
-
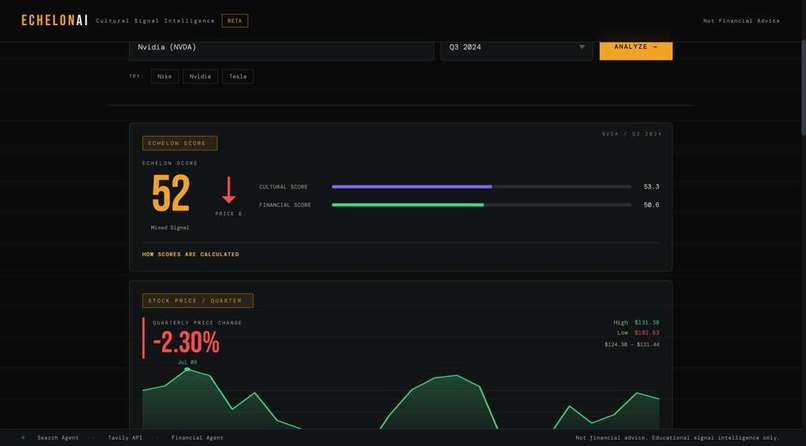
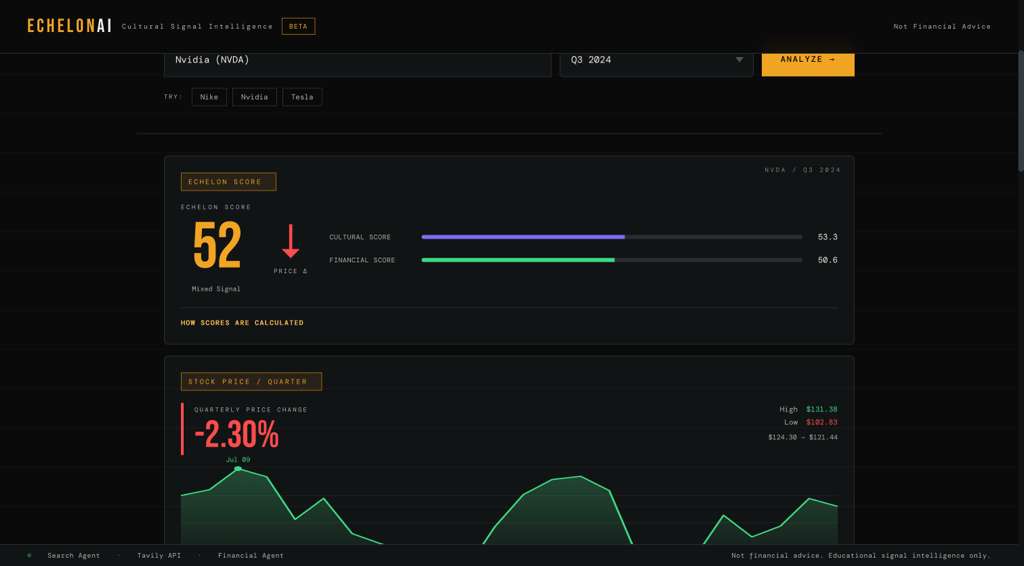
Echelon Score
-
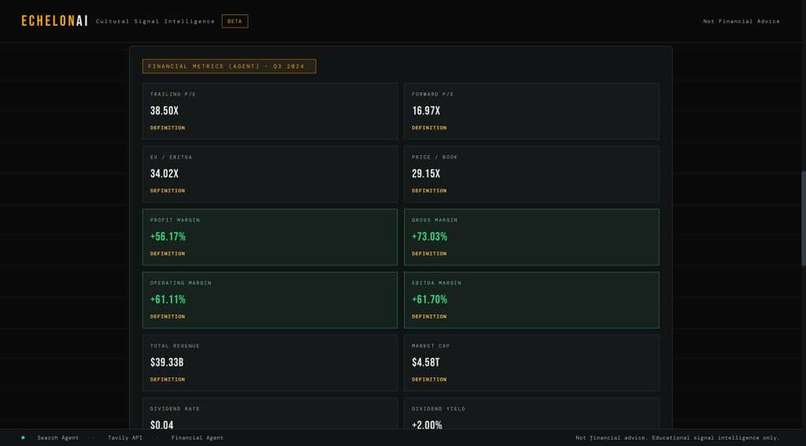
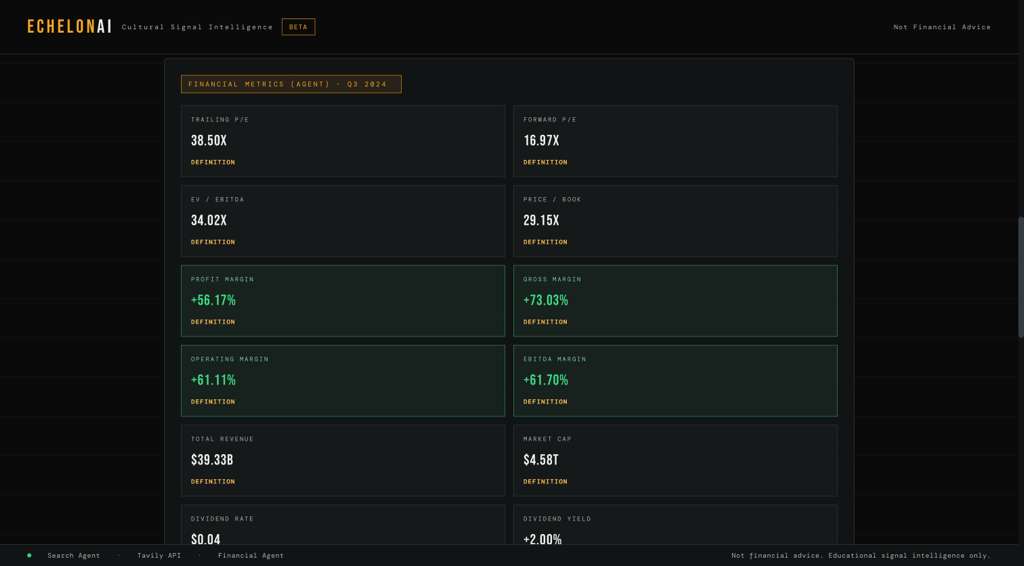
Financial Metrics
-
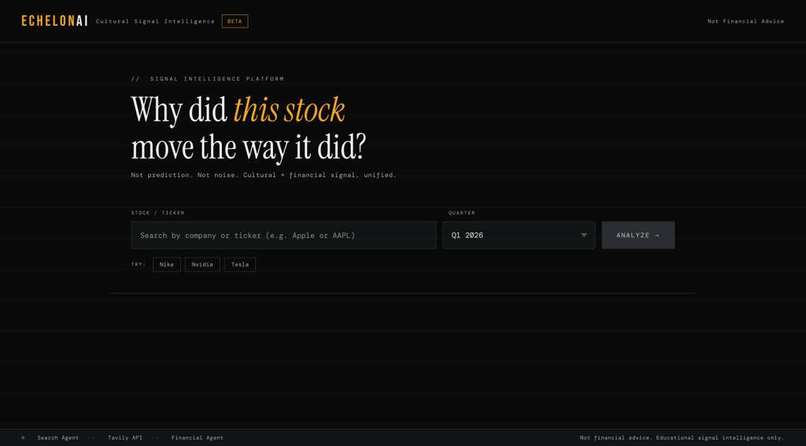
HomePage
-
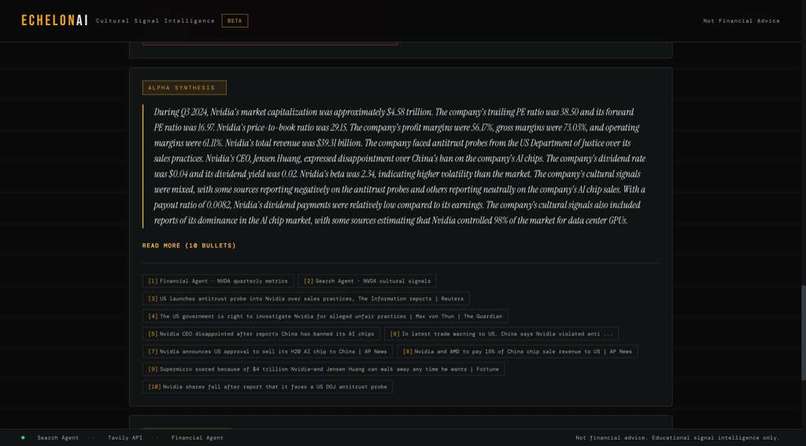
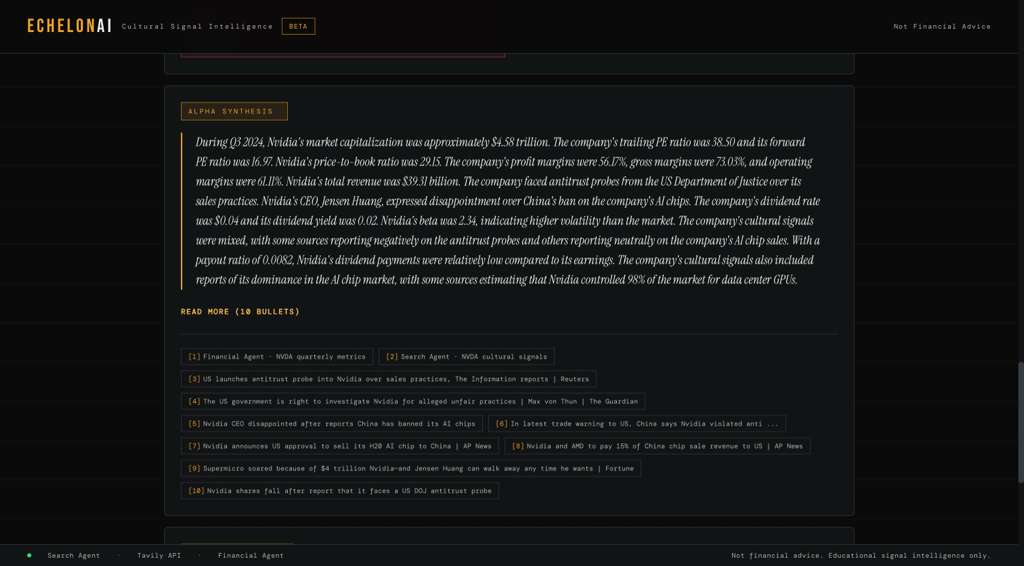
AI Summary
Inspiration
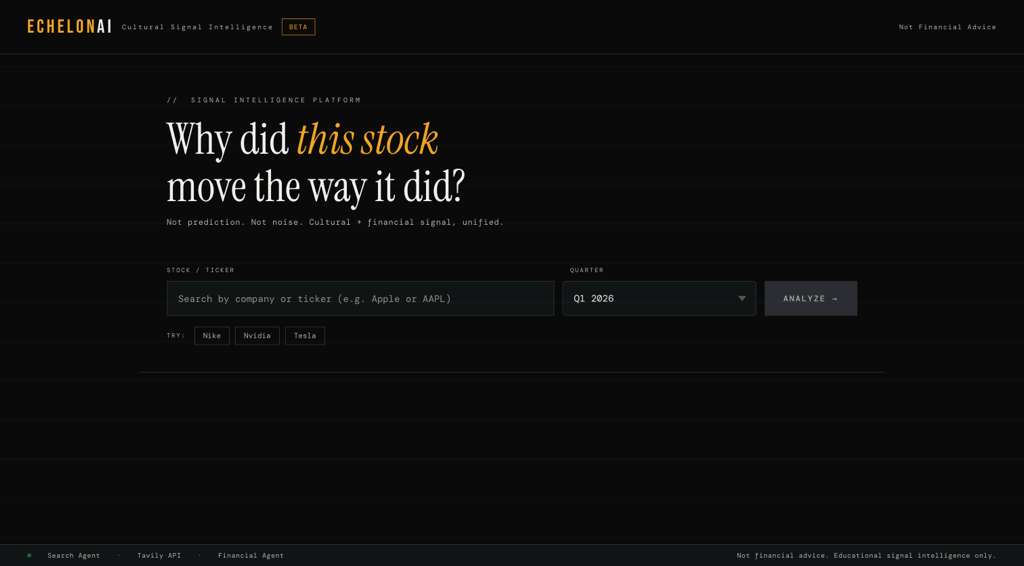
Every time a stock made a dramatic move, we found ourselves asking the same question — why did this actually happen? Financial platforms showed us the numbers. News platforms showed us the headlines. But nobody was connecting the two into one coherent explanation. That gap — between cultural momentum and financial reality — is exactly what inspired us to build EchelonAI.
What it does
EchelonAI is an educational signal intelligence platform that takes any publicly listed company and a selected quarter, then explains exactly why that stock moved the way it did. We pull live financial metrics via yfinance — P/E, ROE, margins, FCF, debt/equity, revenue and earnings growth — retrieve cultural signals from reputable outlets like Reuters, Bloomberg, CNBC, WSJ, and the Financial Times via Tavily, and synthesize everything through a Groq LLM into a single unified Echelon Score (0–100) with a directional signal, bullet-point reasoning, and cited sources. The score is a weighted composite: 55% financial fundamentals, 30% cultural sentiment, and 15% media momentum. Not a prediction. A retrospective narrative grounded entirely in real data.
How we built it
EchelonAI runs on a five-stage parallel pipeline. The frontend is built in React 18 with TypeScript, Vite, and TailwindCSS. The data layer is a Python 3.14 agent pipeline with two specialist agents — financial_agent.py pulls and processes quarterly metrics and OHLC price history via yfinance, and search_agent.py retrieves news articles via Tavily, scores them using a sentiment lexicon, and weights them by outlet traffic with a 35% single-outlet cap to prevent dominance. A Node.js bridge handles Yahoo Finance equity autocomplete and ticker resolution. The Vite dev server exposes five middleware routes connecting the frontend to the data layer. Finally, Groq's Llama 3.3 70B generates the Echelon Synthesis in JSON mode — a past-tense retrospective grounded only in the fetched data with cited metrics and signals.
Challenges we ran into
Tavily's date filtering counts backward from today rather than supporting true date ranges, which made per-quarter isolation unreliable for historical queries. We worked around this by domain-restricting searches to reputable outlets and weighting by outlet traffic to improve signal quality. Normalizing financial metrics across companies of vastly different sizes and sectors into a single comparable score required careful clamping and weighting to avoid outliers dominating the output. Keeping the LLM synthesis strictly retrospective and grounded — never speculative — required precise prompt engineering and JSON mode enforcement on every Groq call.
Accomplishments that we're proud of
We're proud of the Echelon Score formula itself — a transparent, weighted composite of three independently computed signals with clearly defined metric contributions and directional logic. We're proud that the financial agent covers nine distinct metrics across income statements, cash flow statements, and balance sheets, all pulling live quarterly data. And we're proud of the animated loading screen that shows each pipeline stage running in real time — it makes the architecture legible to judges and users alike. Most importantly we built a demo clean enough to walk through end to end in under two minutes with three hardcoded examples covering Nike Q3 2024, Nvidia Q3 2024, and Tesla Q4 2023.
What we learned
We learned that scoring is harder than fetching. Getting clean data from yfinance and Tavily was straightforward — deciding what that data means, how much weight each metric deserves, and how to communicate the output without overpromising took far more iteration. We also learned that LLM grounding requires discipline — the synthesis prompt went through multiple revisions to ensure the model only reasoned from fetched data and never introduced outside speculation. Prompt engineering is as important as data engineering.
What's next for EchelonAI
The immediate next step is expanding beyond quarterly analysis into monthly and weekly time windows for higher resolution signal tracking. We want to add watchlist functionality so users can track the Echelon Score of multiple companies over time and receive alerts when cultural sentiment and financial fundamentals diverge sharply — that divergence is the most actionable signal the platform produces. Longer term we see EchelonAI becoming the platform that teaches the next generation of investors how to read the world, not just the chart.
Built With
- groq-api-(llama-3.3-70b)
- python-3.14
- react-18
- tailwindcss
- tavily-api
- typescript
- vite
- yahoo-finance2
- yfinance

Log in or sign up for Devpost to join the conversation.