-
-
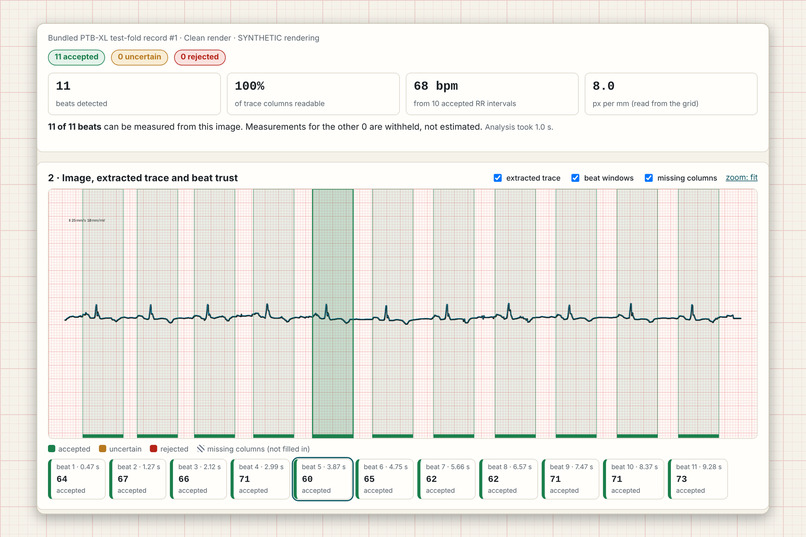
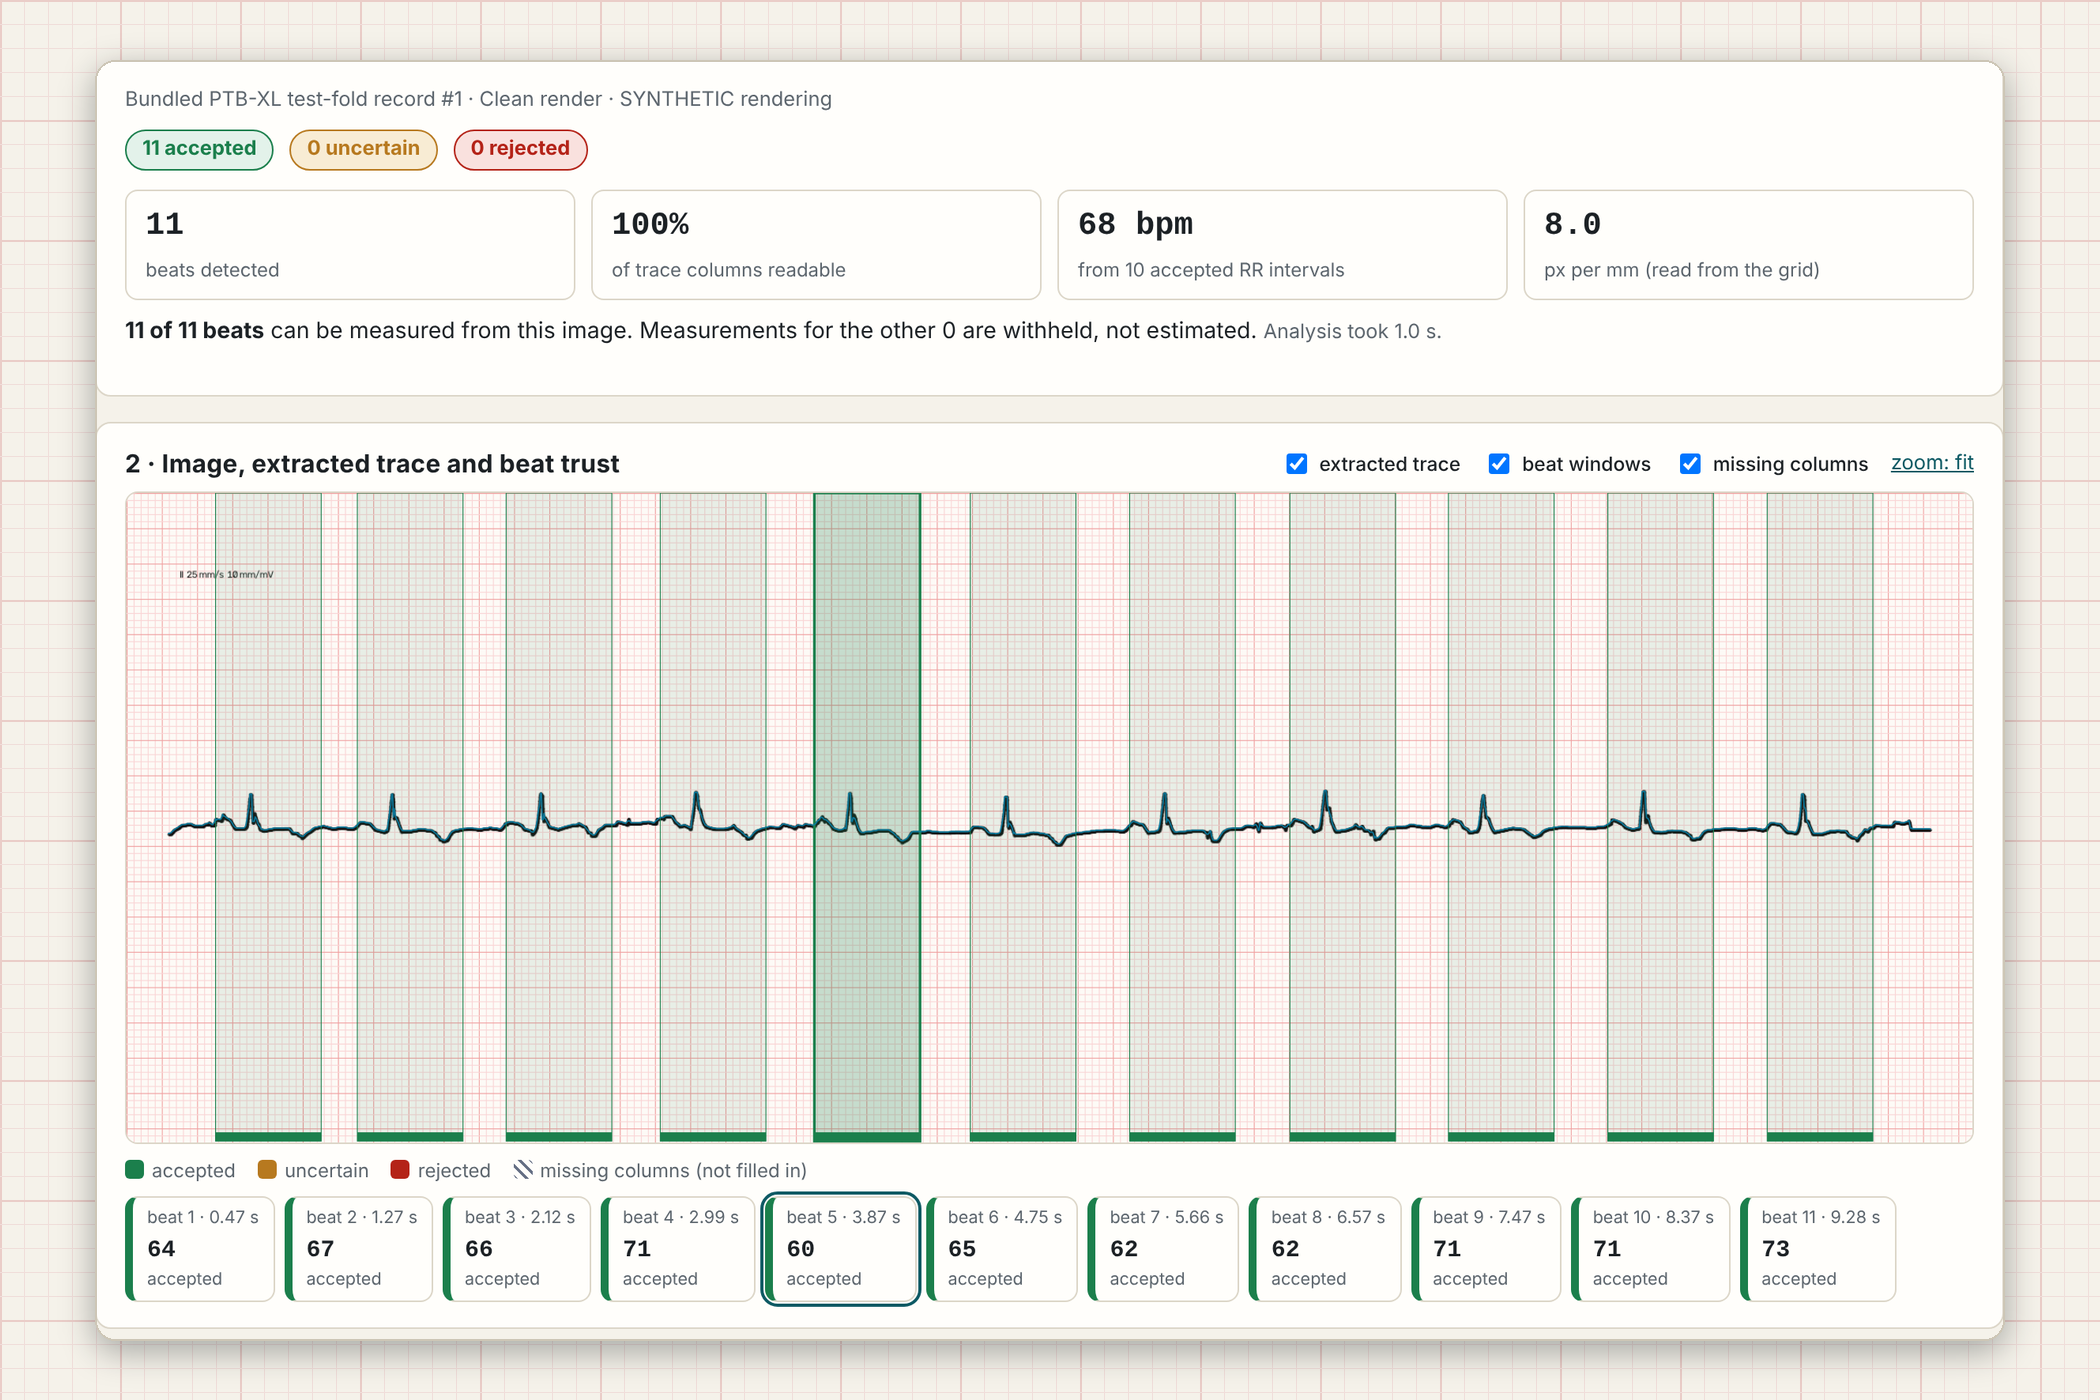
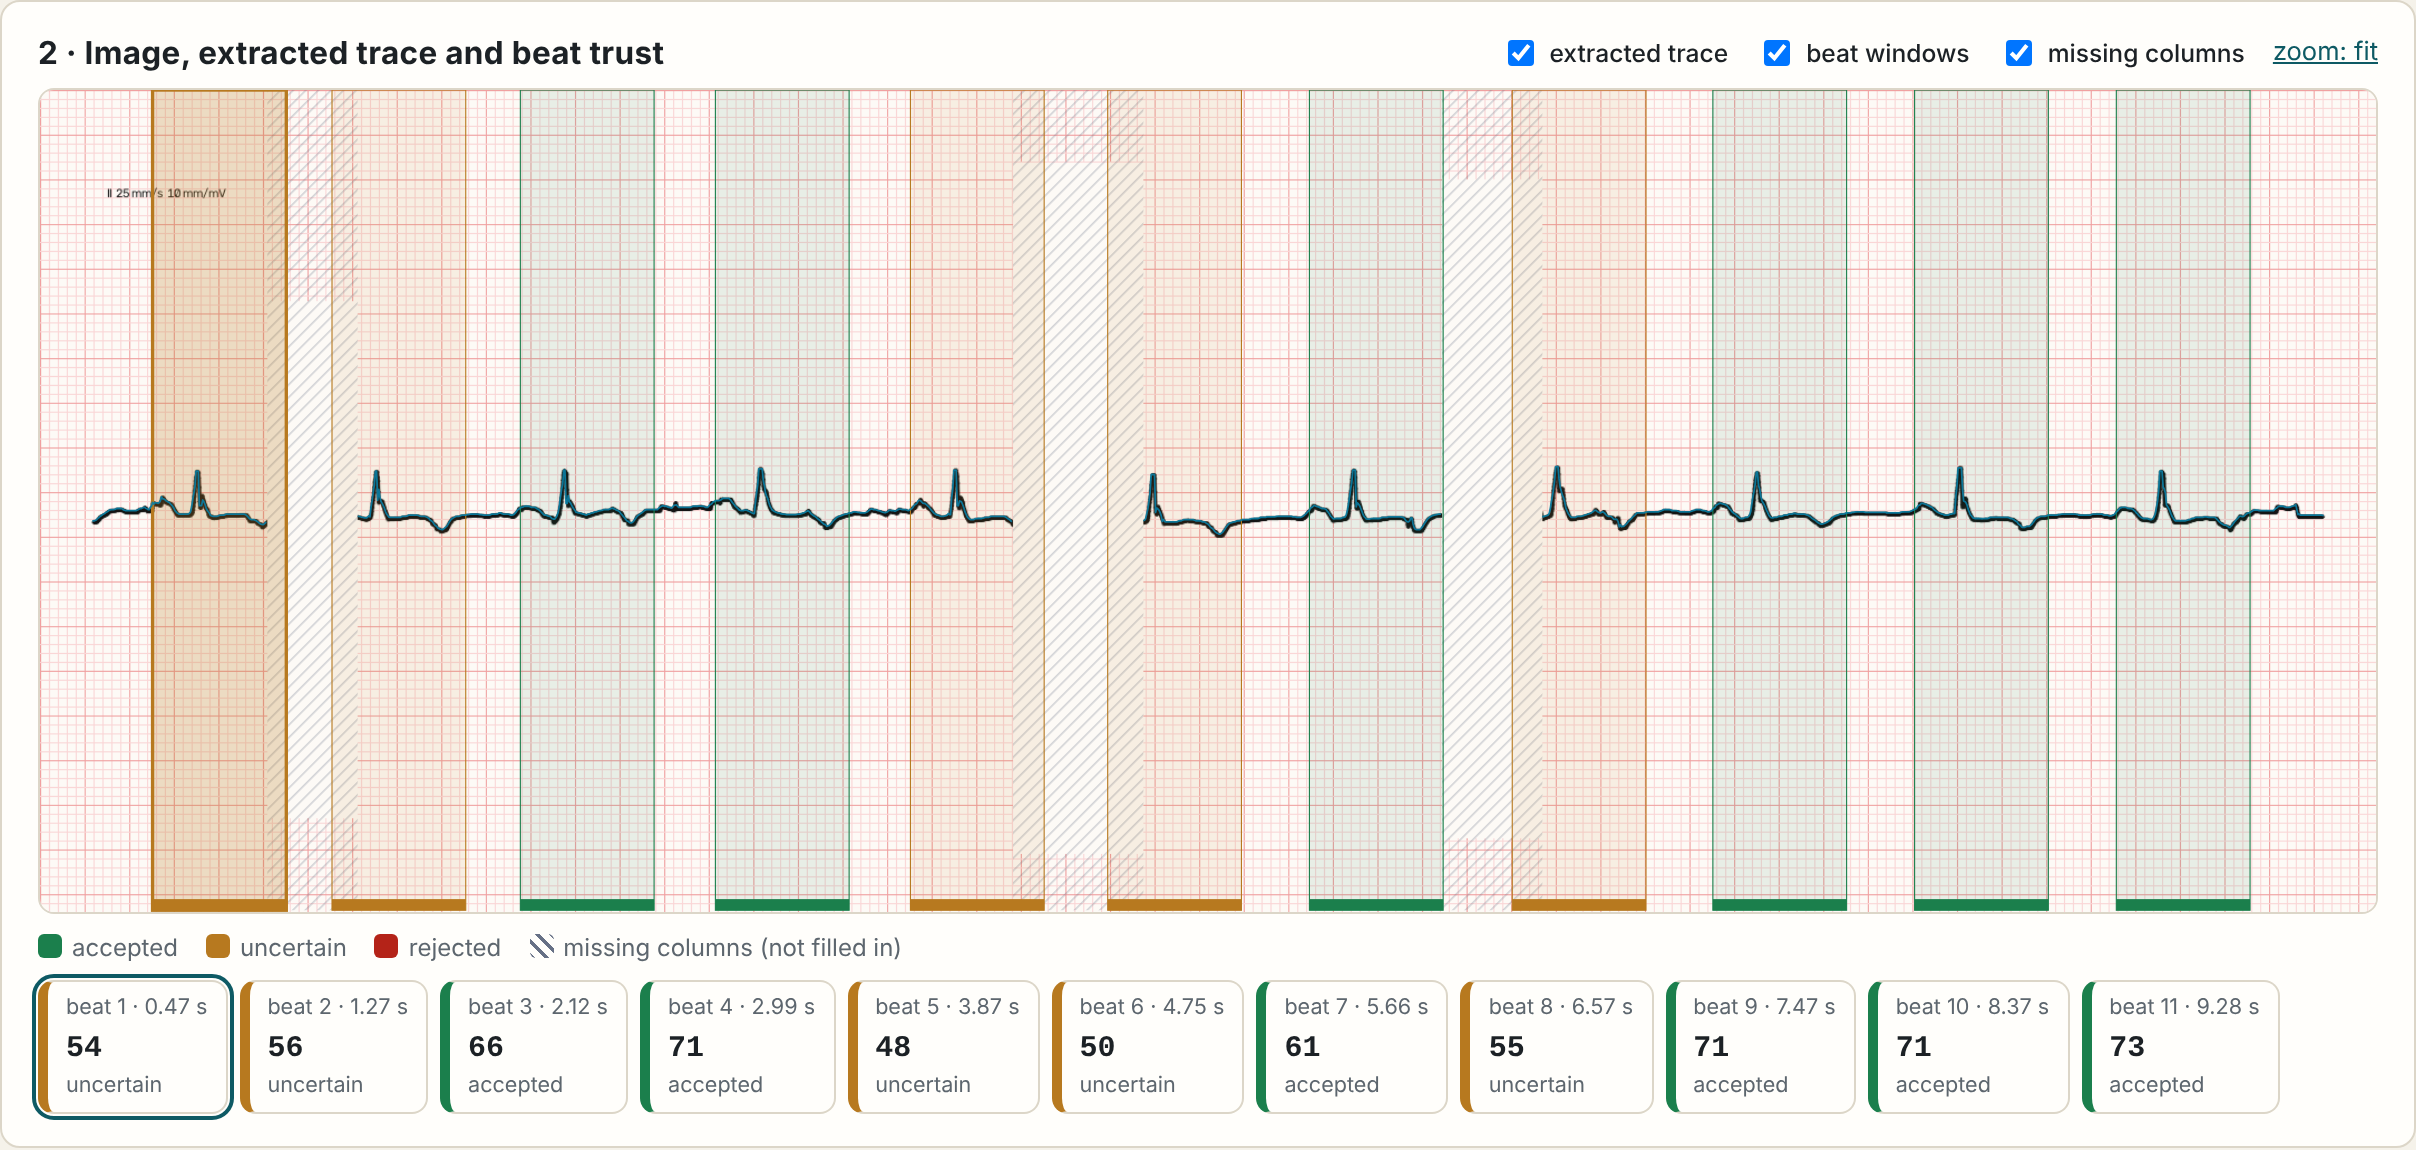
Every heartbeat gets a trust score, computed from the image alone.
-
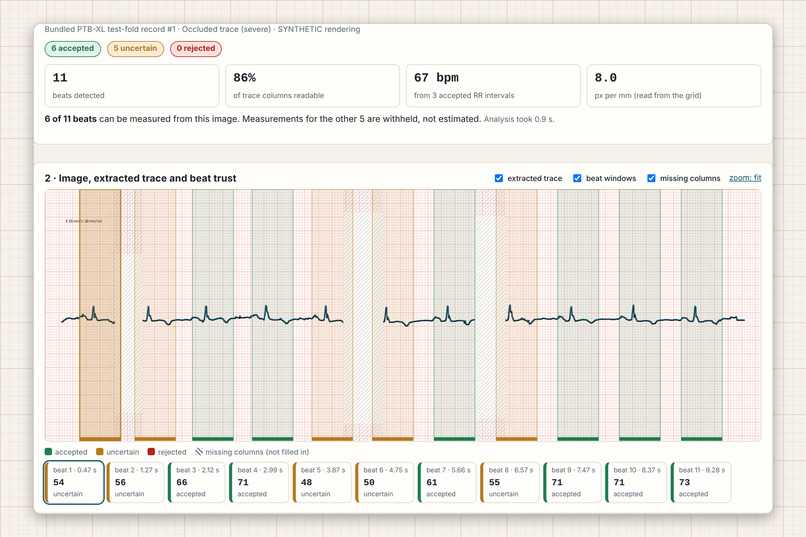
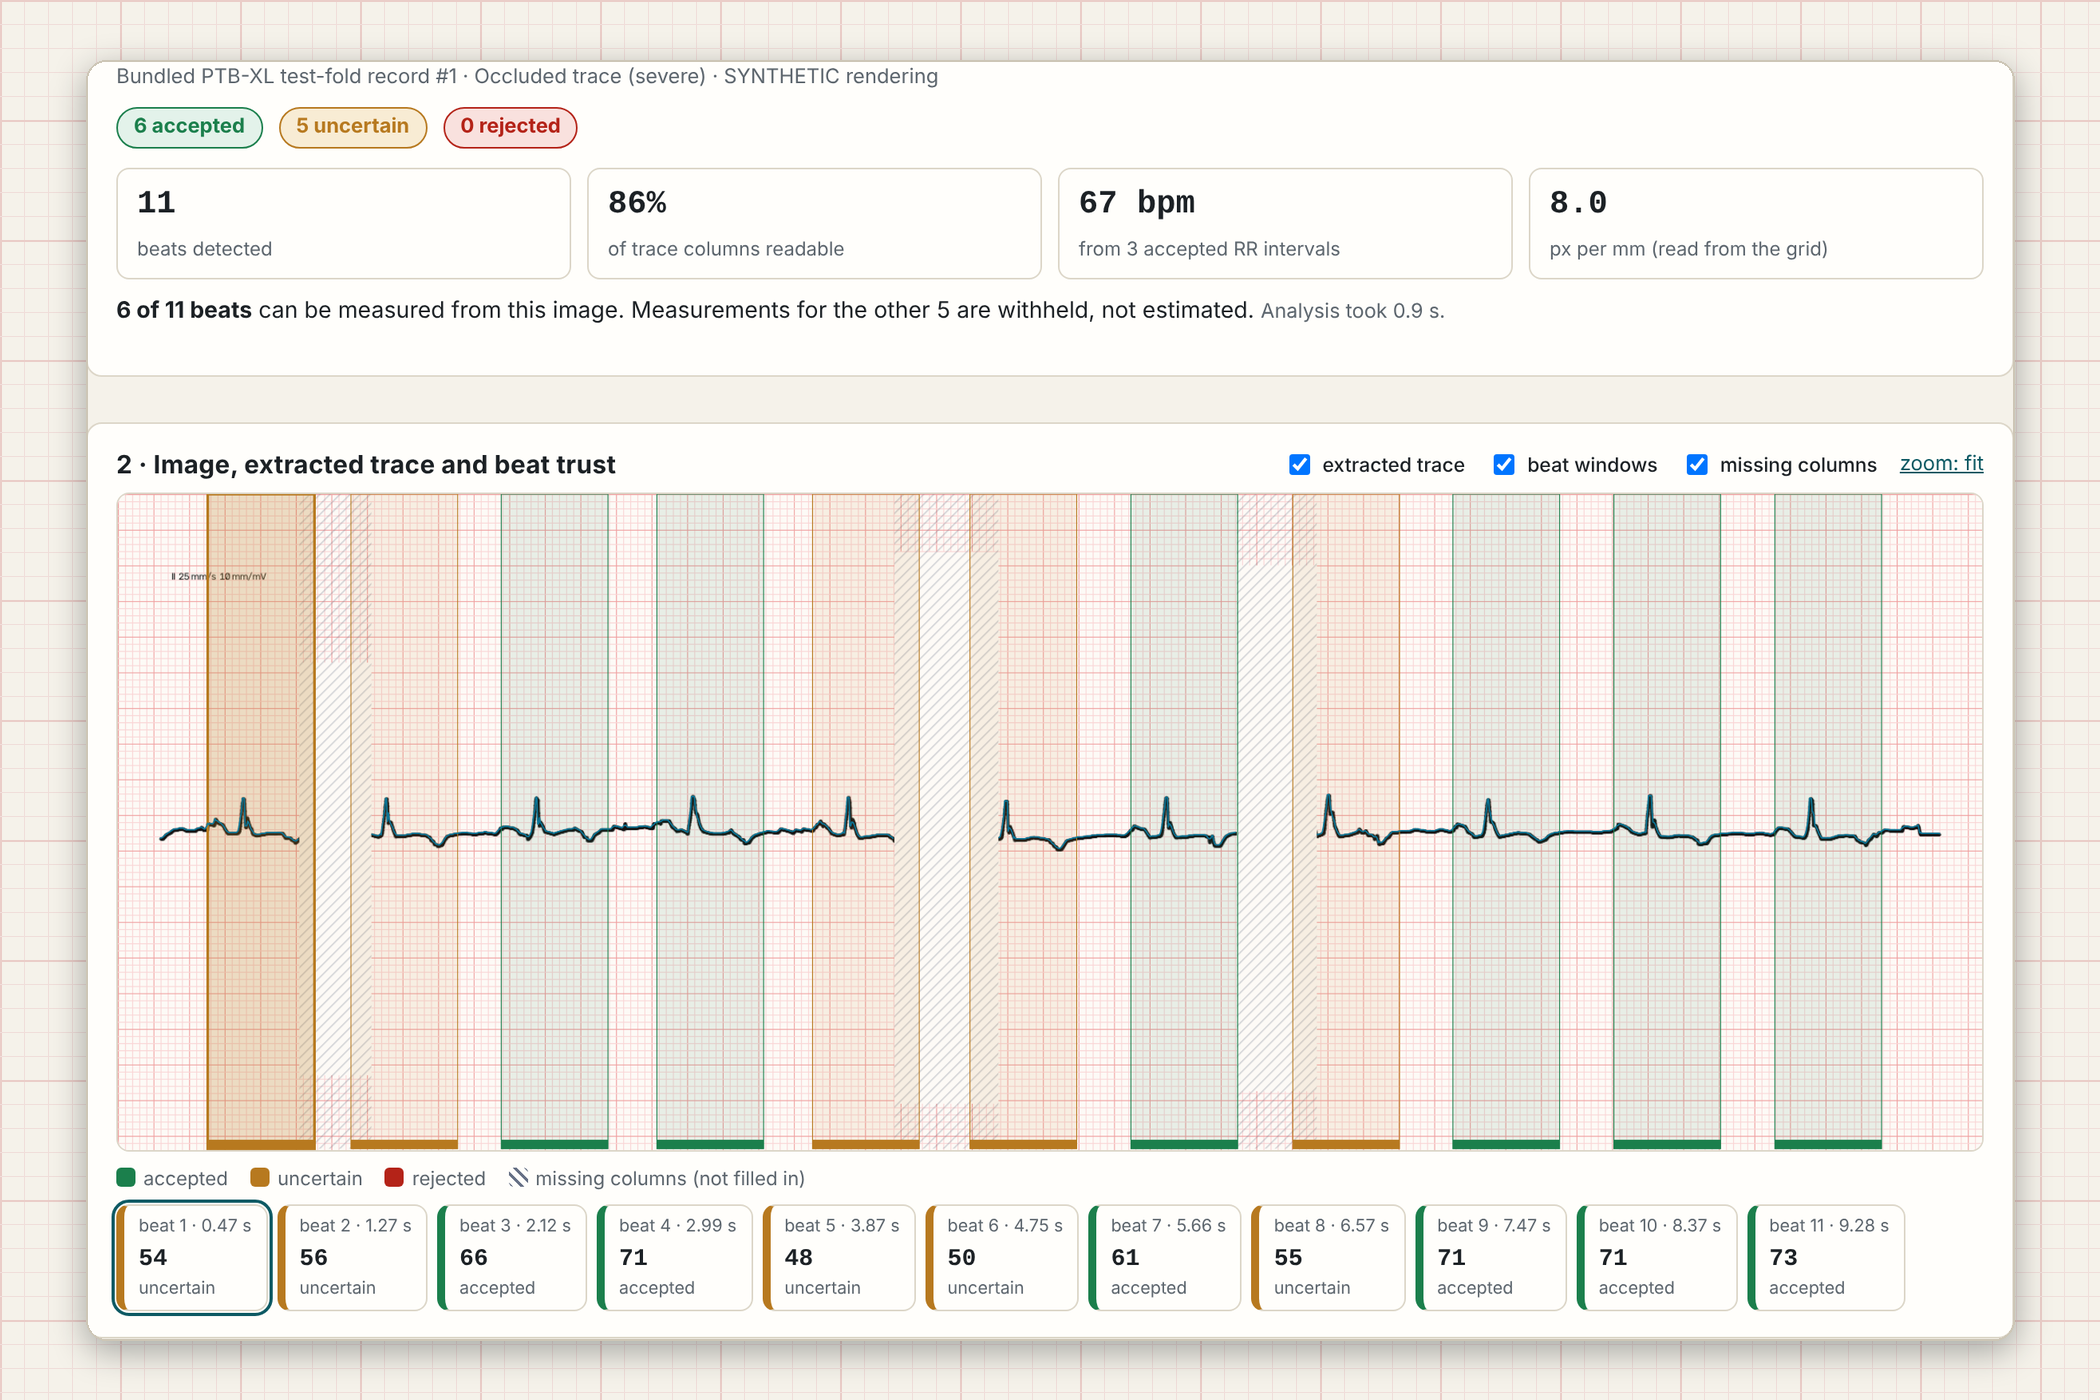
Occluded trace: unreadable columns show as gaps and are never filled in.
-
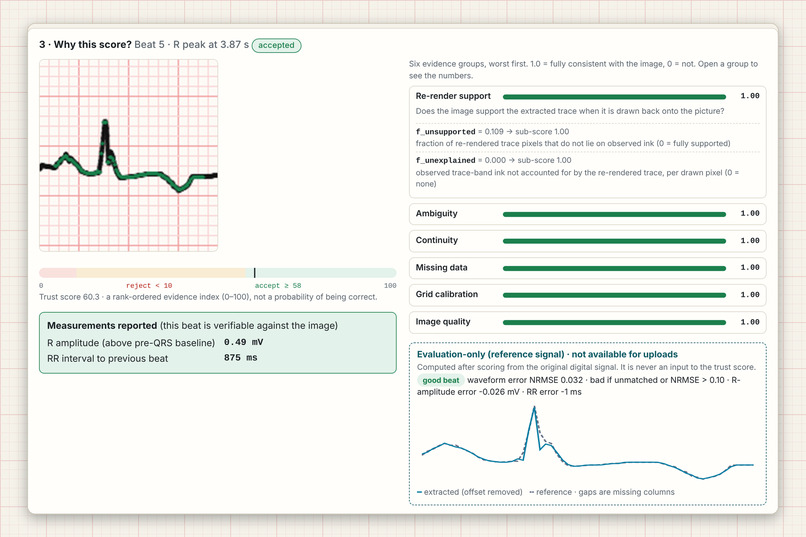
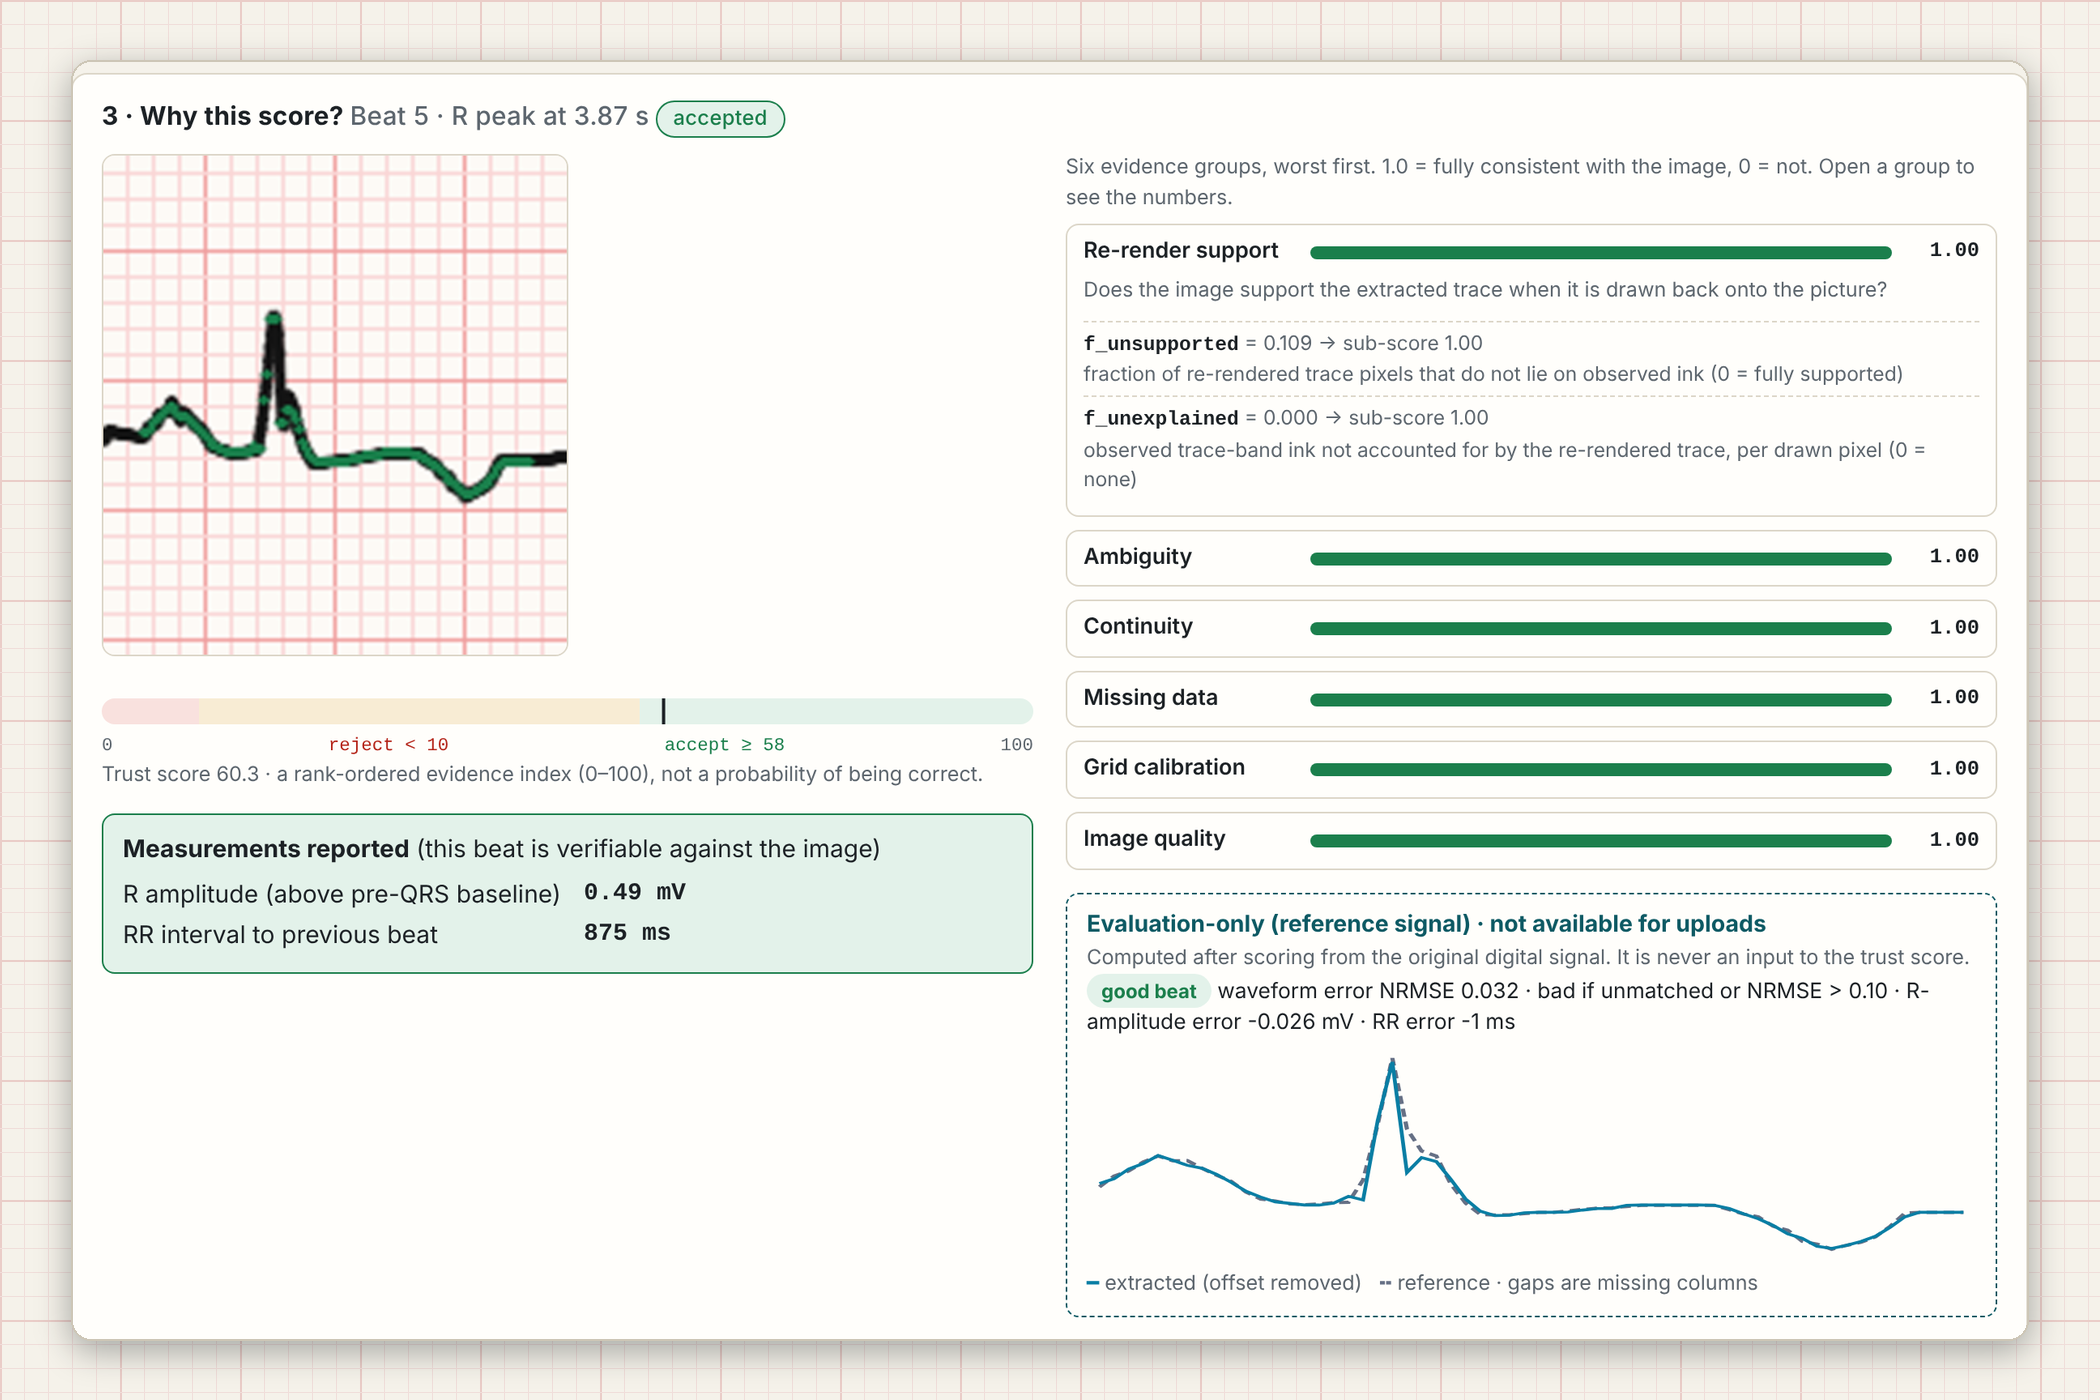
The evidence inspector shows six evidence groups behind every beat’s score.
-
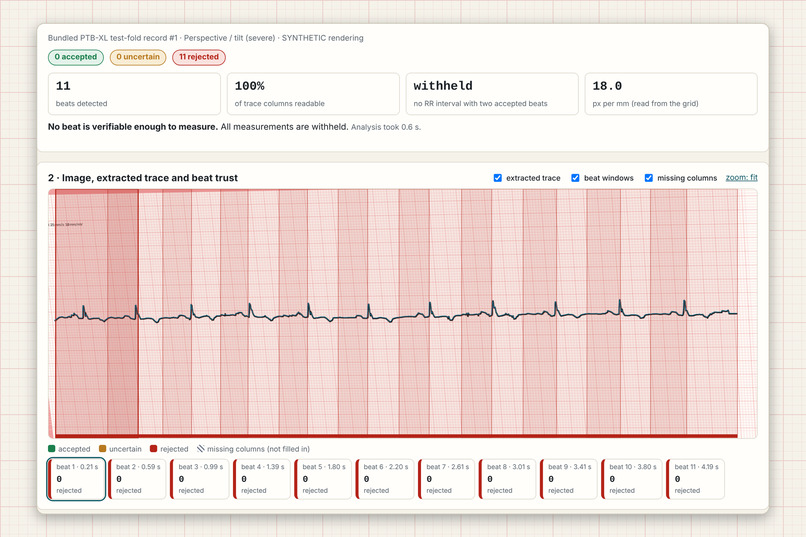
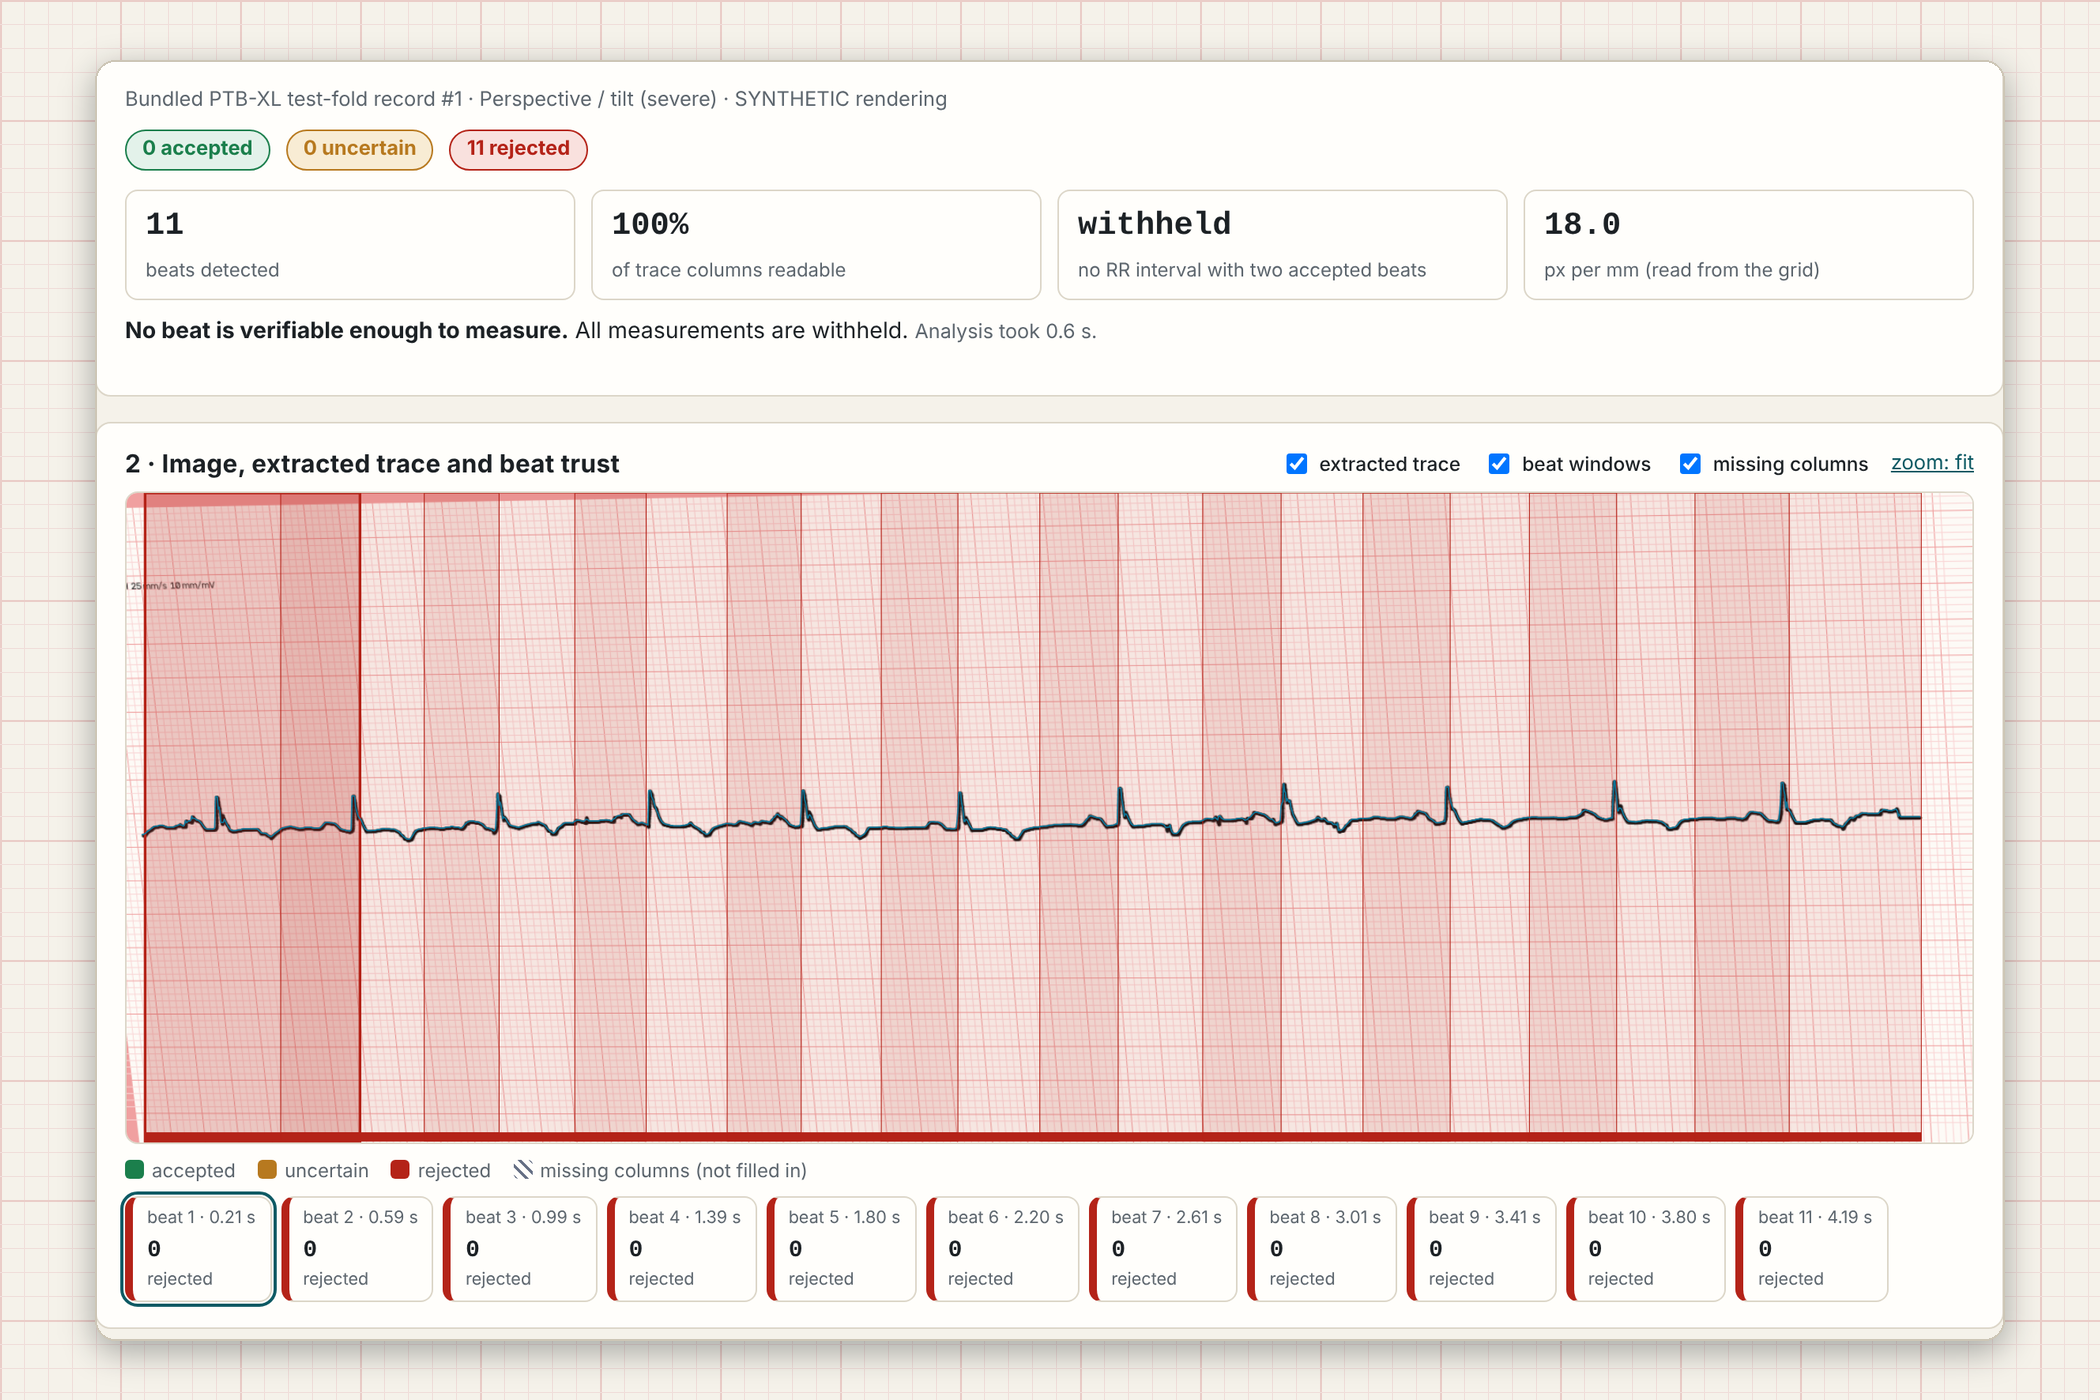
Severely tilted image: every beat is rejected and measurements are withheld.
-
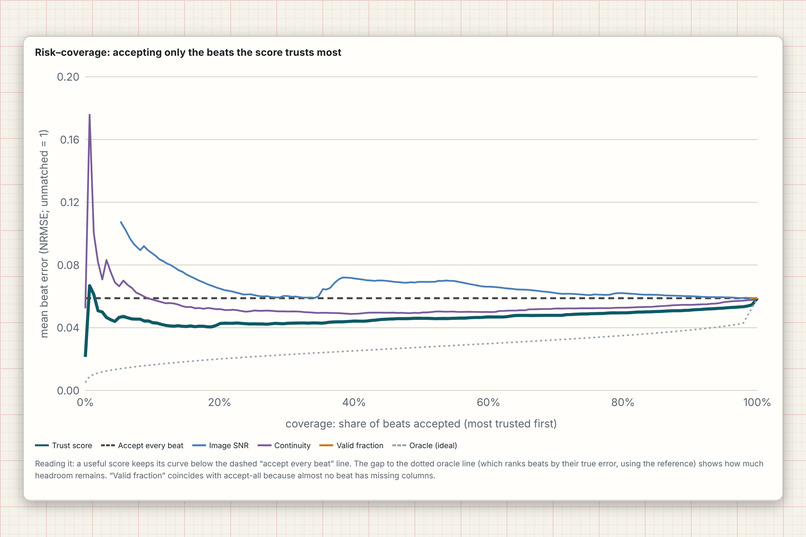
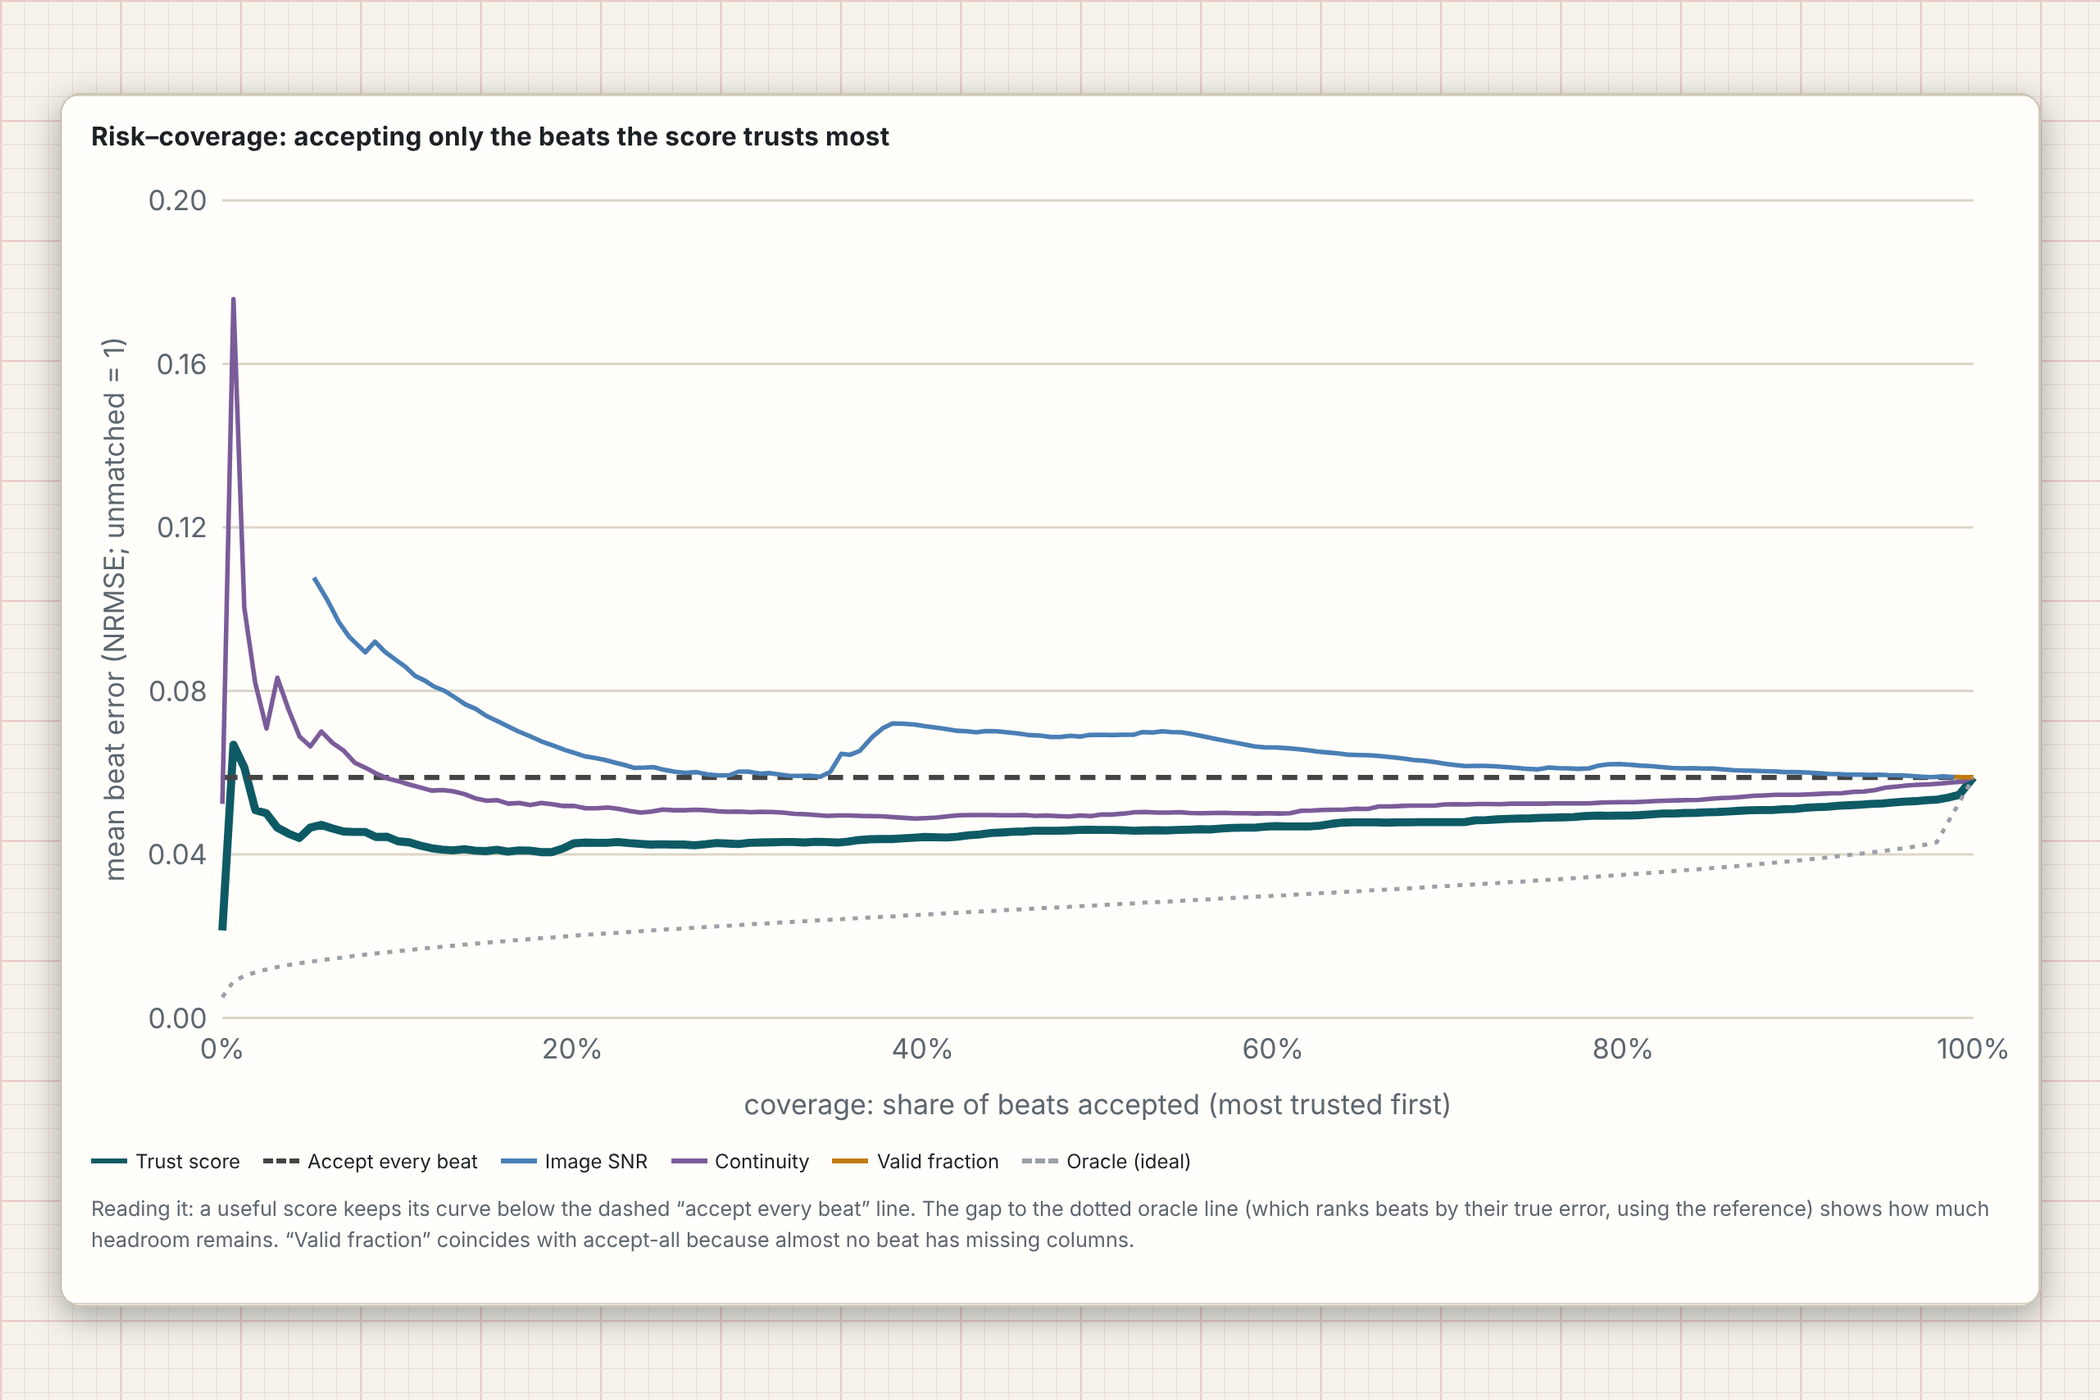
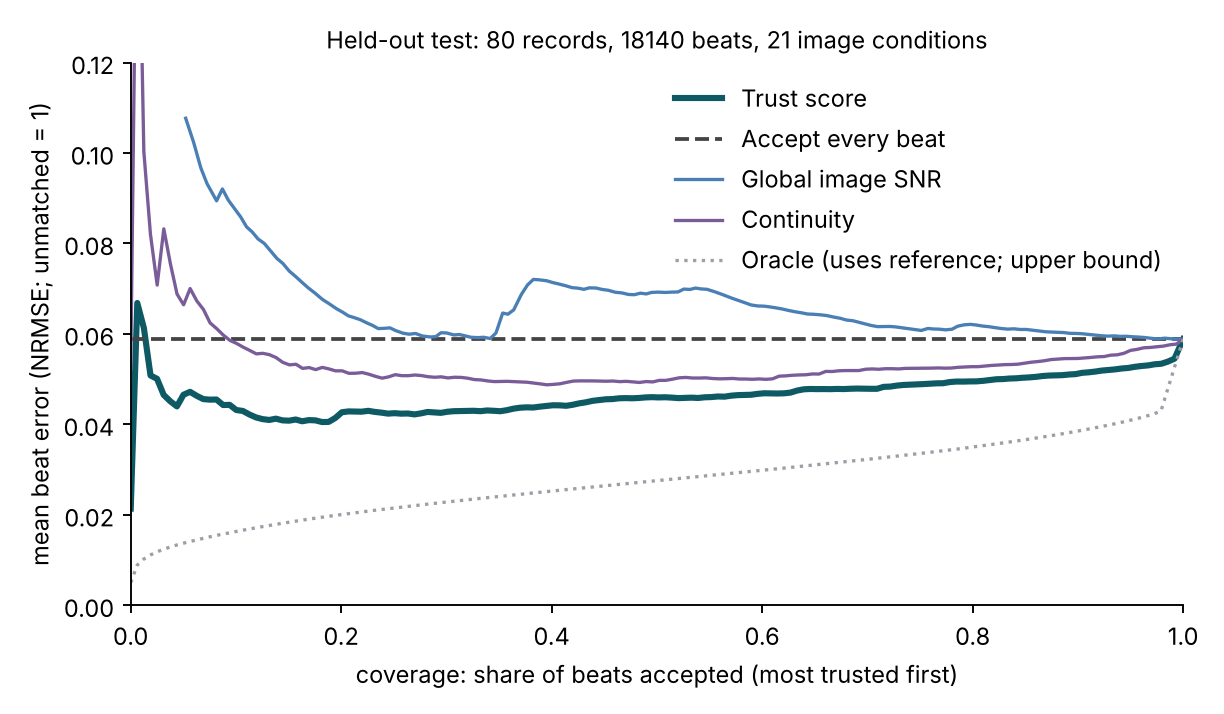
Risk-coverage curves: accepting the most trusted beats first lowers error.
-
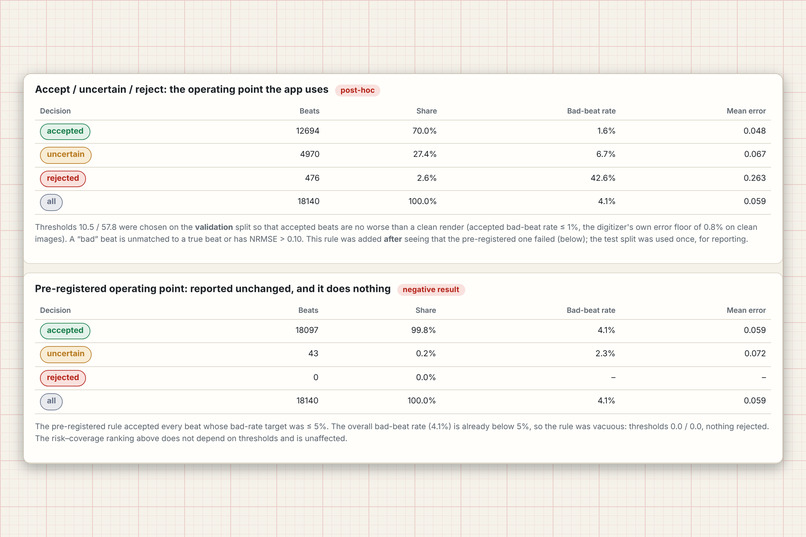
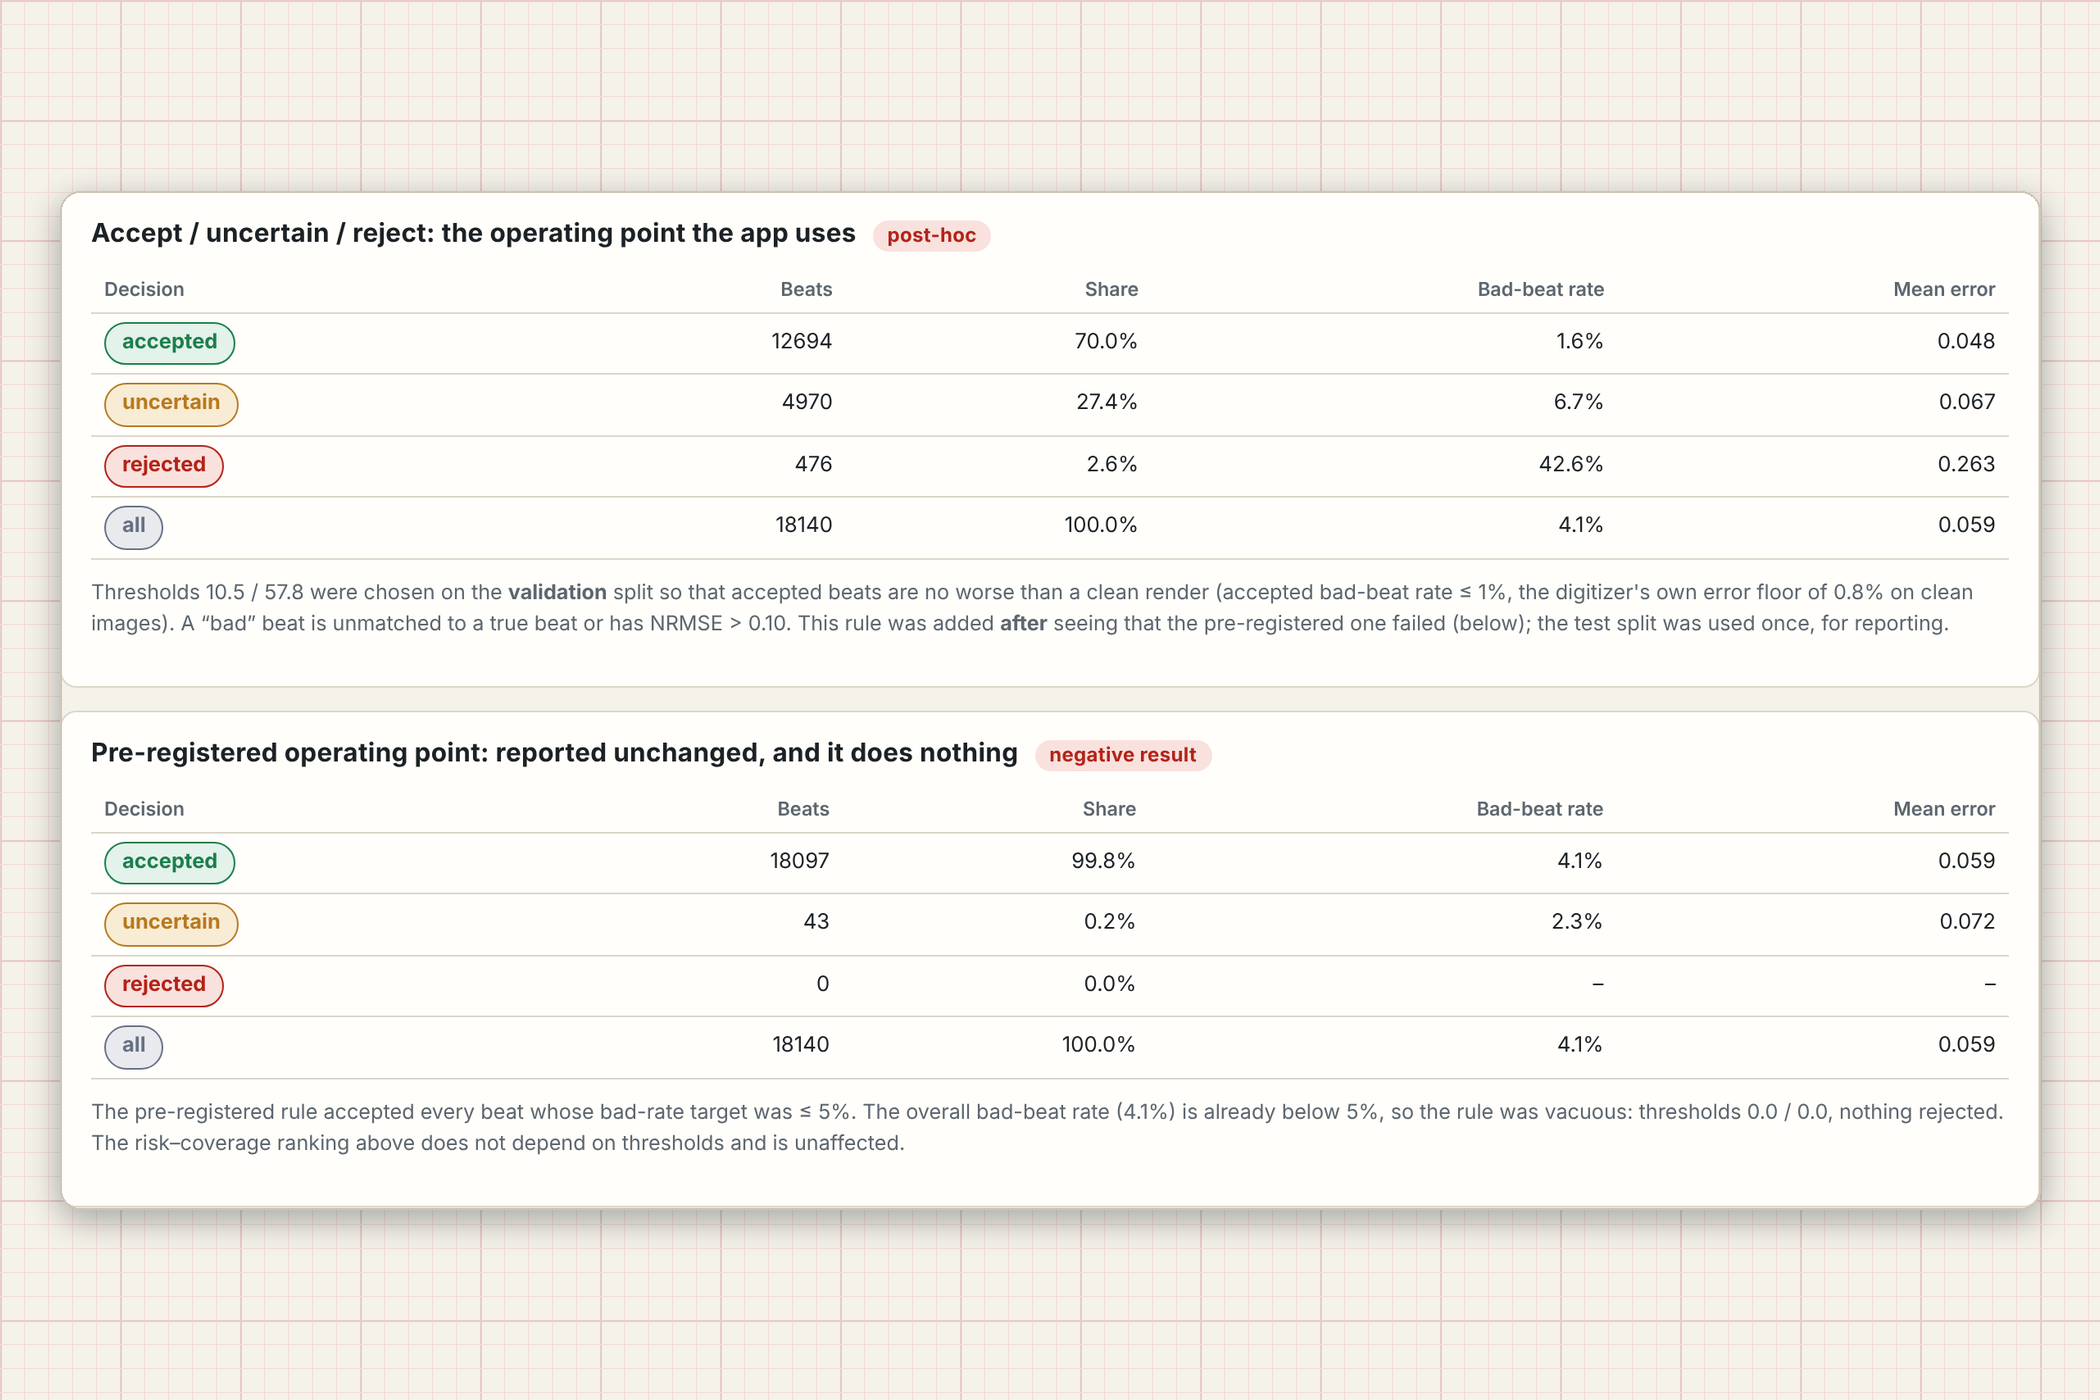
Operating points, including the pre-registered rule that turned out to do nothing.
-
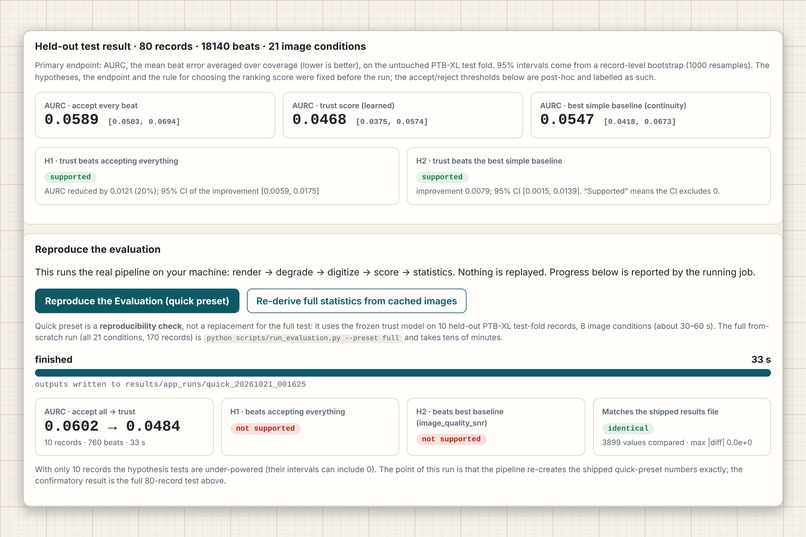
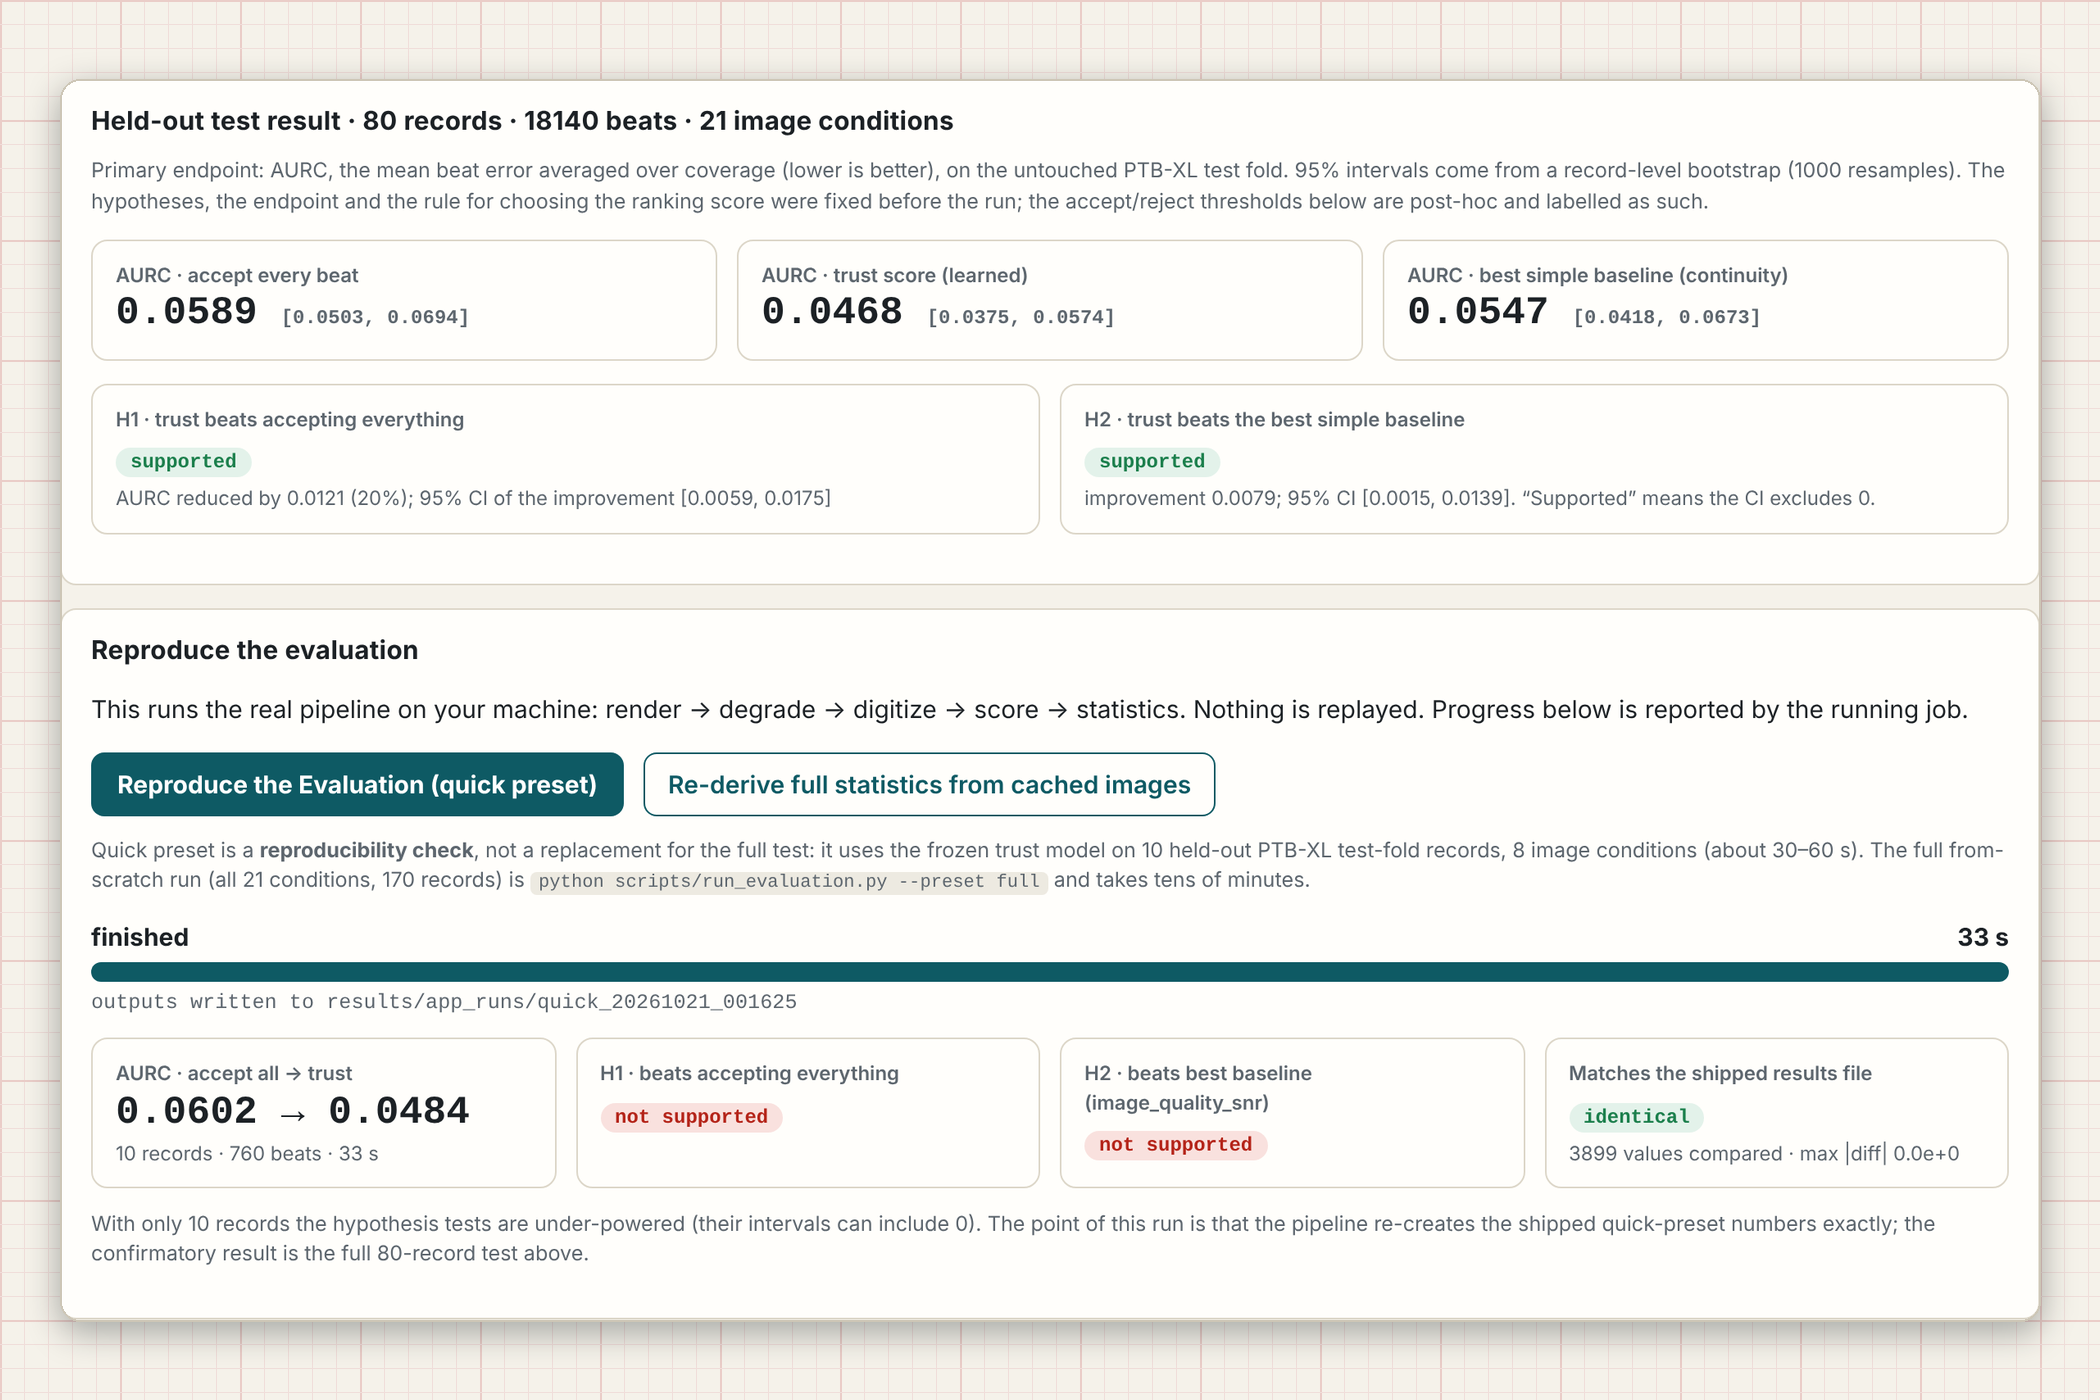
Held-out results, plus a real “Reproduce the Evaluation” button.
Inspiration
ECG digitizers turn a picture of a paper ECG into a signal, and then every number downstream (heart rate, RR interval, R-wave amplitude) is trusted as if the reconstruction were perfect. It isn't. A smudged grid, an occluded stretch of trace, a tilted photo or a thick pen line can quietly corrupt a beat, and the digitizer still returns a clean-looking waveform with no sign of which parts it actually read and which parts it guessed.
We kept coming back to one question: for each heartbeat, how well does the original image support the reconstruction? Existing work mostly asks how to digitize better. We wanted to build the missing layer that says which beats you can still verify, and that stays silent about the ones you can't.
What it does
ECG Trust Layer takes an image of a paper ECG and, from the image alone (no reference signal), gives every detected beat a trust score from 0 to 100 and a decision: accepted, uncertain, rejected, or unable for the whole image.
- Measurements (R amplitude, RR interval, heart rate) are reported only for accepted beats. Everything else is withheld. Nothing is filled in or interpolated.
- Columns the extractor could not read are shown as explicit gaps over the image, never as a smooth line.
- An evidence inspector opens for any beat and shows six evidence groups with every feature value and what it means.
- A real Reproduce the Evaluation button runs the actual pipeline (render, degrade, digitize, score, statistics) with genuine progress and compares the result with the shipped results file.
The score is a rank-ordered evidence index, not a probability. To be clear about scope: this is a research prototype. All images are synthetic renderings of PTB-XL signals, not photographs of real paper ECGs. It is not a medical device and makes no clinical claims.
How we built it
Data and images. We used PTB-XL v1.0.3 (CC BY 4.0), lead II at 500 Hz, the official folds, one record per patient, seed 2026. Each signal is rendered to a synthetic ECG-paper image and then degraded under 21 stress conditions (blur, thick trace, occlusion, perspective, and so on). Because we know the true signal, we can measure how wrong each extracted beat really is.
Digitizer. A classical extractor: per-strip grid calibration (no assumed pixel size), then a Viterbi dynamic program over the trace with an explicit missing state, so unreadable columns stay missing. Beats are found with a Pan-Tompkins detector.
Trust features. 14 image-only features in six groups:
| Group | Question it answers |
|---|---|
| Re-render support | Does the image support the extracted trace? |
| Ambiguity | Were there competing ink strokes? |
| Continuity | Is the waveform physically smooth? |
| Missing data | Were columns unreadable? |
| Grid calibration | Is the grid self-consistent (scale, tilt, residual)? |
| Image quality | Resolution, sharpness, ink-to-noise near the beat |
The most important group re-draws the extracted trace onto the picture and compares it with the ink actually observed. We built a heuristic score and a learned (logistic regression) score, and the rule for choosing between them was fixed in advance on validation data.
Endpoint. The primary metric is the area under the risk-coverage curve. If \( e(c) \) is the mean beat error over the most-trusted fraction \( c \) of beats, then
$$ \mathrm{AURC} = \int_0^1 e(c)\, dc $$
Lower is better. It is estimated with a record-level paired bootstrap, and accept-all, a best simple baseline, and an oracle are reported alongside the trust score.
App and tooling. Python and NumPy for the pipeline, Flask plus vanilla JavaScript for the local app (uploads are analysed in memory and never written to disk), 66 automated tests with pytest, Playwright to record the demo from the real running app, and Piper TTS plus FFmpeg for the synthetic voice-over.
Challenges we ran into
- Our own pre-registered rule turned out to be vacuous. The operating point we committed to in advance ("accept beats while the accepted bad-beat rate stays at or below 5%") accepted every beat, because the overall bad-beat rate (4.1%) was already under 5%. We report that result unchanged and added one clearly labelled post-hoc operating point (accepted bad rate at most 1%).
- A real bug in how we scored RR intervals. An undetected gap could produce a double-length RR interval that was scored as having zero error. We fixed it by making an RR interval reportable only when both bounding beats are accepted and the span between them is fully observed, added a regression test, and disclosed the change in the report.
- Honest negatives. The trust score does not help with severe blur, and under severe thick-trace conditions 15% of accepted beats are still bad. Dropping the image-quality feature group actually improved the heuristic score, so that group needs rethinking.
- Keeping it leak-free. The reference signal must never touch the score. A structural test enforces that, and the test fold was untouched until the final run.
Accomplishments that we're proud of
On the held-out test set (80 records, 18,140 beats, 21 image conditions):
| AURC (95% CI) | |
|---|---|
| Accept every beat | 0.0589 (0.0503 to 0.0694) |
| Best simple baseline (continuity) | 0.0547 (0.0418 to 0.0673) |
| Trust score (learned) | 0.0468 (0.0375 to 0.0574) |
- H1 supported: trust beats accept-all by 0.0121 (about 20% lower), bootstrap CI [0.0059, 0.0175].
- H2 supported, narrowly: trust beats the best simple baseline by 0.0079, CI [0.0015, 0.0139]. It was not supported on the validation split, and we say so.
- At the post-hoc operating point, 70% of beats are accepted with a 1.6% bad-beat rate (4.1% overall). R-amplitude, RR and heart-rate error tails shrink when only accepted beats are measured (for example, the 90th-percentile R-amplitude error falls from 0.048 to 0.037 mV).
We are equally proud of the process: a feasibility gate fixed before the evaluation (the extractor reproduced clean records with median NRMSE 0.032 against a 0.05 criterion, passing 60/60), pre-specified hypotheses and splits, and a one-command evaluation that reproduces the shipped results exactly.
What we learned
- Calibration of when to stay silent is a different problem from accuracy. Withholding has a real cost: about 30% of clean beats are withheld, and 366 of 1,571 images ended up with no reportable heart rate.
- Simple, physically motivated checks are a strong baseline. The learned score beat the best single baseline only narrowly, and not on every split.
- A pre-registered rule can fail in a way you did not foresee. Reporting that plainly, and labelling the fix as post-hoc, is more useful than quietly tuning until the numbers look good.
- Synthetic images make rigorous evaluation possible, but they are also the biggest limit on what we can claim.
What's next for ECG Trust Layer
- Real paper ECGs. Validate on genuine scans and photographs with expert-annotated beats. Performance on real images is unknown today.
- Better handling of the failure modes: severe blur, thick trace, and perspective, plus a redesigned image-quality feature group.
- Multi-lead and 12-lead layouts, and support for other digitizers, so the trust layer can sit on top of whichever tool a team already uses.
- Less conservative gating, to reduce the share of clean beats that get withheld.
- A cleaner confidence calibration, so scores can be compared across images and eventually reported with uncertainty rather than as a rank-ordered index.
Code, tests, results and the full report (including every protocol deviation): https://github.com/Abdullah49645/ecg-trust-layer
One-page project description (PDF): ECG Trust Layer one-pager
Built With
- bootstrap-statistics
- computer-vision
- css3
- dynamic-programming
- ecg
- ffmpeg
- flask
- html5
- javascript
- logistic-regression
- numpy
- opencv
- physionet
- pillow
- piper-tts
- playwright
- ptb-xl
- pytest
- python
- scikit-learn
- scipy
- signal-processing

Log in or sign up for Devpost to join the conversation.