Visual developments, mashups using sql, cloudent and other databse mngmnt tools, the desire to understand relationships in the data, and giving this information a place, a visual expression.
Website and app: http://appery.io/app/mobile-frame?src=http://appery.io/app/view/a27cc918-5248-498a-a932-f3ebf63c904e&type=mobile https://docs.google.com/presentation/d/18spK3lvvfTdnoveXj1oSWoy_E1n9TJsQ6Qrl-a-XOWA/edit#slide=id.p14
New clinic developments, Liberia, Dept of Defence
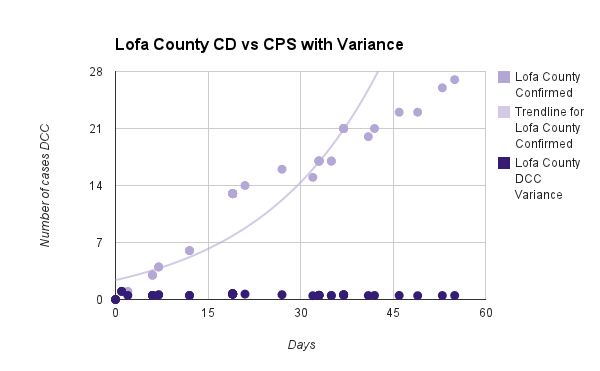
Comparison of the CPS, cases vs CDD in Liberia national data and county areas with greatest casualty rate.
Normalizing data for advanced statistical analysis, in processes
Details of data provided in powerpoint slides, and here: https://docs.google.com/spreadsheets/d/1oYZ7R3Zc9d_YIBjVA76HFYr_Fsl7mGSScdBQBnjGc-I/edit#gid=0


Log in or sign up for Devpost to join the conversation.