Inspiration
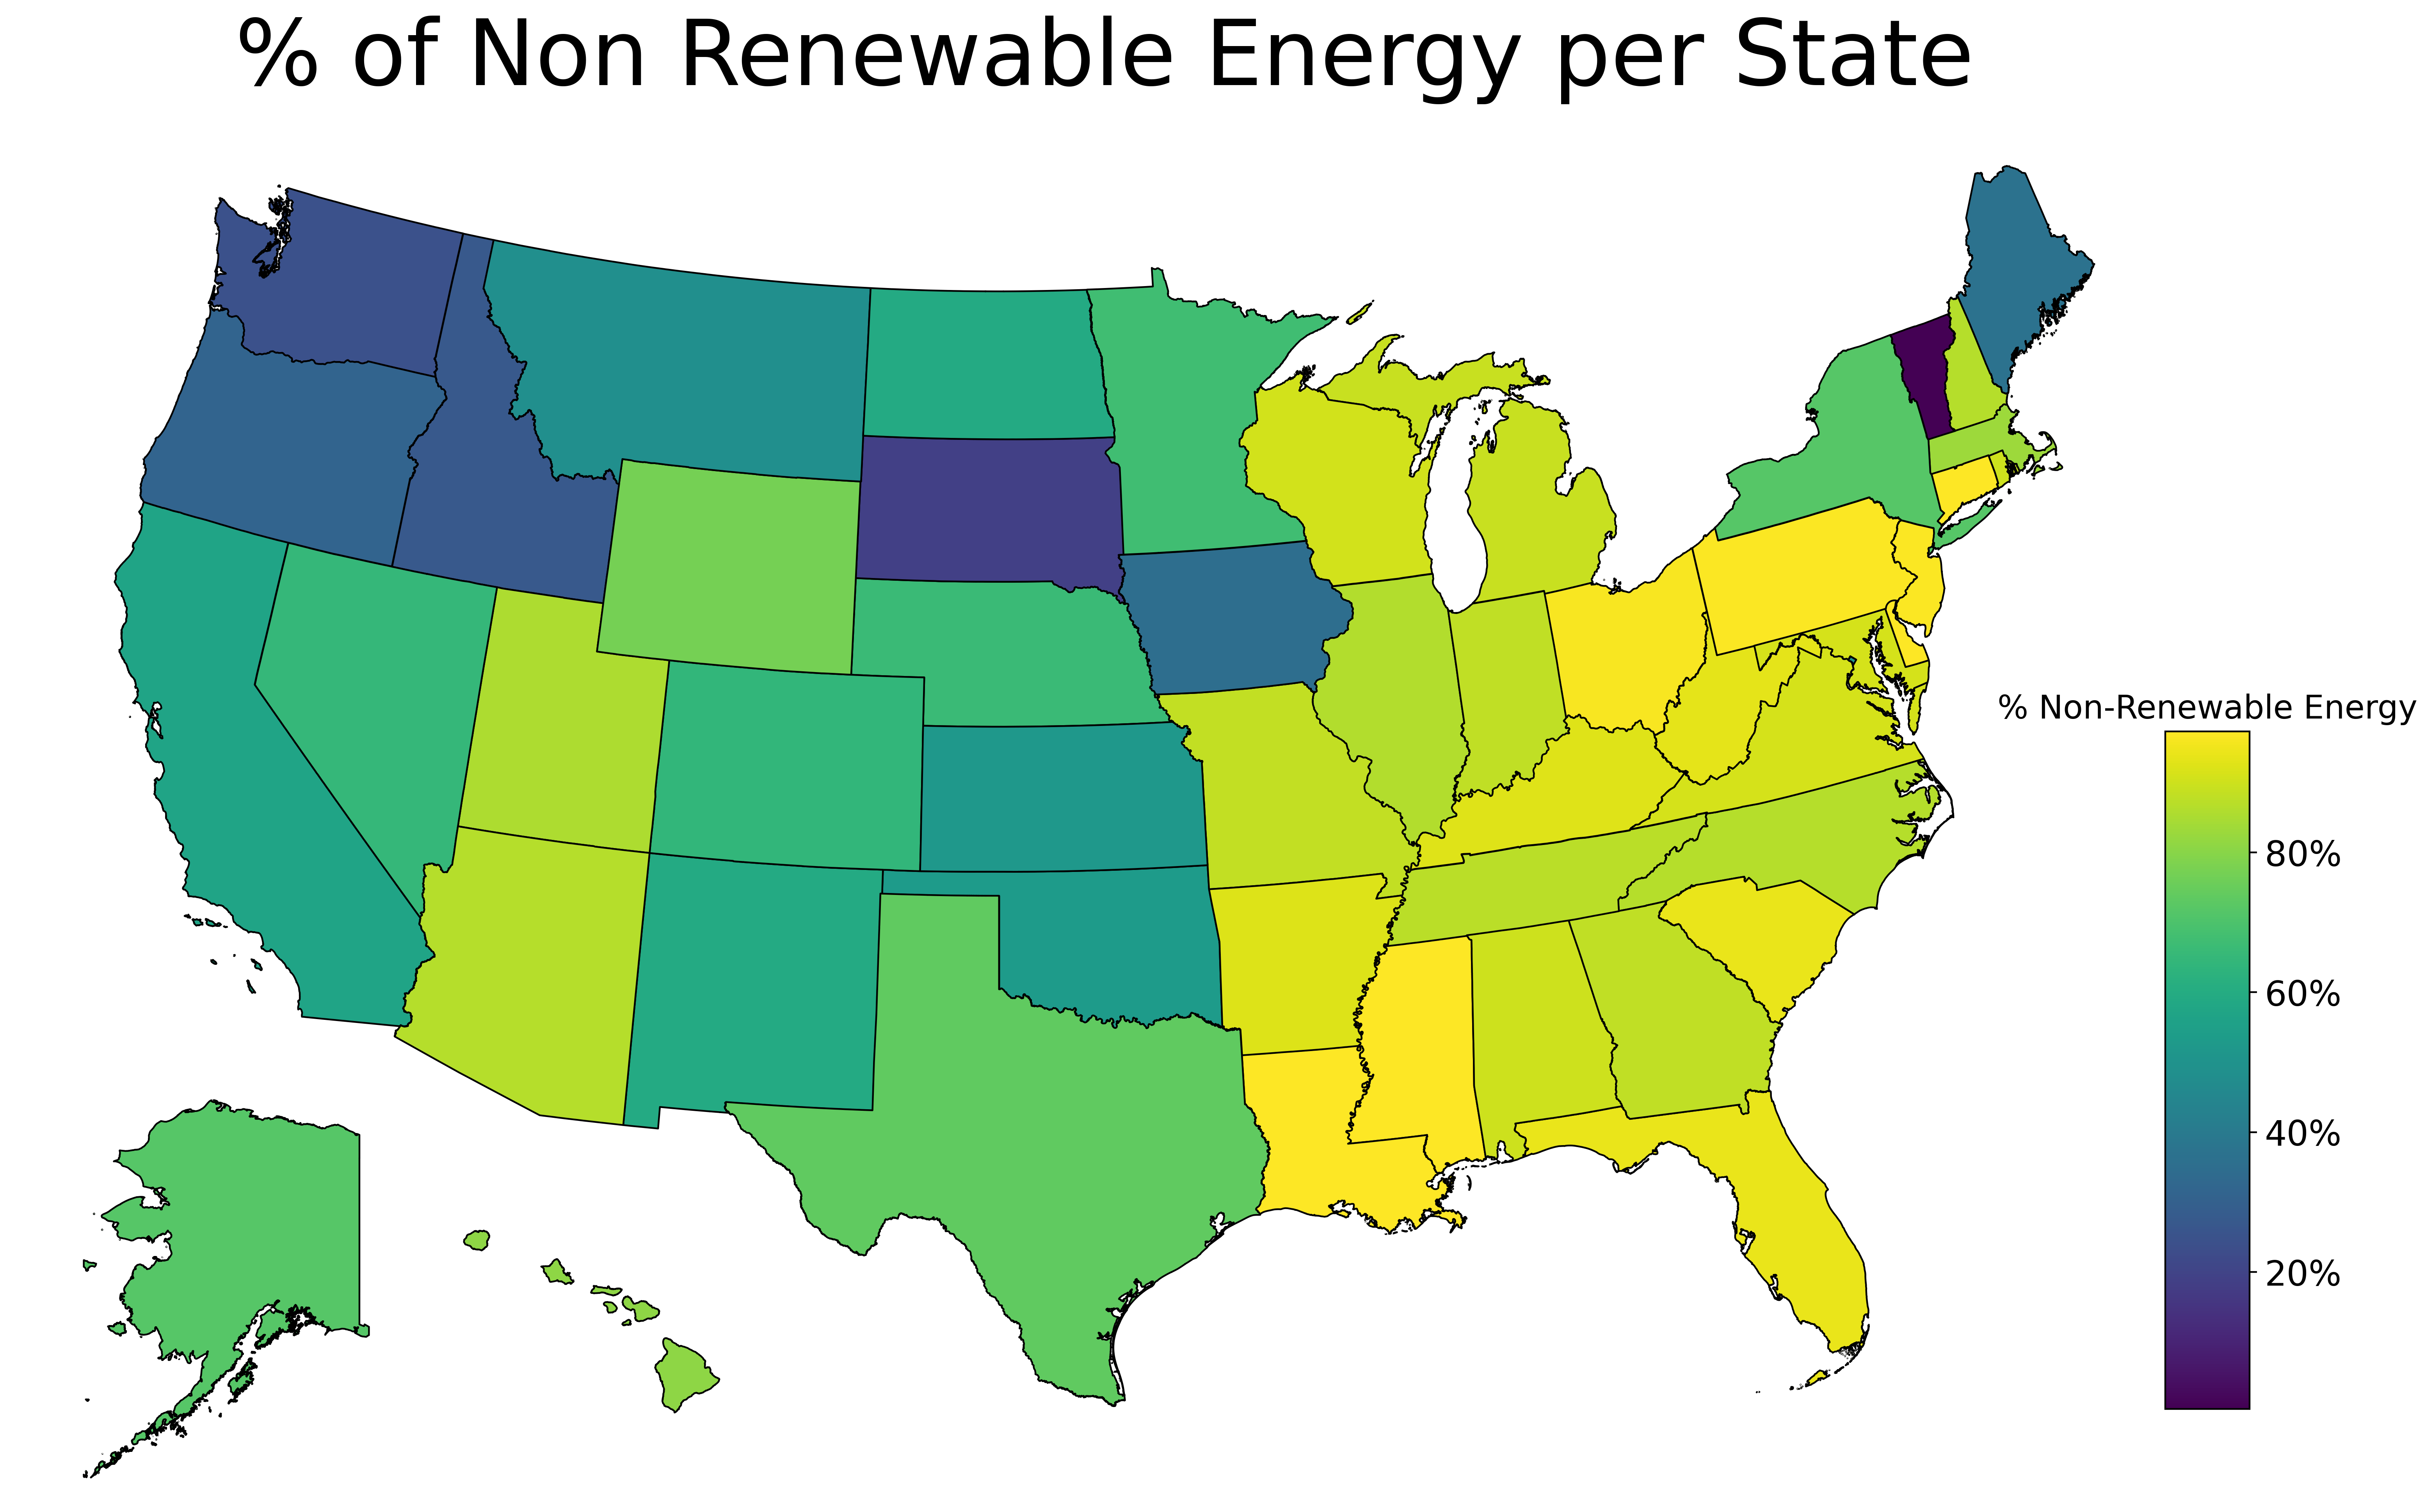
In recent years the popularity of EVs has skyrocketed. A common argument for switching to an electric vehicle is the environmental factor, where the common conception is that EVs are much better for the environment right off of the bat because they do not directly use fossil fuels. However, depending on the state that you are primarily charging your vehicle in, the source of your energy may actually primarily be heavily polluting the environment, whether it's from coal or fossil fuels. This made us wonder if there is actually a benefit to driving an EV, and if so, how many miles do you have to drive to make it less environmentally costly than a fuel efficient gas powered car.
What it does
Our website compares the carbon emissions of buying an average new EV compared to your current car, it will display a graph that gives you the mileage required to put on the new EV in order to break even with the carbon emissions produced by your current vehicle.
How we built it
We utilized 2 datasets, one dataset gives us the percentage of clean energy as well as non renewable energy for each US State, which we used to calculate the emissions required to charge an average EV in each state assuming all charges are done on the power grid. We cleaned this data with pandas and excel to complete our calculations. The front end was created using extensive HTML implemented in Flask. We then combined our front and back end using java script.
Challenges we ran into
We had difficulties finding the correct date and cleaning it, because the datasets that we were using had many parameters and entries (>40000 entries). We also had difficulties integrating our backend with a functional Flask webpage.
Accomplishments that we're proud of
We are proud that we were able to make something that works and functions how we wanted it to in 24 hours. It was all of our first hackathons and we were unsure if we were going to be able to fully create a working product in the allocated time.
What we learned
We learned a lot on how to utilize Flask to create a website that interacts with multiple data sets in HTML. We also learned many principles about cleaning very large data sets to make them usable for our applications.
What's next for Easy EV
We would like to account for different types of EV in our calculations instead of taking the average for all EVs, this way we could see a more direct car to car comparison. We also wanted to make our website more user friendly by building more complex HTML.

Log in or sign up for Devpost to join the conversation.