Easy Analysis
https://easy-analysis.herokuapp.com/
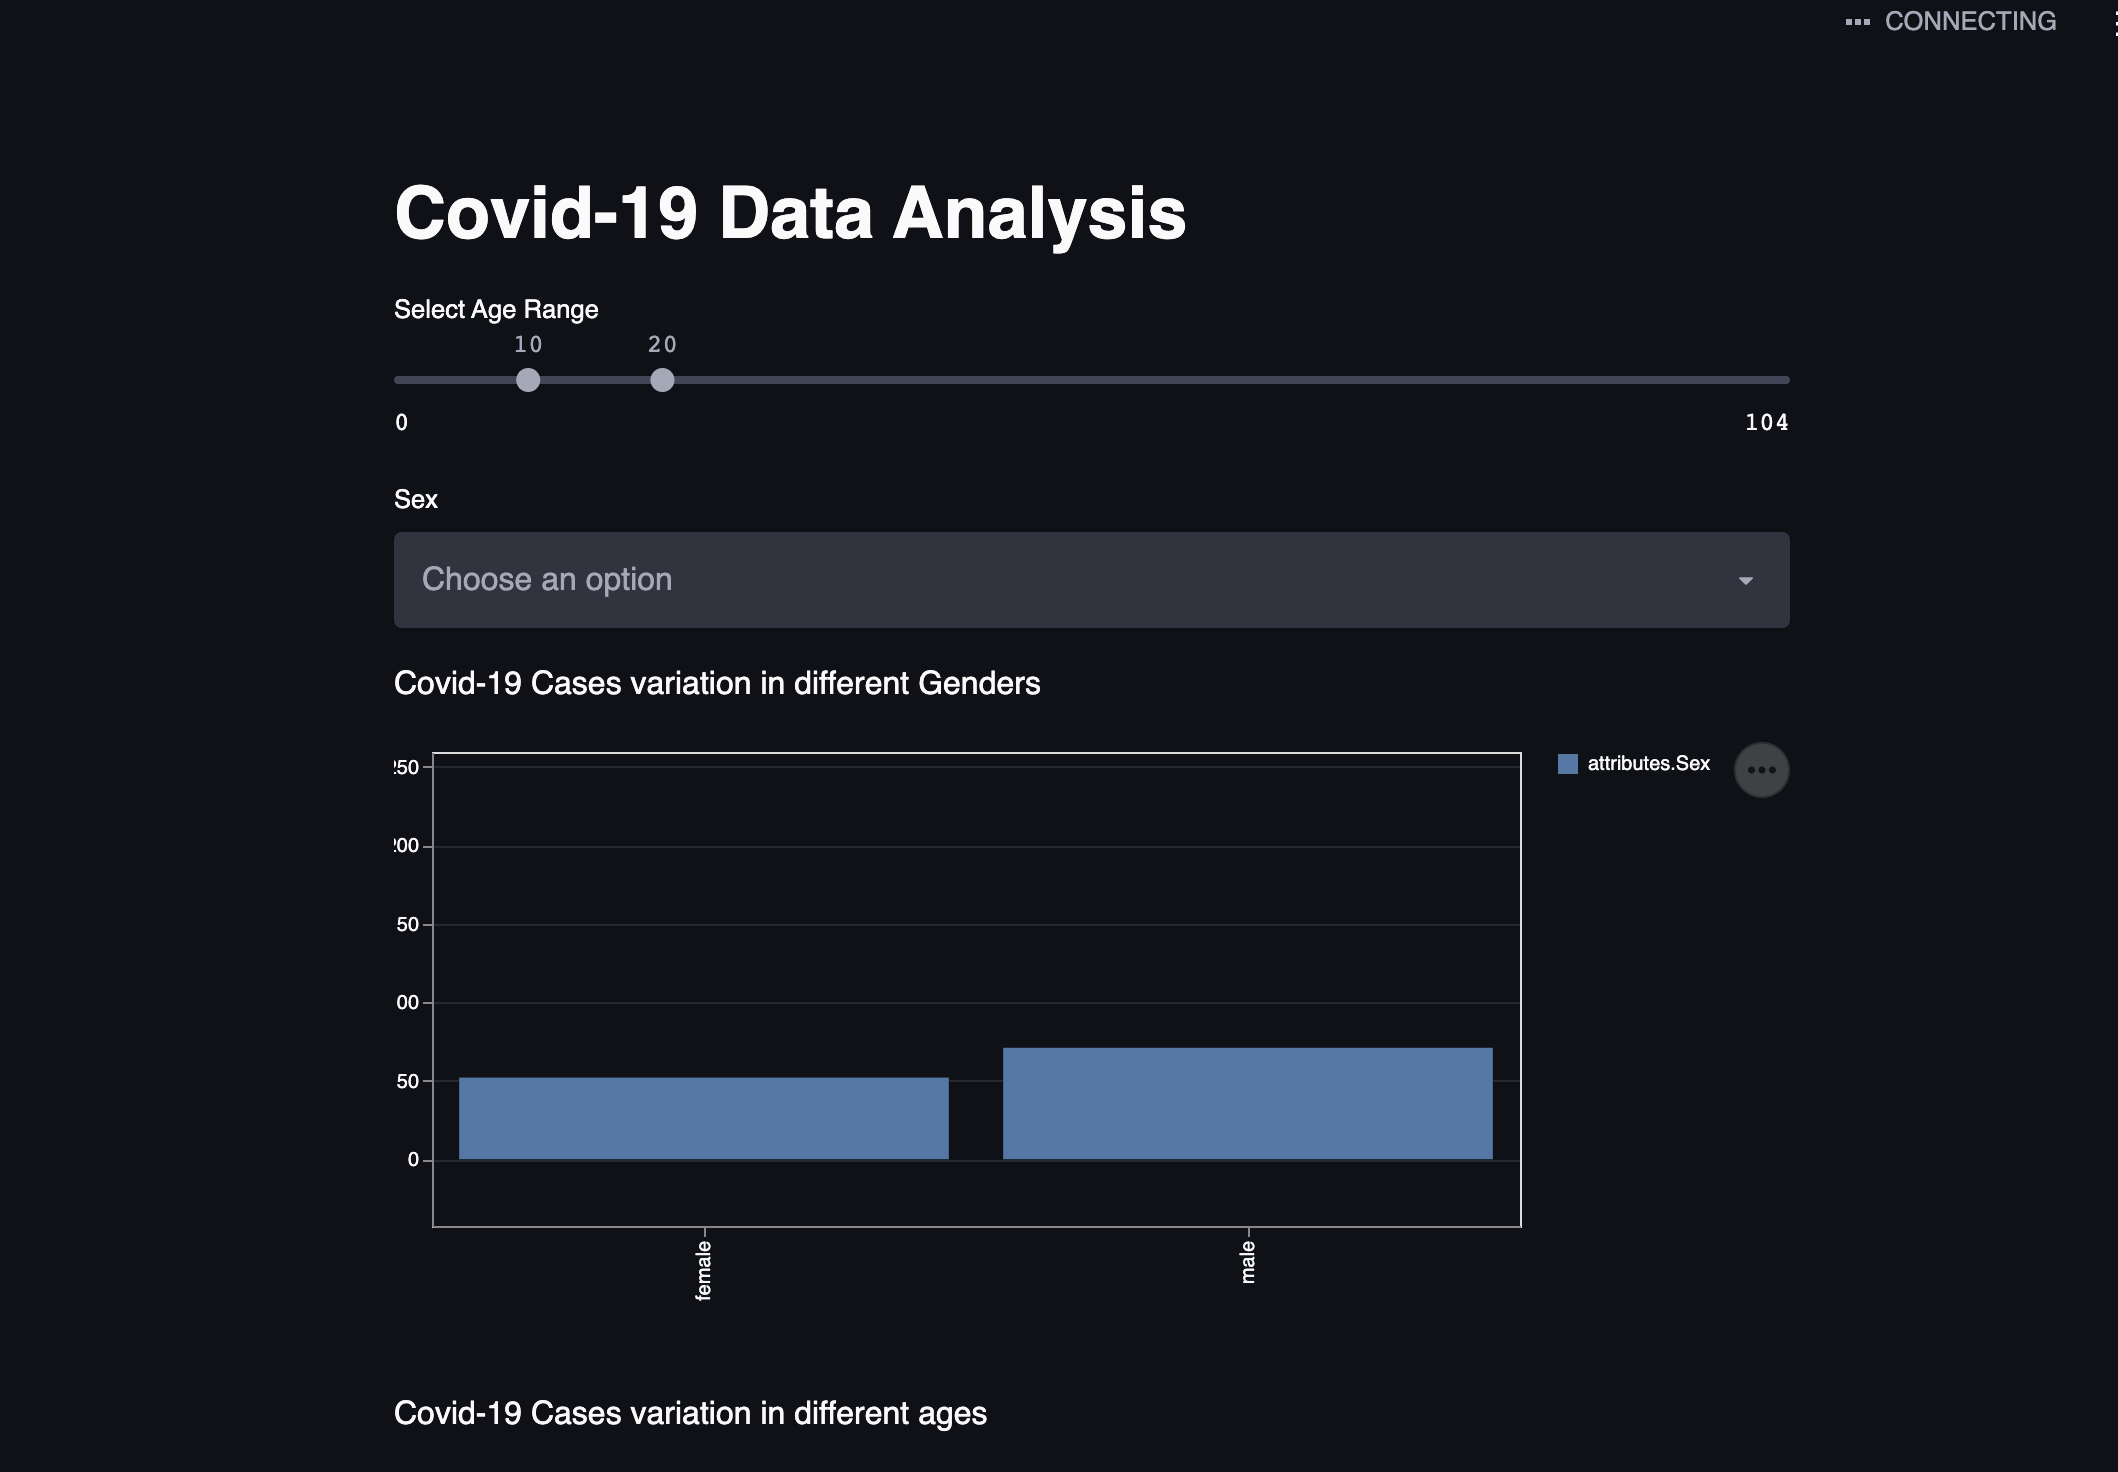
A Streamlit app that uses TigerGraph Cloud,data,queries and other custom data to analyse COVID-19 data and gain insights from the data.
Inspiration
- Most people that need to derive insights and set guidelines for COVID-19 are doctors and medical experts.They can't leverage the strength of Python,TigerGraph Cloud and other resources to make and derive graphs and insights. So our goal was making a User friendly app to help people derive and understand data for COVID-19.
Workflow

How we built it
- We used Streamlit for the UI.
- We are using TigerGraph Cloud to get data.We are using their sample COVID-19 data.
- We are using two GSQL queries,pyTigerGraph library for connecting and getting the data.
- We have used a Query named "ageandgender" which gets covid-19 patient's age and gender,and another query which was prexisting and was provided by TigerGraph called infectionSubgraph.To plot and show how we can track infections and more.
- Along with this we have a feature which helps people drag and drop a csv file and perform data analysis with just a few clicks and easy UI.
Accomplishments we are proud of
- how the final website came about
- how this website has great possibilities to add value for doctors,experts,Govt officials and more, and this concept can be generalized to more field other than COVID related analysis.
Tech Stack

What's next
- In future providing users the features to directly upload data to TGCloud and leveraging the power of TGCloud.
- Adding more immersive polts,graphs and insightful tools.
Created by
Built With
- streamlit
- tigergraph


Log in or sign up for Devpost to join the conversation.