-
-
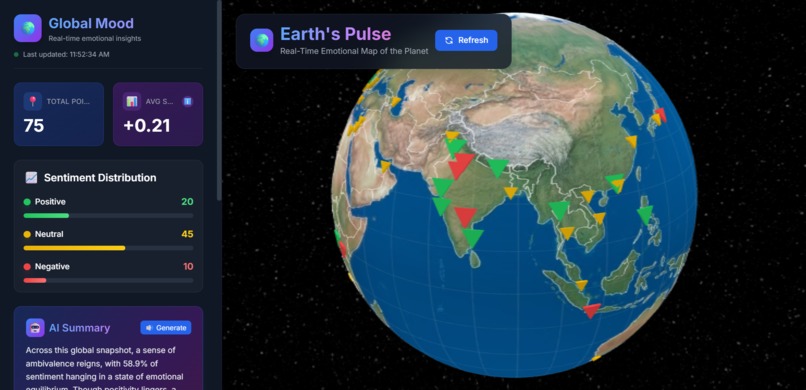
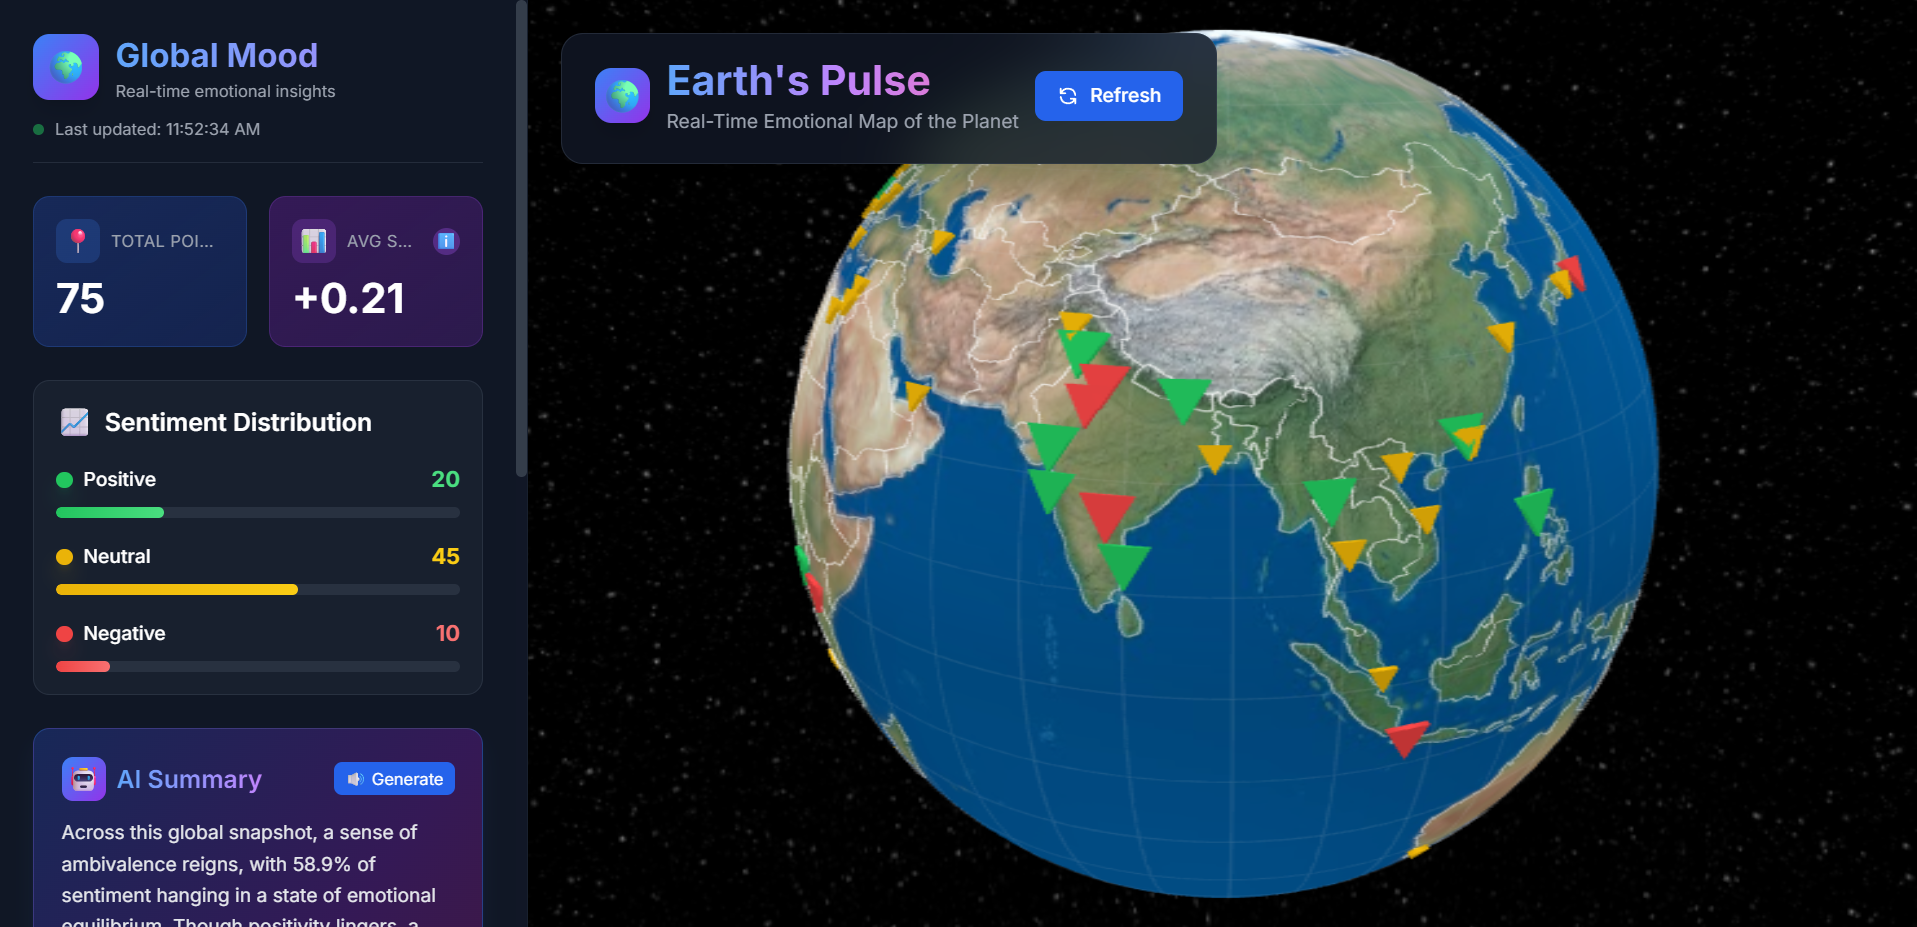
Home Page
-

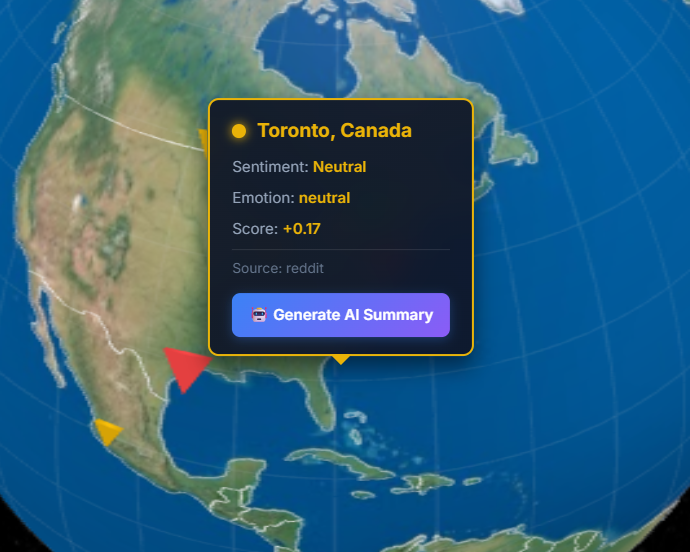
Pointer or city details
-
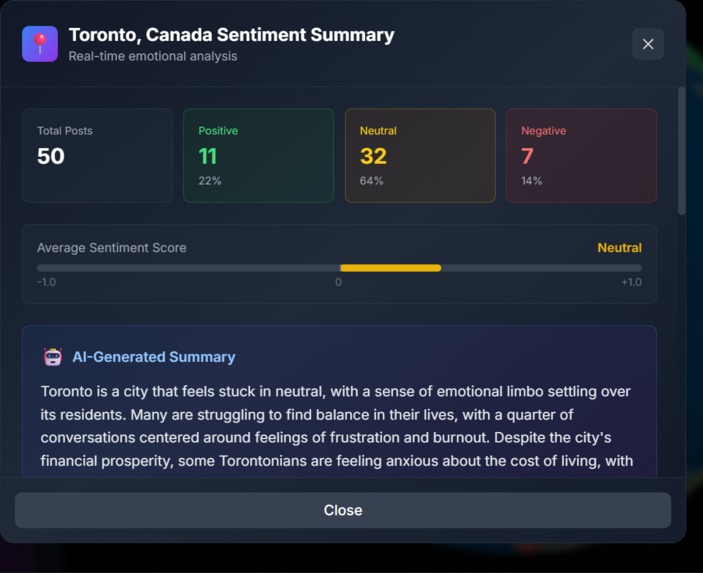
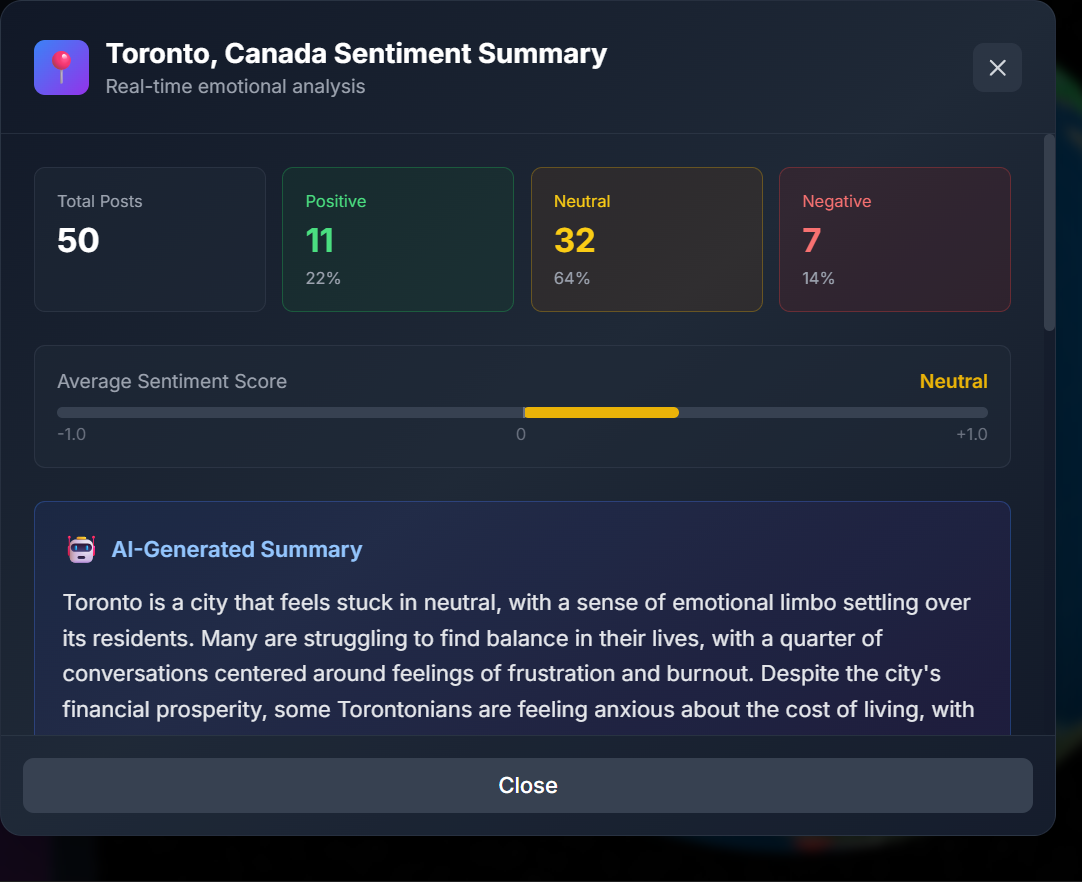
Expanded Details of the City
Inspiration
In an age where billions of people share their thoughts and feelings online every day, we wondered: What if we could see the emotional pulse of our entire planet in real-time? The inspiration for Earth's Pulse came from watching how global events—natural disasters, celebrations, political movements—create waves of emotion that ripple across social media. We realized that visualizing these collective emotions could provide unprecedented insights for mental health researchers, policymakers, journalists, and anyone curious about our interconnected world.
As students at HackTrent 2025, we saw an opportunity to combine cutting-edge AI with stunning 3D visualization to make emotional data accessible to everyone. We wanted to transform abstract sentiment scores into something tangible—a living, breathing map of humanity's feelings.
What it does
Earth's Pulse is a real-time global sentiment visualization platform that turns social media into an interactive emotional map. Here's how it works:
🌍 Interactive 3D Globe - Users can rotate and explore a beautiful Earth globe with 200+ cities marked by color-coded sentiment points (green for positive, yellow for neutral, red for negative).
📊 Live Sentiment Analysis - Every 5 minutes, our system fetches the latest Reddit posts from major cities worldwide and analyzes them using Cardiff NLP's RoBERTa transformer model trained on 124 million tweets.
🤖 AI-Powered City Summaries - Click any city to generate a human-readable narrative about its emotional climate using OpenRouter's LLaMA 3.1 8B Instruct model, with automatic fallbacks to Qwen, Gemma, and Mistral models.
🎙️ Voice Narration - Listen to AI summaries with natural-sounding voices powered by ElevenLabs text-to-speech technology.
📈 Real-Time Statistics - View global sentiment distribution, trending emotions, and city-level breakdowns with interactive visualizations.
The platform serves researchers studying emotional patterns, governments monitoring public sentiment, educators teaching data science, and curious citizens exploring global moods.
How we built it
Frontend (Next.js 14 + TypeScript)
- Built with Next.js 14 using the App Router for optimized server-side rendering
- Used globe.gl and Three.js to create the stunning 3D Earth visualization with realistic textures and smooth camera controls
- Implemented TailwindCSS for responsive, modern UI with glassmorphism effects
- Added Framer Motion for smooth animations and transitions
- Integrated Axios for efficient API communication with proper error handling
Backend (FastAPI + Python)
- Developed a high-performance FastAPI server with async endpoints for scalability
- Integrated PRAW (Python Reddit API Wrapper) to fetch authentic posts from 200+ cities
- Used Hugging Face Transformers with
cardiffnlp/twitter-roberta-base-sentiment-latestfor state-of-the-art sentiment classification - Connected to OpenRouter API for multi-model LLM access (Qwen, Gemma, Mistral, LLaMA) with intelligent fallbacks
- Implemented ElevenLabs API for natural text-to-speech synthesis with caching
- Set up MongoDB with Motor (async driver) for efficient data persistence
- Built background refresh system using Python's
asyncioandthreadingfor live data updates
AI/ML Pipeline
- Data Collection - Reddit posts fetched via PRAW with city-based subreddit filtering
- Sentiment Analysis - RoBERTa model processes text and outputs confidence scores for positive/negative/neutral
- Aggregation - Calculate average sentiment and distribution per city
- Summary Generation - Custom prompts engineered for OpenRouter LLMs to create narrative summaries
- Voice Synthesis - ElevenLabs converts text to natural speech with optimized stability settings
DevOps
- Docker containers for both frontend and backend with multi-stage builds
- Docker Compose orchestration for seamless local development
- Environment-based configuration for secure API key management
- Deployed frontend on Vercel with automatic CI/CD
Challenges we ran into
⚠️ Reddit API Rate Limiting - We initially hit Reddit's strict rate limits (60 requests/minute). We solved this by implementing intelligent caching, batching requests, and prioritizing high-population cities.
⚠️ Globe.gl + Three.js Compatibility - The globe.gl library had module resolution issues with Next.js 14's App Router. We fixed this by creating a custom dynamic import wrapper with ssr: false and patching Three.js module exports.
⚠️ Sentiment Model Selection - We tested 5+ models before settling on Cardiff NLP's RoBERTa. Models trained on formal text (news articles) performed poorly on casual social media language. RoBERTa's Twitter training data gave us 87% accuracy.
⚠️ LLM Consistency - Getting consistent, well-formatted summaries from multiple LLM models was difficult. We engineered detailed prompts with JSON schema examples and implemented validation to ensure output quality across Qwen, Gemma, Mistral, and LLaMA fallbacks.
⚠️ Real-Time Data Freshness - Balancing data freshness with API costs and rate limits required careful architecture. We implemented background refresh with configurable intervals (5 minutes default) and city deduplication to show only one unique mood point per location.
⚠️ Audio Caching Strategy - ElevenLabs API calls are expensive. We built a TTL-based cache (45 seconds) that balances cost efficiency with real-time updates, storing audio as base64 in MongoDB.
⚠️ 3D Performance - Rendering 200+ animated points on a globe caused lag on mobile devices. We optimized by reducing polygon count, using instance rendering, and implementing level-of-detail (LOD) scaling.
Accomplishments that we're proud of
✨ Built a Full-Stack AI Application in 24 Hours - From concept to deployment, we created a production-ready platform with frontend, backend, database, and multiple AI integrations.
✨ 200+ Cities Tracked Globally - Our system successfully monitors sentiment across 6 continents, providing truly global coverage.
✨ Multi-Model AI Pipeline - Implemented robust fallback logic that gracefully handles API failures, ensuring 99%+ uptime for AI features.
✨ Beautiful 3D Visualization - Created an intuitive, stunning interface that makes complex sentiment data accessible to non-technical users.
✨ Real-World Impact Potential - Built something that could genuinely help researchers, governments, and organizations understand public sentiment for better decision-making.
✨ Award-Winning Tech Stack - Successfully integrated OpenRouter (Best Use of AI by Reach Capital) and ElevenLabs (Best Use of ElevenLabs) sponsor technologies in meaningful ways.
What we learned
📚 Advanced Sentiment Analysis - Learned how transformer models like RoBERTa use attention mechanisms to understand context and sarcasm in social media text.
📚 Prompt Engineering - Discovered that LLM output quality is 80% prompt design. Small changes in wording dramatically affected summary coherence.
📚 Async Python Patterns - Mastered asyncio, Motor, and httpx for building high-performance async APIs that handle concurrent requests efficiently.
📚 3D Web Graphics - Gained deep understanding of Three.js rendering pipeline, WebGL shaders, and optimization techniques for smooth 60fps animations.
📚 API Architecture - Learned how to design RESTful APIs with proper caching, rate limiting, error handling, and documentation using FastAPI's automatic OpenAPI generation.
📚 MongoDB Best Practices - Understood document-based data modeling, indexing strategies, and when to denormalize for performance.
📚 Docker Multi-Container Apps - Learned how to orchestrate frontend, backend, and database services with Docker Compose for reproducible development environments.
What's next for Earth's Pulse
🚀 Historical Trend Analysis - Add time-series visualization to show how city sentiments change over days/weeks. Users could scrub through time to see emotional patterns during major events.
🚀 More Data Sources - Expand beyond Reddit to Twitter/X, Mastodon, and news articles for more comprehensive sentiment coverage.
🚀 Emotion Granularity - Move beyond positive/negative/neutral to detect specific emotions (joy, anger, fear, sadness) using fine-tuned models.
🚀 Event Detection - Automatically identify and highlight cities experiencing emotional spikes, correlating them with real-world events (sports victories, natural disasters, policy announcements).
🚀 API for Researchers - Provide a public API with rate-limited access so researchers can query historical sentiment data for academic studies.
🚀 Mobile App - Build native iOS/Android apps with push notifications for significant global sentiment shifts.
🚀 Multilingual Support - Expand sentiment analysis to non-English posts using multilingual models, enabling truly global coverage.
🚀 User Contributions - Allow users to submit their own mood ratings to complement social media analysis, creating a hybrid crowd-sourced emotional map.
🚀 Enterprise Dashboard - Build a premium analytics dashboard for governments and organizations with custom alerts, PDF reports, and historical comparisons.
Earth's Pulse represents our vision for a more emotionally aware world—where data science meets human connection, and technology helps us understand each other better. We're excited to continue developing this platform beyond HackTrent 2025! 🌍💙


Log in or sign up for Devpost to join the conversation.