-
-

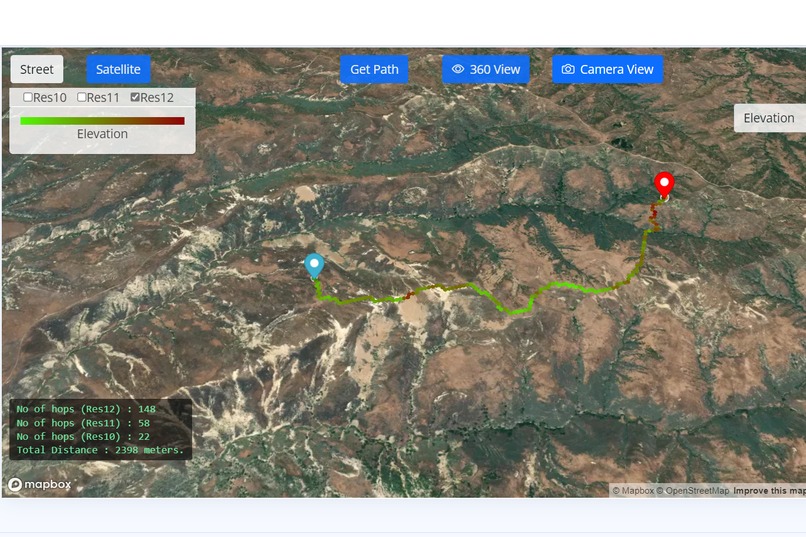
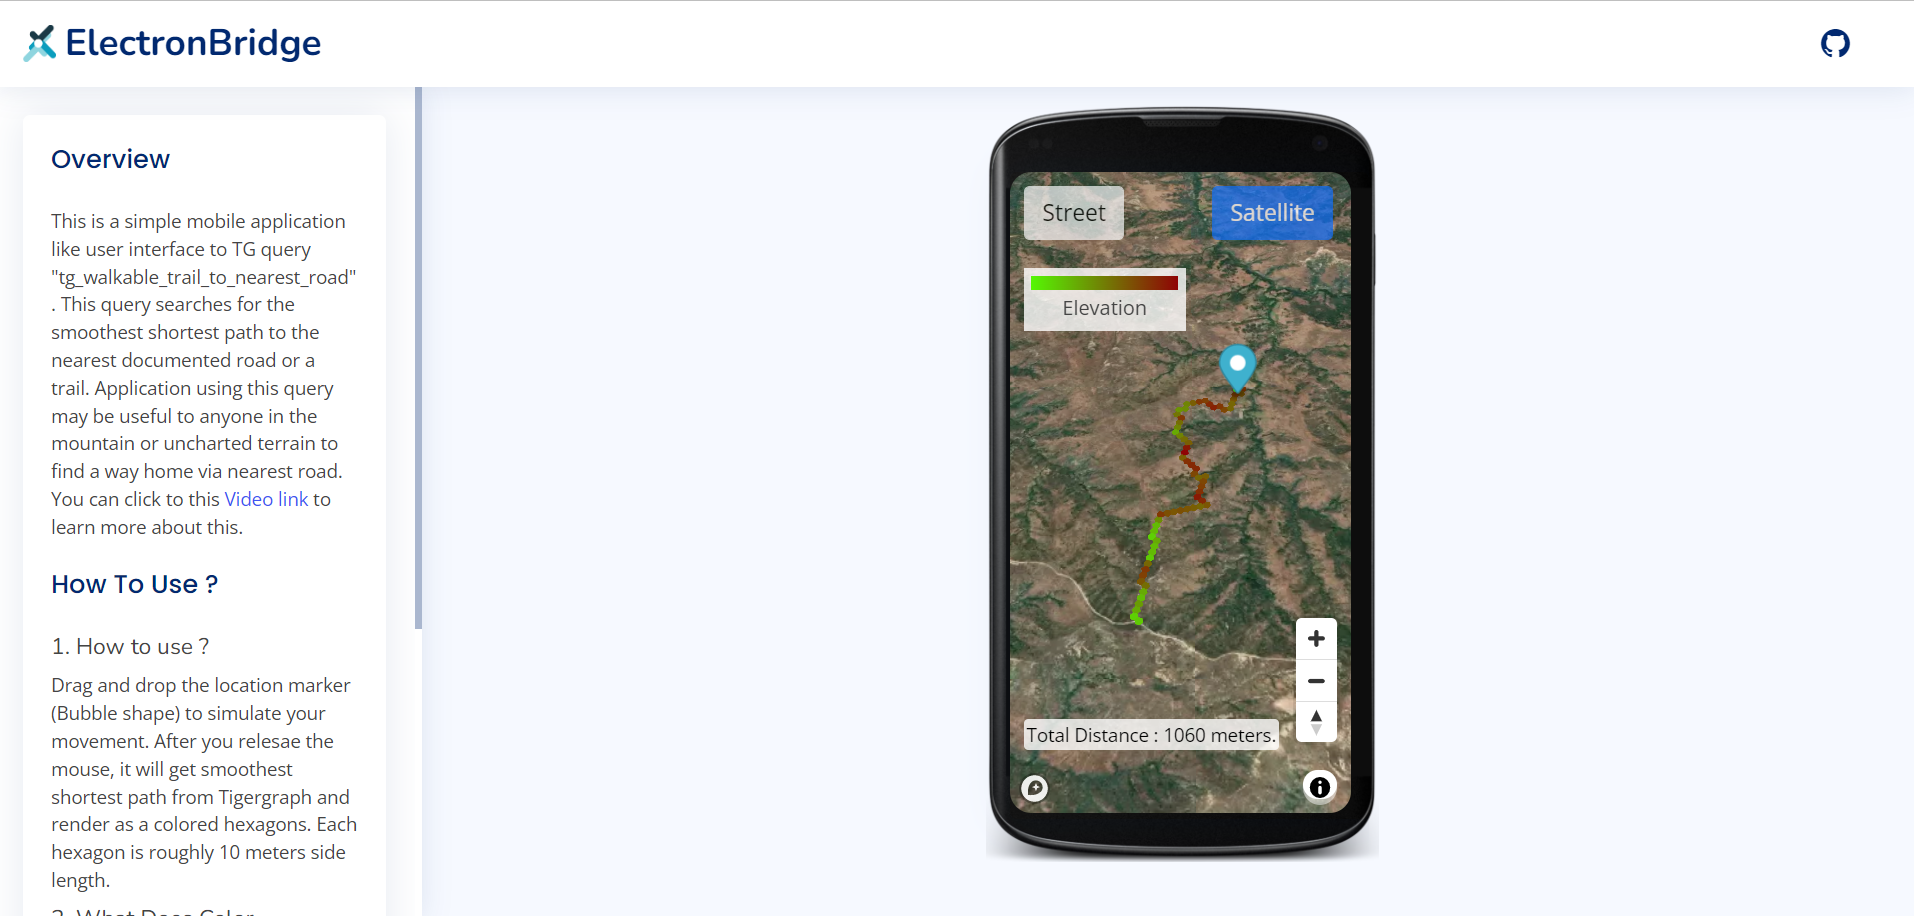
Find nearest walkable Road
-

Visualize 360 view
-
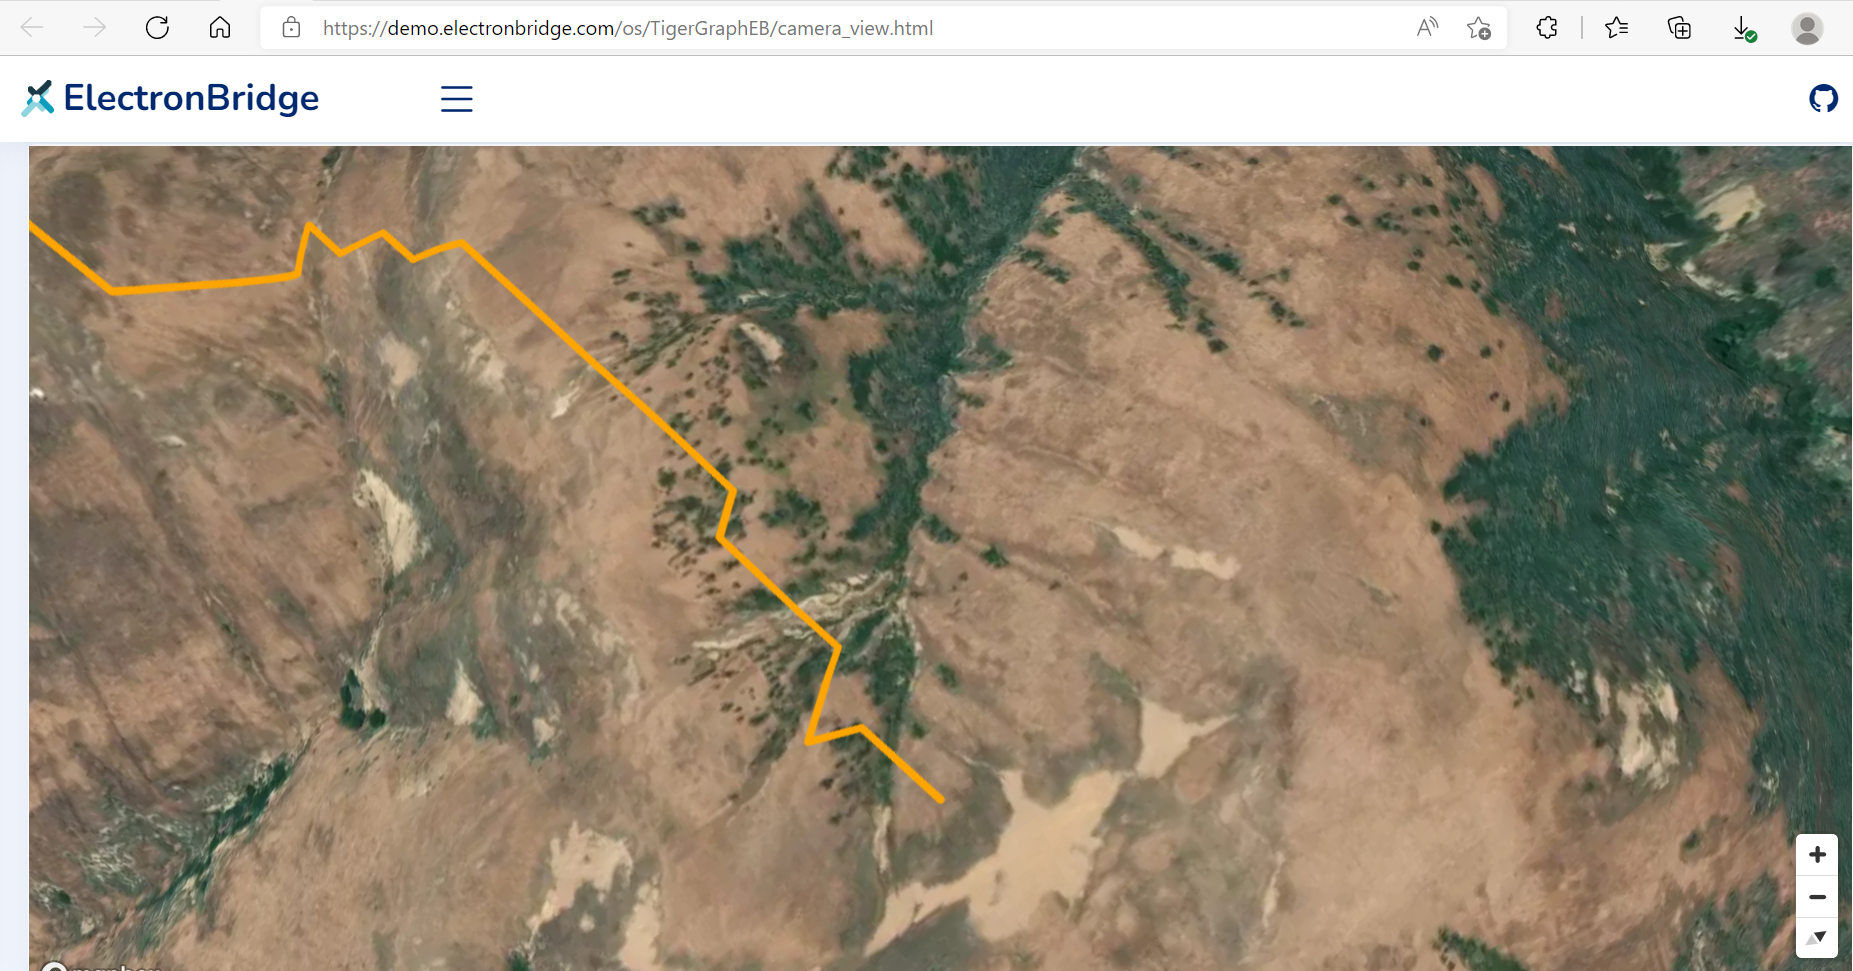
Find path between two points
-

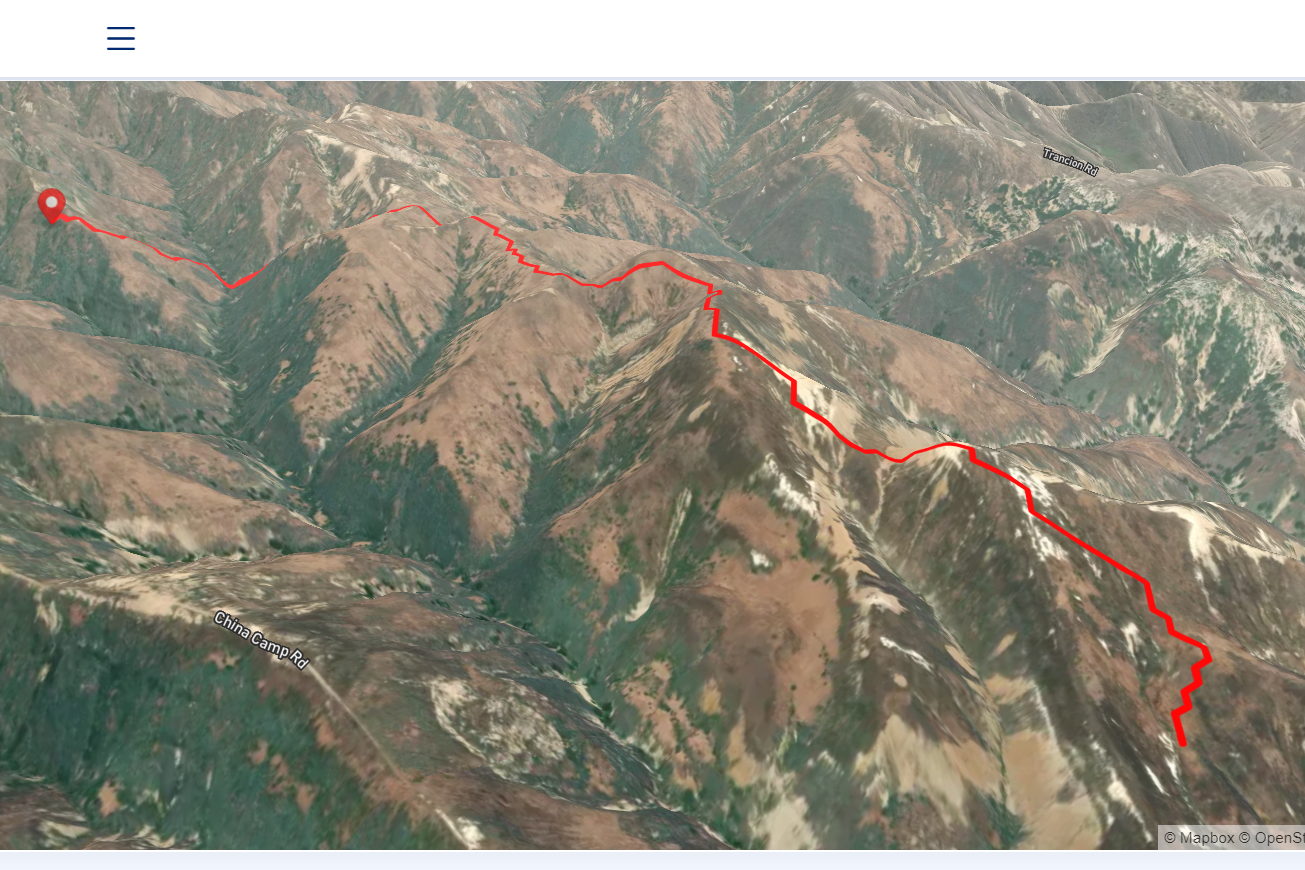
Visualize helicopter view

Inspiration
Natural disasters are sad but an unavoidable part of our lives. Natural disasters all around the world in the year 2008 to 2020 caused around 10 Millions injured and around 40 Millions displaced. For details click here Global and local search and rescue missions are launched every year around the world for stranded people as a result of natural disasters or otherwise. In the USA alone between 1992 and 2007 a total of 65,439 "Search and Rescue" (SAR) missions were conducted in National Parks. For reference click here.
During the search and rescue specially in difficult terrain, Insights about terrain traversal on the basis of latest data available from satellites/surveying drones make a difference.
Earth observation data as GIS is already being used by Search and Rescue teams. For reference visit these links
- Disaster Charter
- "GIS based method to find the spots for helicopters landing sites which are most accessible by surrounding area"
These systems are operated by analysts and final info graphs are prepared which are meant to be referred by Rescue workers and volunteers. These maps can be quite informative but they provide aggregated information about a region and on demand insights is hard to extract out of them.
We think if graph is used to store this data, information can be queried faster and in real time. Tigergraph REST interfaces can be connected with end users applications (web and mobile) and the entire Rescue team and Volunteers can be empowered with latest satellite information.
What it does
Our solution helps traverse through a difficult, unknown or changed (because of natural disaster) terrain. Just like a urban routing engines (e.g. google maps application) our graph will be able to find best walkable path using latest terrain information available from satellites.
How we built it
- We created UDF functions with the help of C bindings of Uber H3. This allow us to call geo-spatial functions while traversing TigerGraph.
- We pre-processed a sample (Santa Rosa Island, USA) of satellite data (Data sources https://www.usgs.gov/ and https://scihub.copernicus.eu/dhus/#/home. In this pre-processing we aggregated Earth observation attributes (Elevation and vegetation) at H3 resolution 10,11 and 12 (ref) respectively and populated graph with it.
- We then created and optimized our queries related to traversal based on surface elevation, smoothness and distance. We kept vegetation as an extra attribute.
- Finally we created front end graphical interfaces to demonstrate usage of these queries.
Challenges we ran into
Our dataset has 607,624 vertices and 3,624,018 edges for smallest Resolution 12. Running traditional search algorithms were very slow. We also had to keep track of Maximum smoothness, Minimum Distance and Minimum elevation. We solved these challenges by using a variation of A-Start algorithm along with some control functions to control directions of search.
Accomplishments that we're proud of
- We integrated H3 library with TigerGraph which will be useful not only in our solution but developers from TigerGraph community.
- We succeeded in creating an end user application which can give on demand traversal results. This will empower Rescue workers and Volunteers who are already doing noble work.
What we learned
During the course of solution building we learned about TigerGraph concepts and how powerful it can be.
What's next for Earth Terrain Data Graph
- Since our objective is to empower volunteers at the time of crisis, we want to understand challenges from the people working in rescue on the ground and add more value in this solution on the basis of their feedback.
- We want to improve the data pipeline to connect directly with publicly available data hubs so that our solution can ingest data as and when received.
- We want to collaborate with organizations like disasterscharter .
Built With
- c
- geospatial
- gsql
- javascript
- node.js
- python
- tigergraph


Log in or sign up for Devpost to join the conversation.