-
-
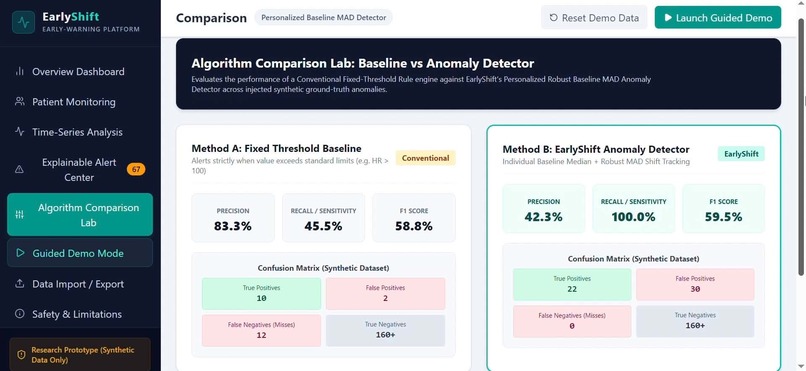
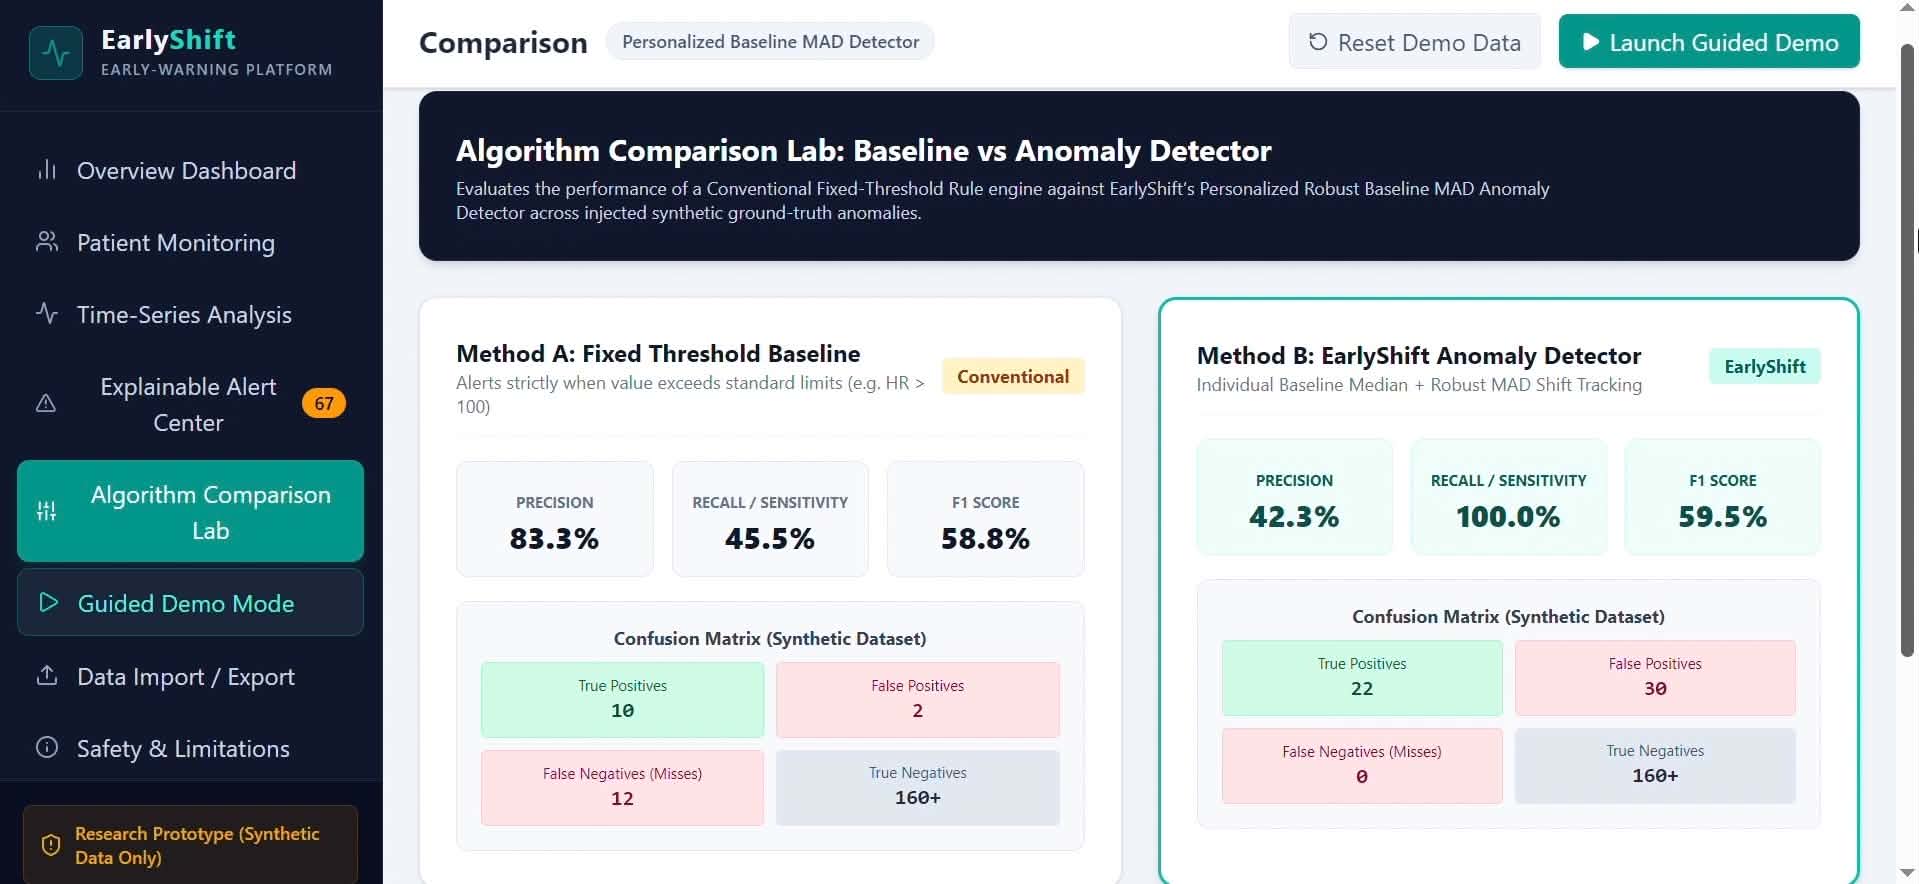
Tab: Algorithm Comparison Lab
-
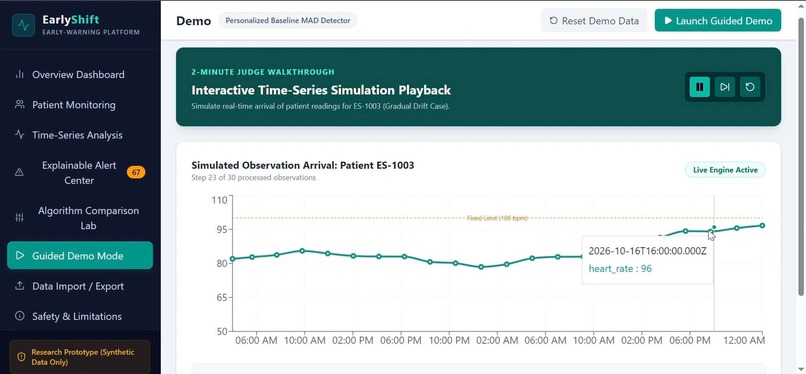
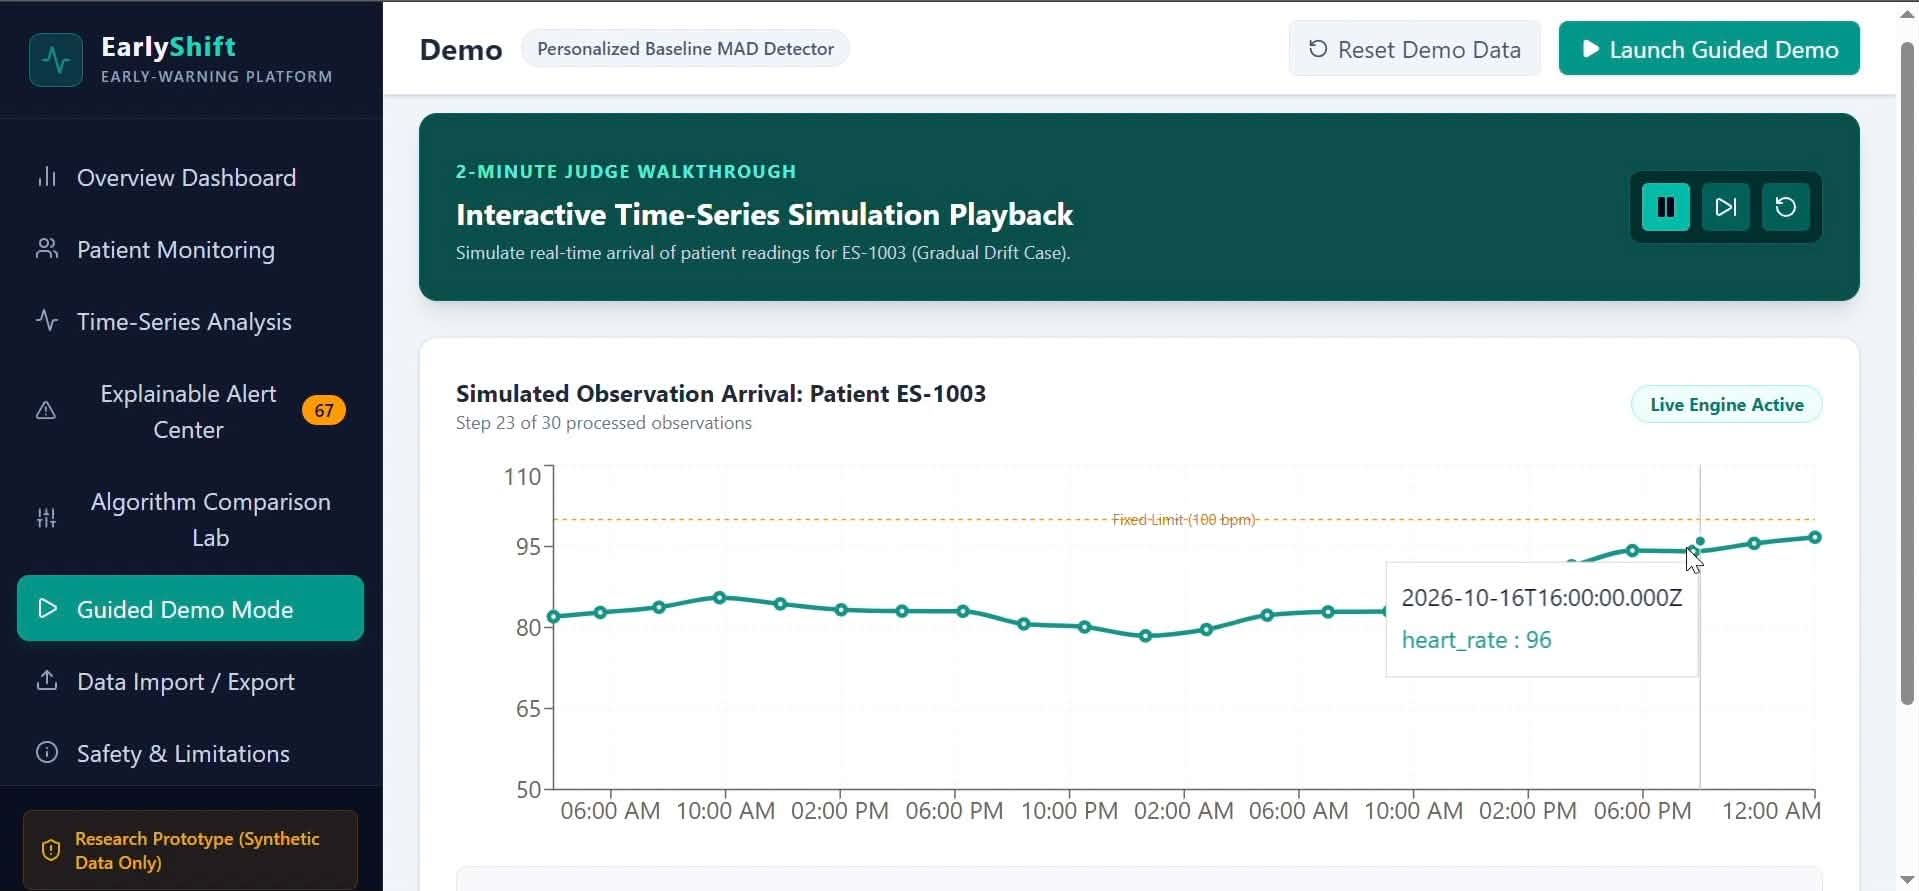
Tab: Guided Demo Mode
-
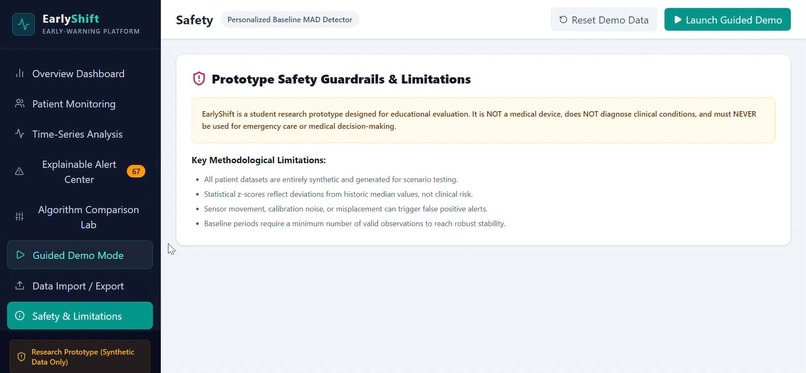
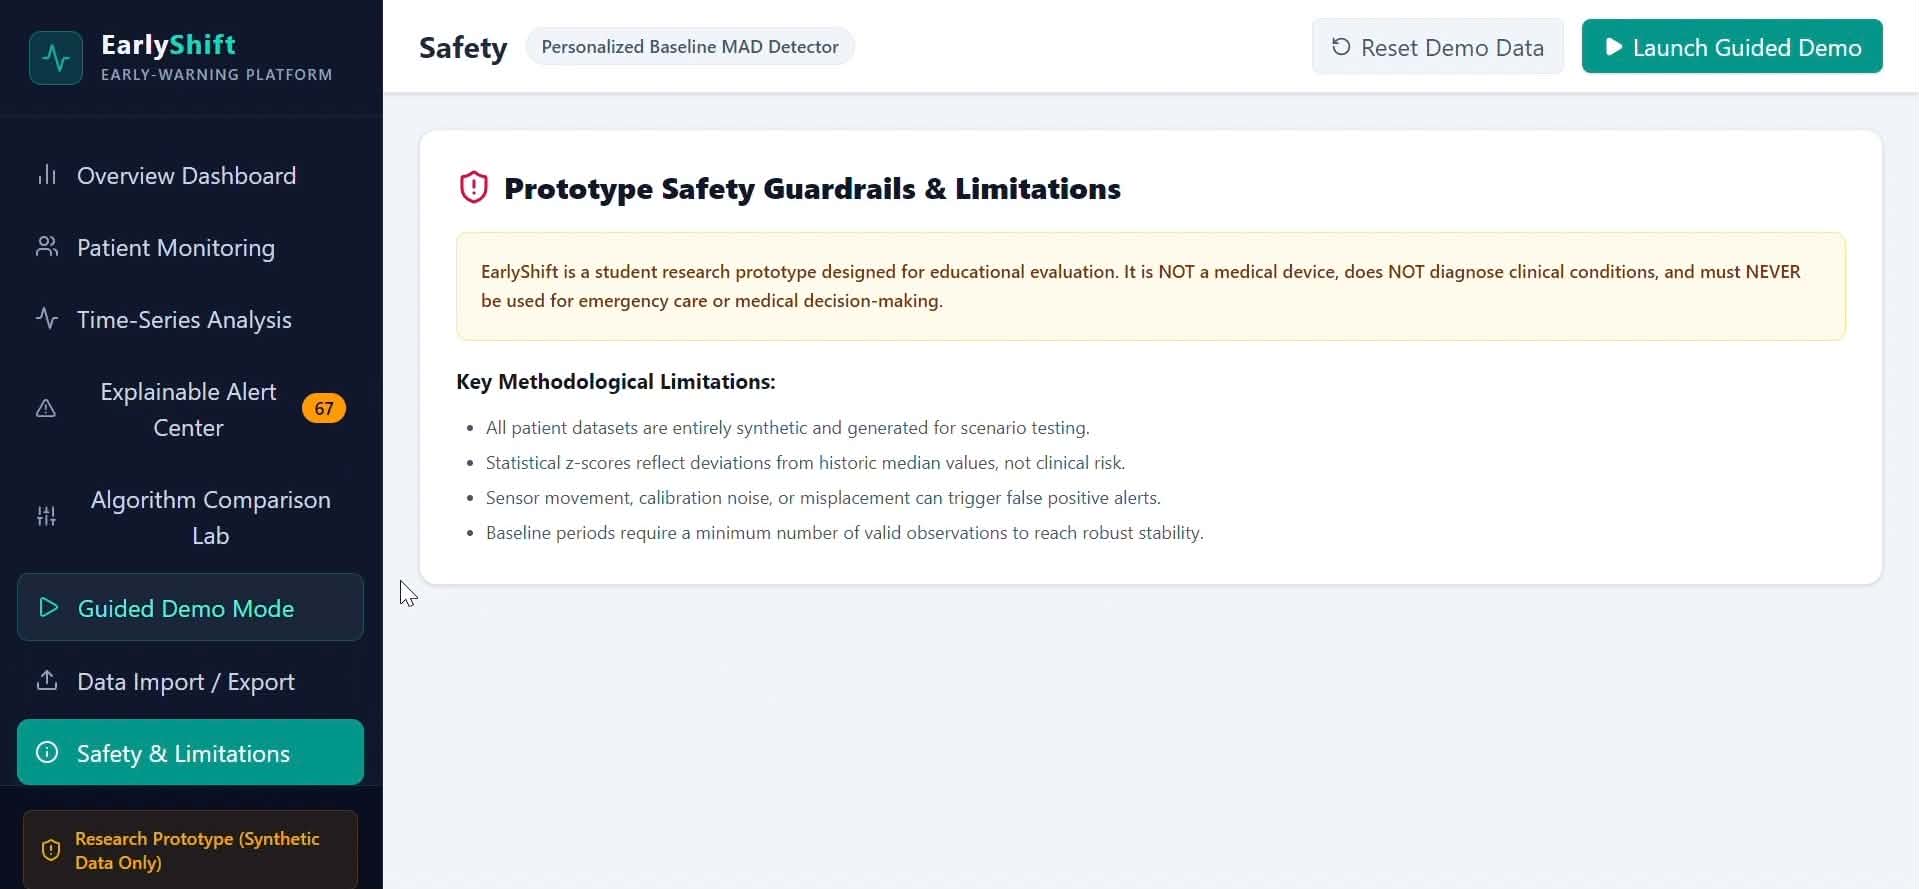
Tab:Safety &Limitations
-
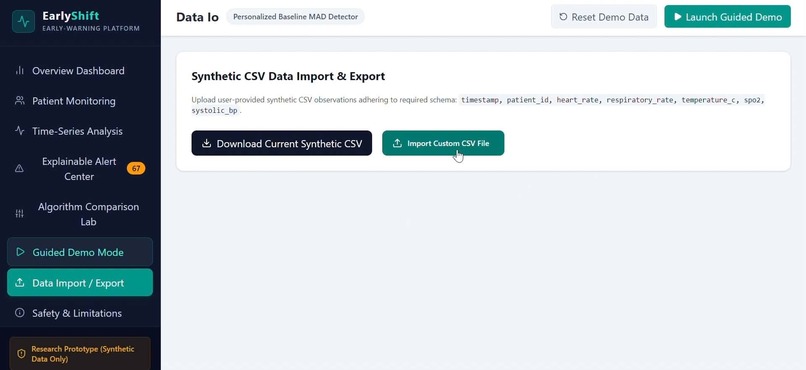
Tab:Data Imprort/Export
-
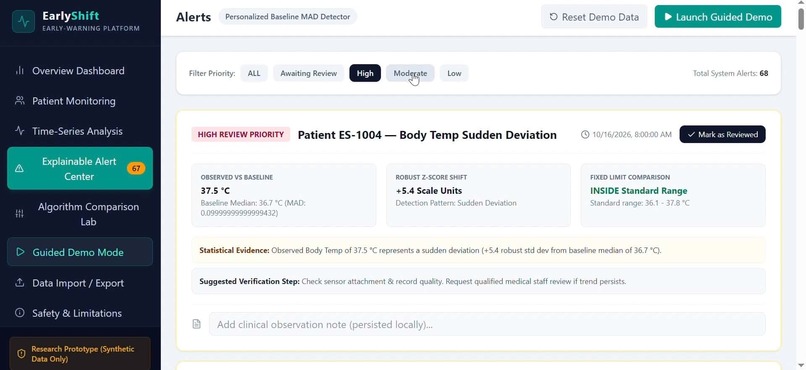
Tab:Explainable Alert Center
-
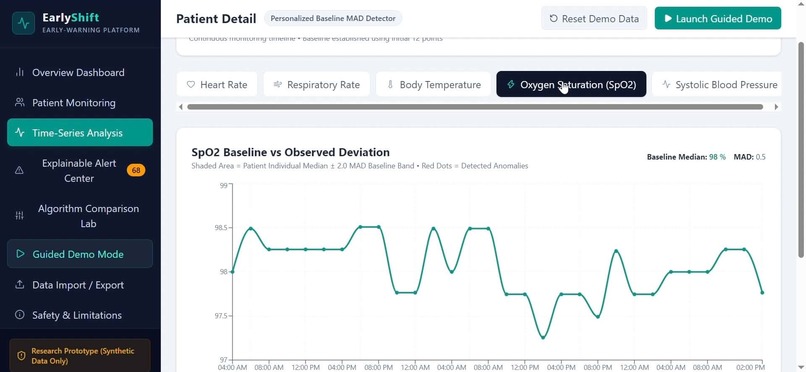
Tab:Time-Seres Analysis
-
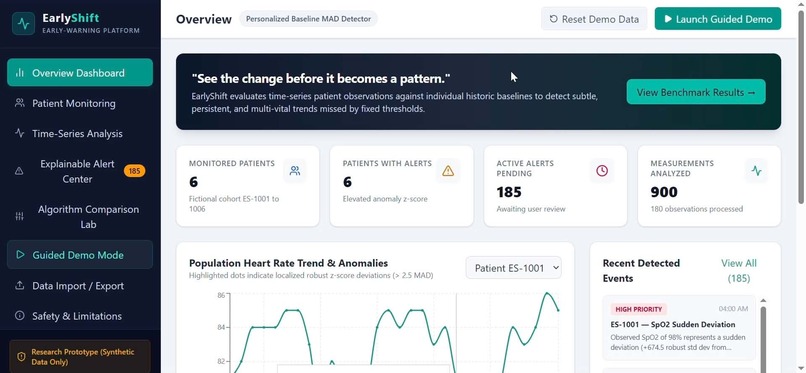
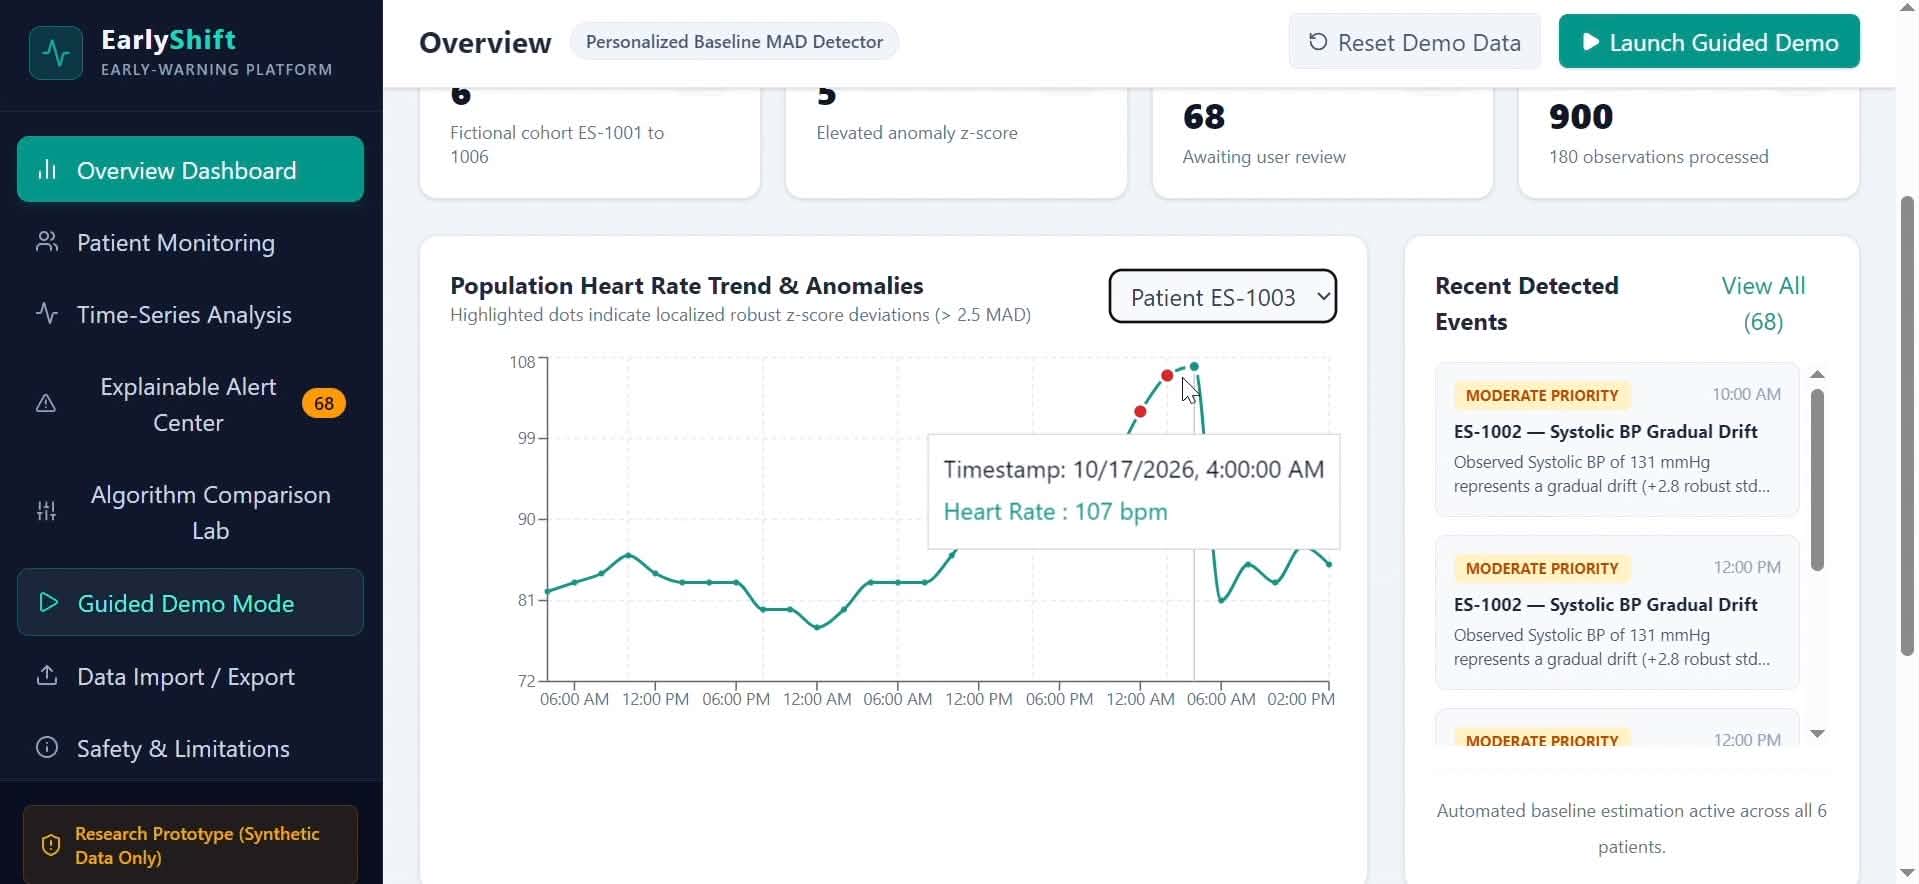
Tab: Overview Dashboard
-
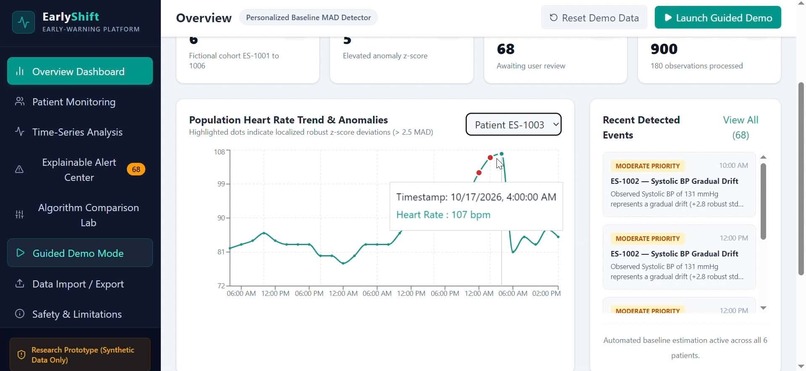
Tab: Overview Dashboard
-
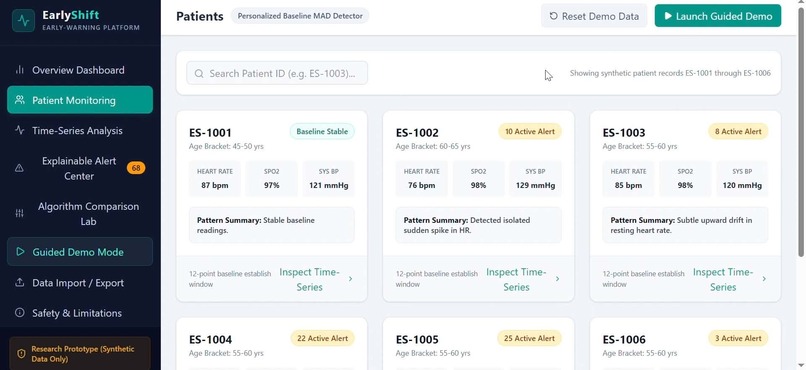
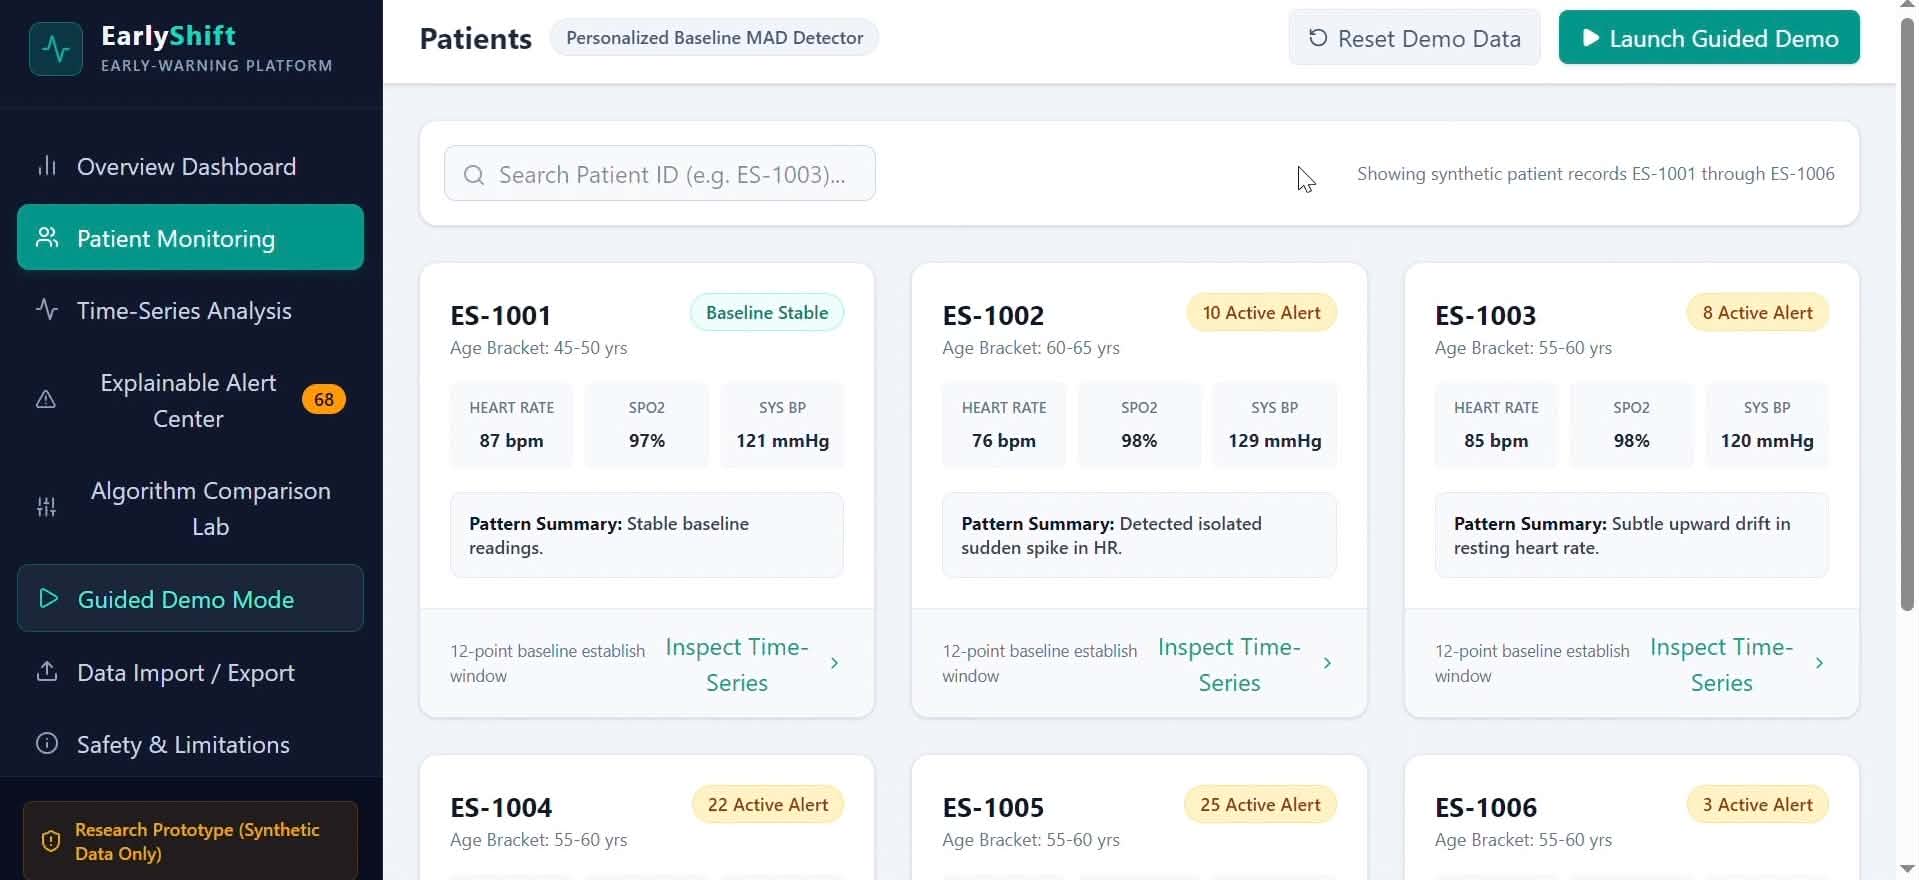
Tab:Patient Monitoring
Inspiration
Health problems do not always begin with dramatic symptoms. Sometimes, the earliest clue is a small change that develops over time. I became interested in exploring whether technology could help identify unusual changes in patient vital signs before they become more obvious.
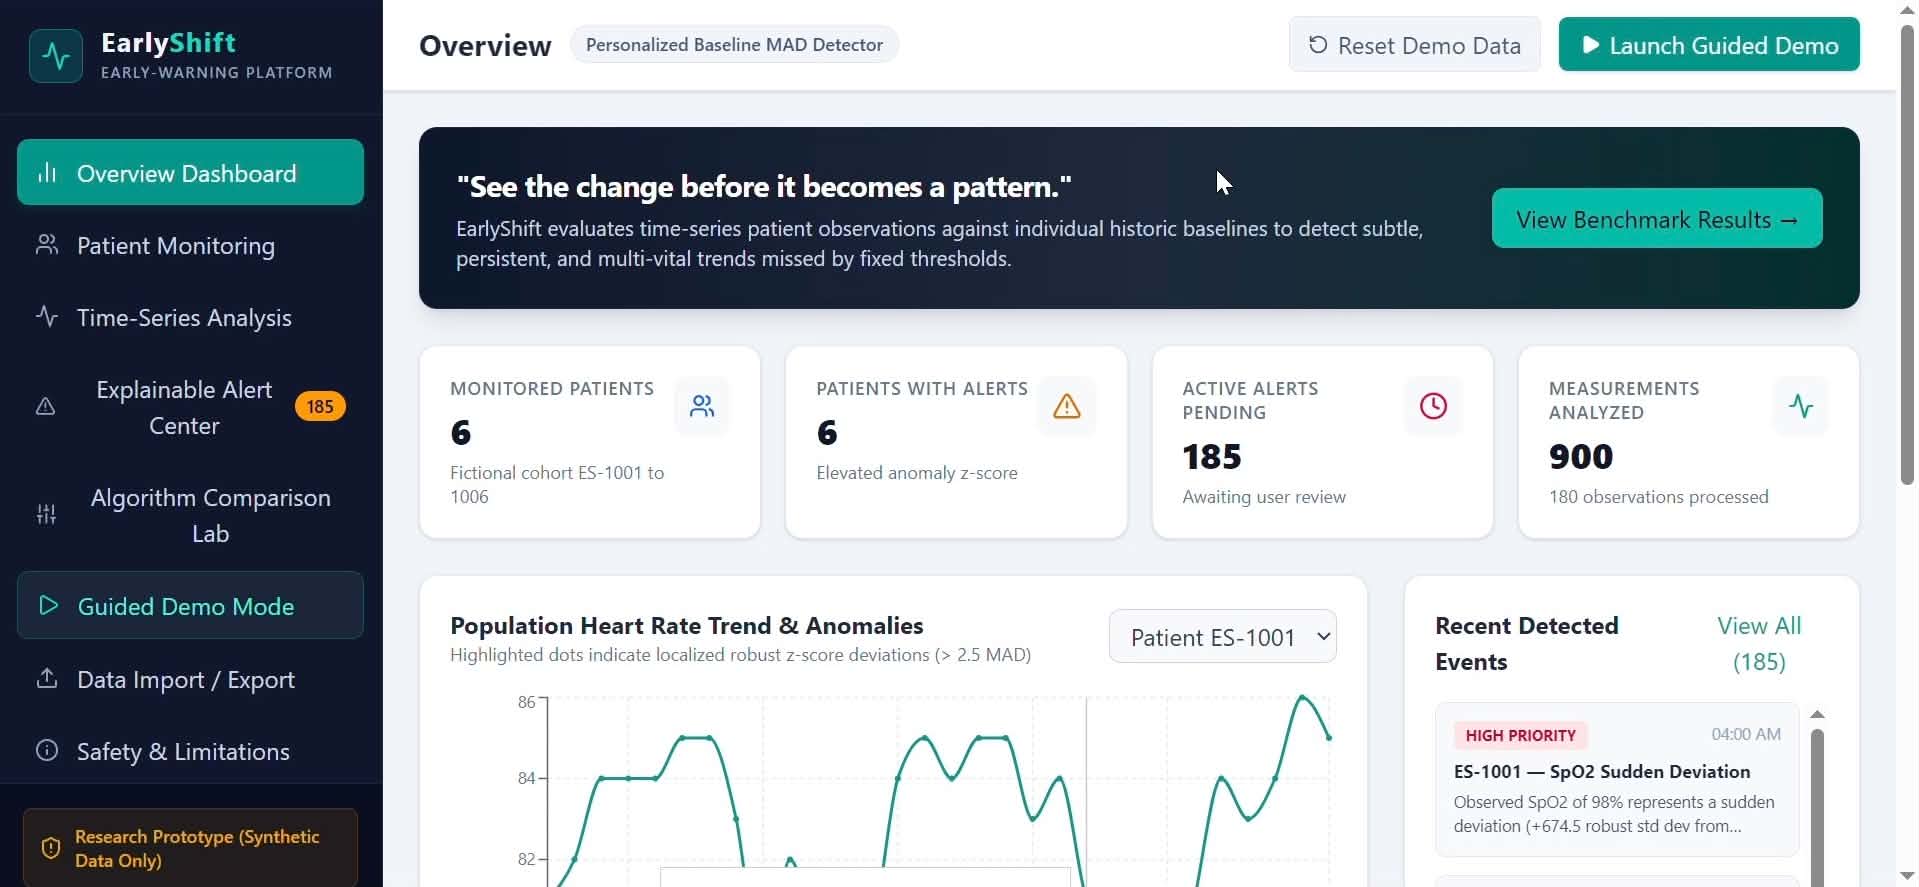
This idea inspired EarlyShift, an AI-assisted early-warning prototype built around one question: what if patient measurements were evaluated not only against standard reference ranges, but also against each patient's usual patterns?
What it does
EarlyShift analyzes patient vital signs over time and compares two approaches to anomaly detection:
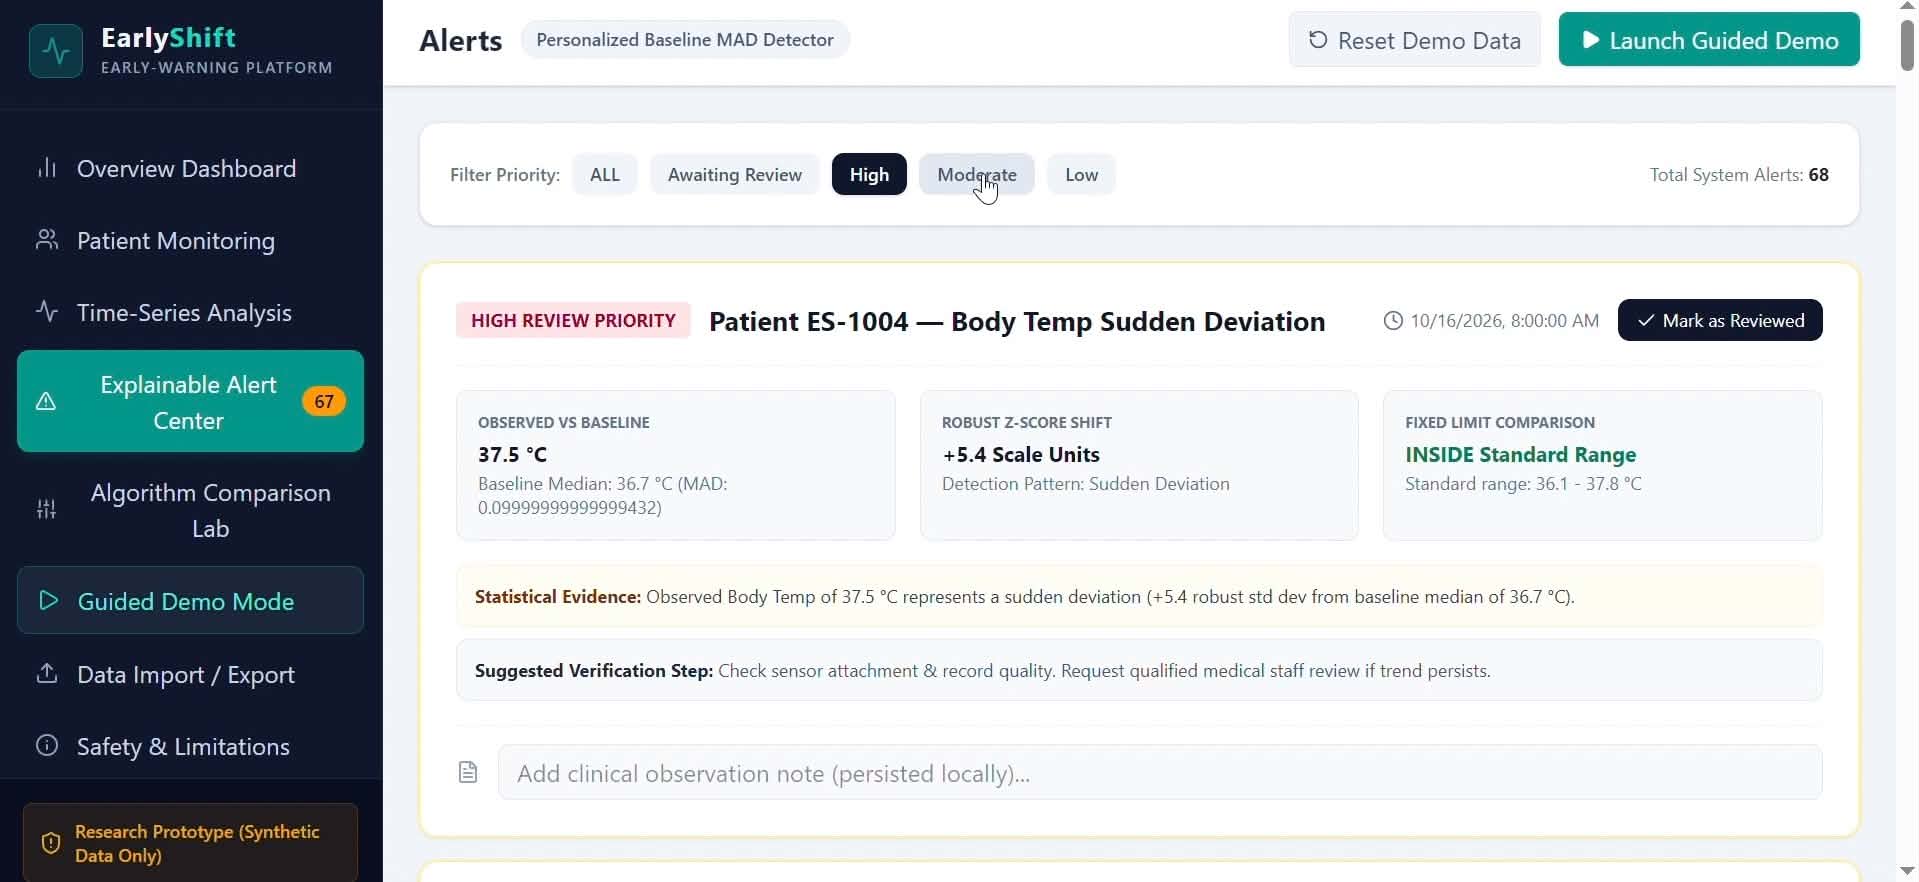
Fixed-threshold detection: Measurements outside predefined reference ranges are flagged. Personalized anomaly detection: Measurements are compared with a patient's baseline to identify unusual changes relative to their typical patterns.
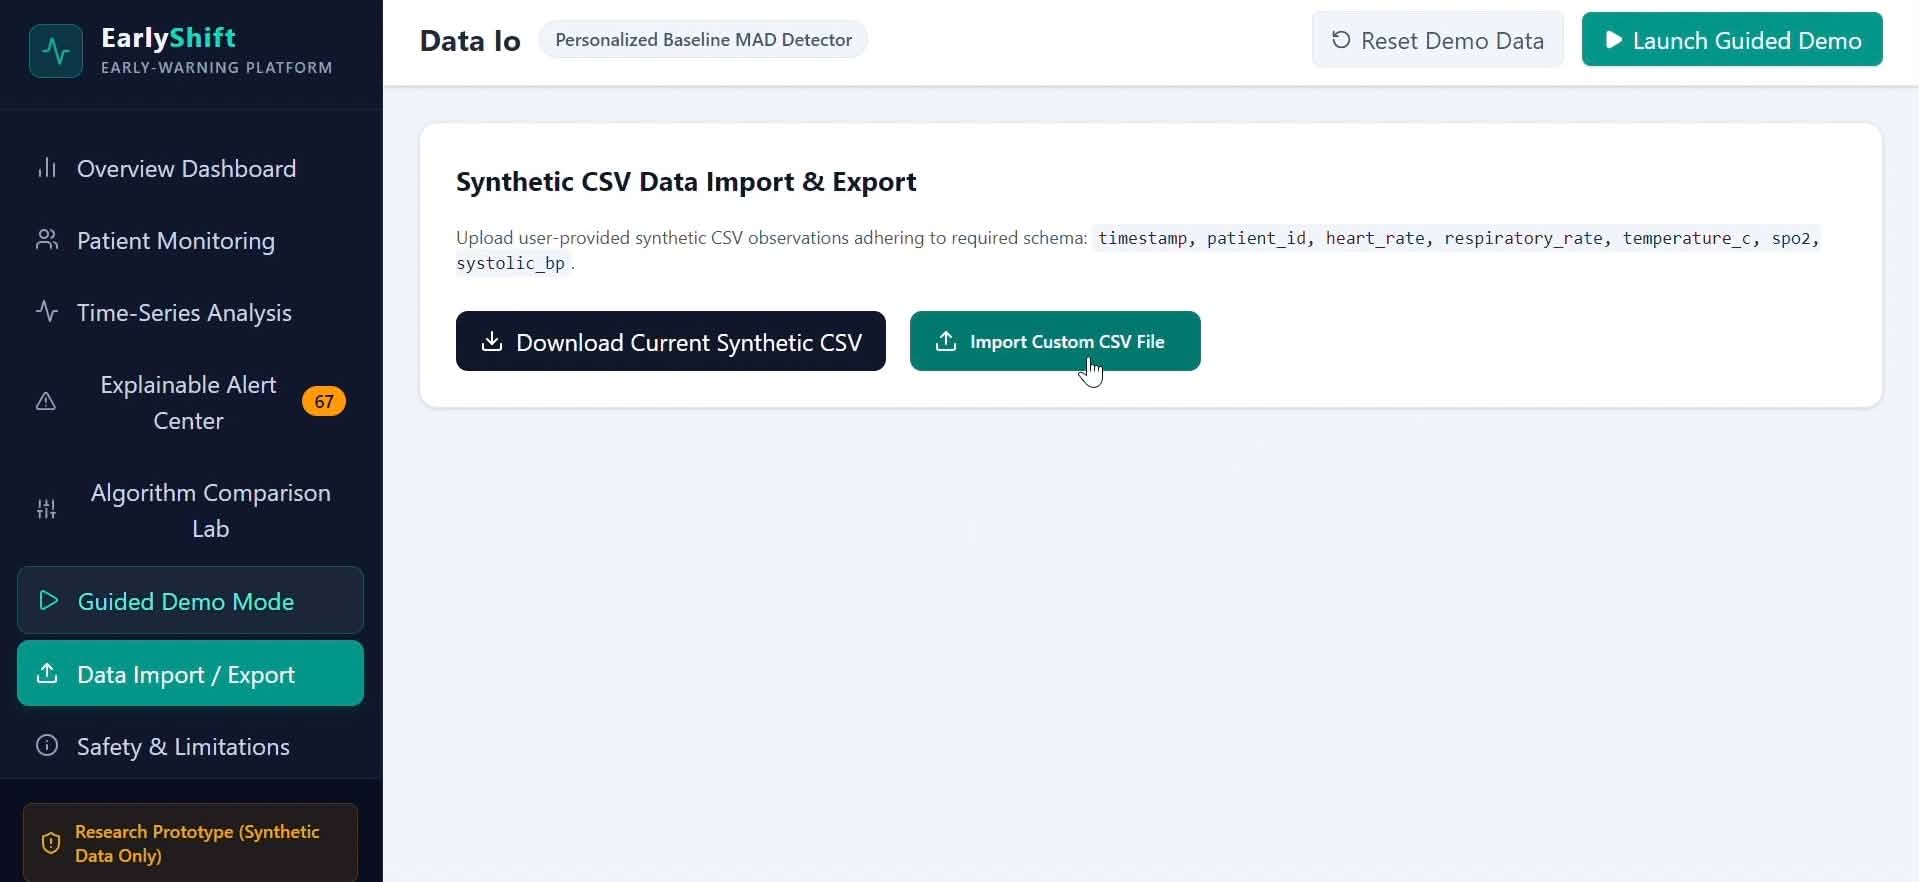
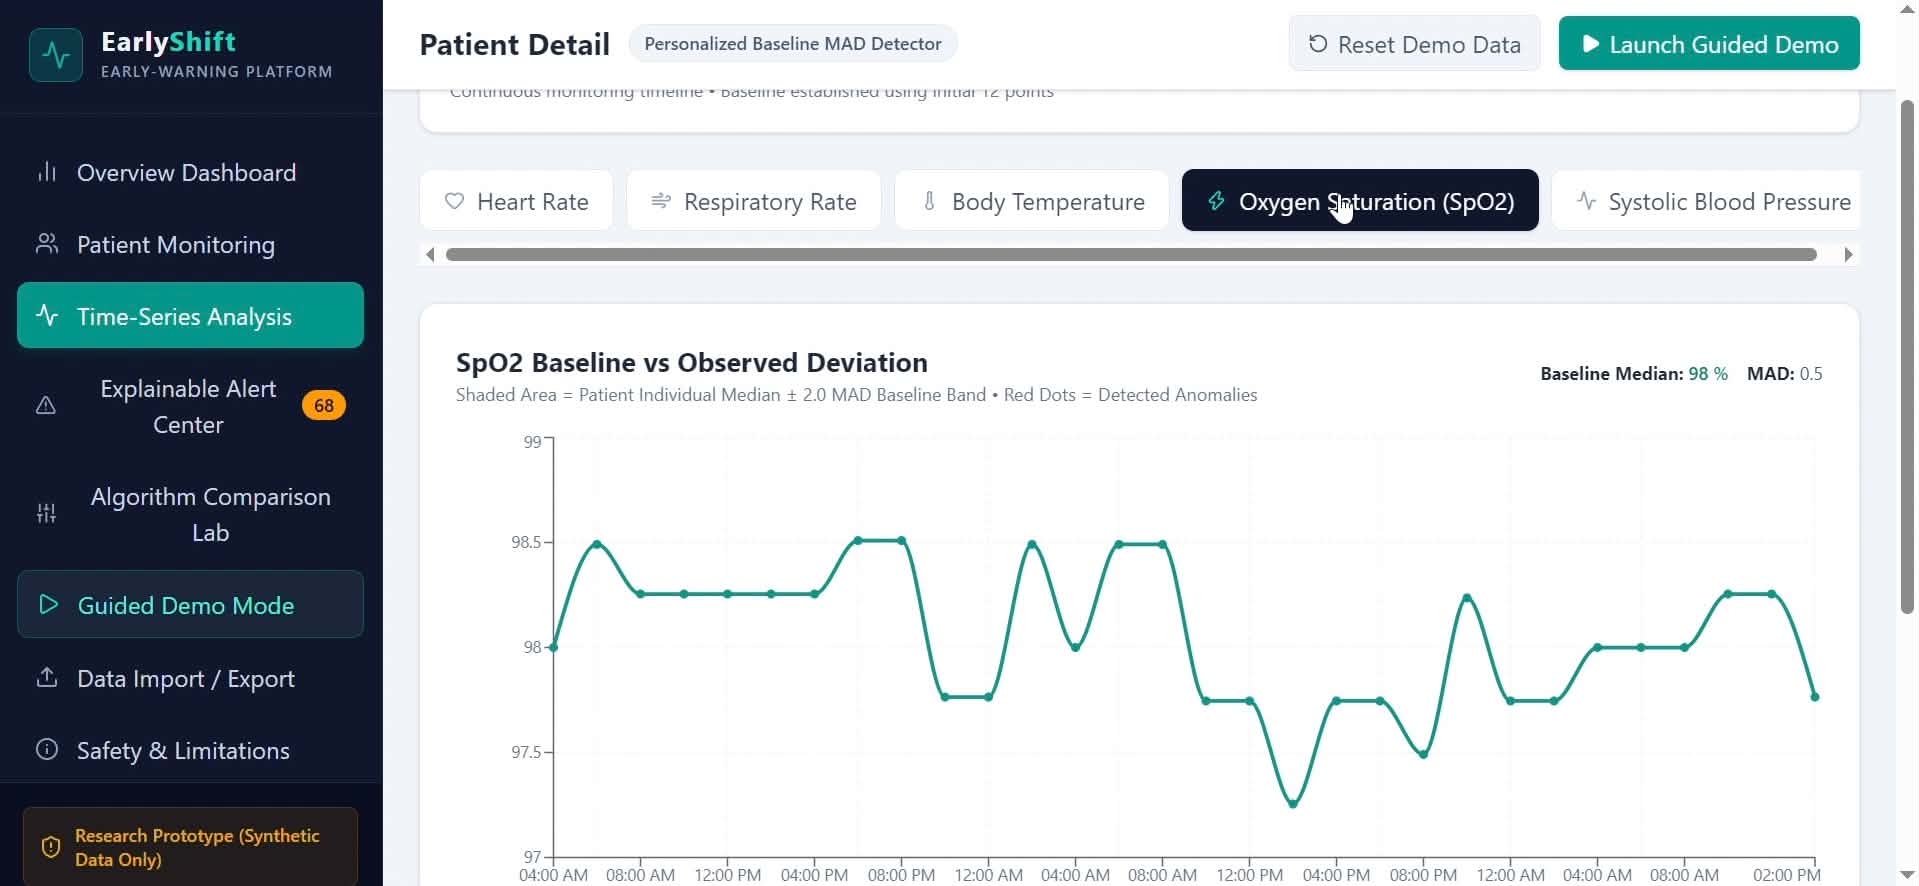
Patient trends, potential anomalies, alerts, and algorithm comparisons are displayed through an interactive dashboard. A guided demonstration and CSV data import and export features are also included.
The prototype is powered by synthetic patient data containing simulated sudden spikes, gradual changes, persistent shifts, and missing measurements.
How I built it
EarlyShift was developed as a web application using React and Vite. Tailwind CSS was used for styling, Recharts for data visualization, and Lucide React for interface icons.
For personalized anomaly detection, statistical techniques such as the median, median absolute deviation (MAD), and robust z-scores were implemented. These methods allow new measurements to be compared with a baseline while reducing the influence of extreme values. Additional logic was developed to identify sudden changes, gradual drift, and persistent deviations.
A synthetic dataset was created to represent different scenarios, and an interactive dashboard was designed to make the results easier to explore and interpret.
Challenges I faced
One of the main challenges was distinguishing an unusual measurement from a meaningful pattern. A value can remain within a standard reference range while differing significantly from a patient's usual measurements. On the other hand, a single unusual reading does not necessarily indicate a serious health problem.
Other challenges included accounting for noisy data, missing measurements, baseline selection, and the possibility of false alerts. Care was also taken to make the interface informative without implying that every detected anomaly represents a medical emergency.
What I learned
Through this project, I learned how statistical methods can be applied to healthcare-related problems and how an initial idea can be developed into an interactive application. I also gained experience with React, data visualization, synthetic data generation, and anomaly detection.
Most importantly, I learned that building an early-warning system requires more than generating alerts. Its results must be evaluated carefully, uncertainty must be communicated clearly, and the limitations of the system must be acknowledged.
What's next?
Future development could include more rigorous evaluation on carefully selected datasets, improved handling of missing data, clearer explanations for individual alerts, and feedback from healthcare professionals. Clinical use would require appropriate validation, privacy safeguards, and expert oversight.
EarlyShift is an experimental prototype, not a diagnostic tool. It currently uses synthetic data and has not been clinically validated. Its purpose is to explore how personalized vital-sign monitoring could complement conventional threshold-based approaches.
Built With
- anomaly-detection
- artificial-intelligence
- data-visualization
- healthcare
- healthtech
- javascript
- lucide-react
- preventive
- react
- recharts
- tailwind-css
- vite

Log in or sign up for Devpost to join the conversation.